

BREAKING · Poll release
Northeast Tennessee Text Poll: Hatley at 36% Among 762 Self-Selected Respondents in Five Counties; Hatley says the momentum in Northeast TN is spreading fast with huge turnouts at all of his Tennessee wide rallies
FOR IMMEDIATE RELEASE · October 19, 2026
Media contact: Campaign Communications, Hatley for Governor, (423) 398-8749, press@hatleyforgovernor.com
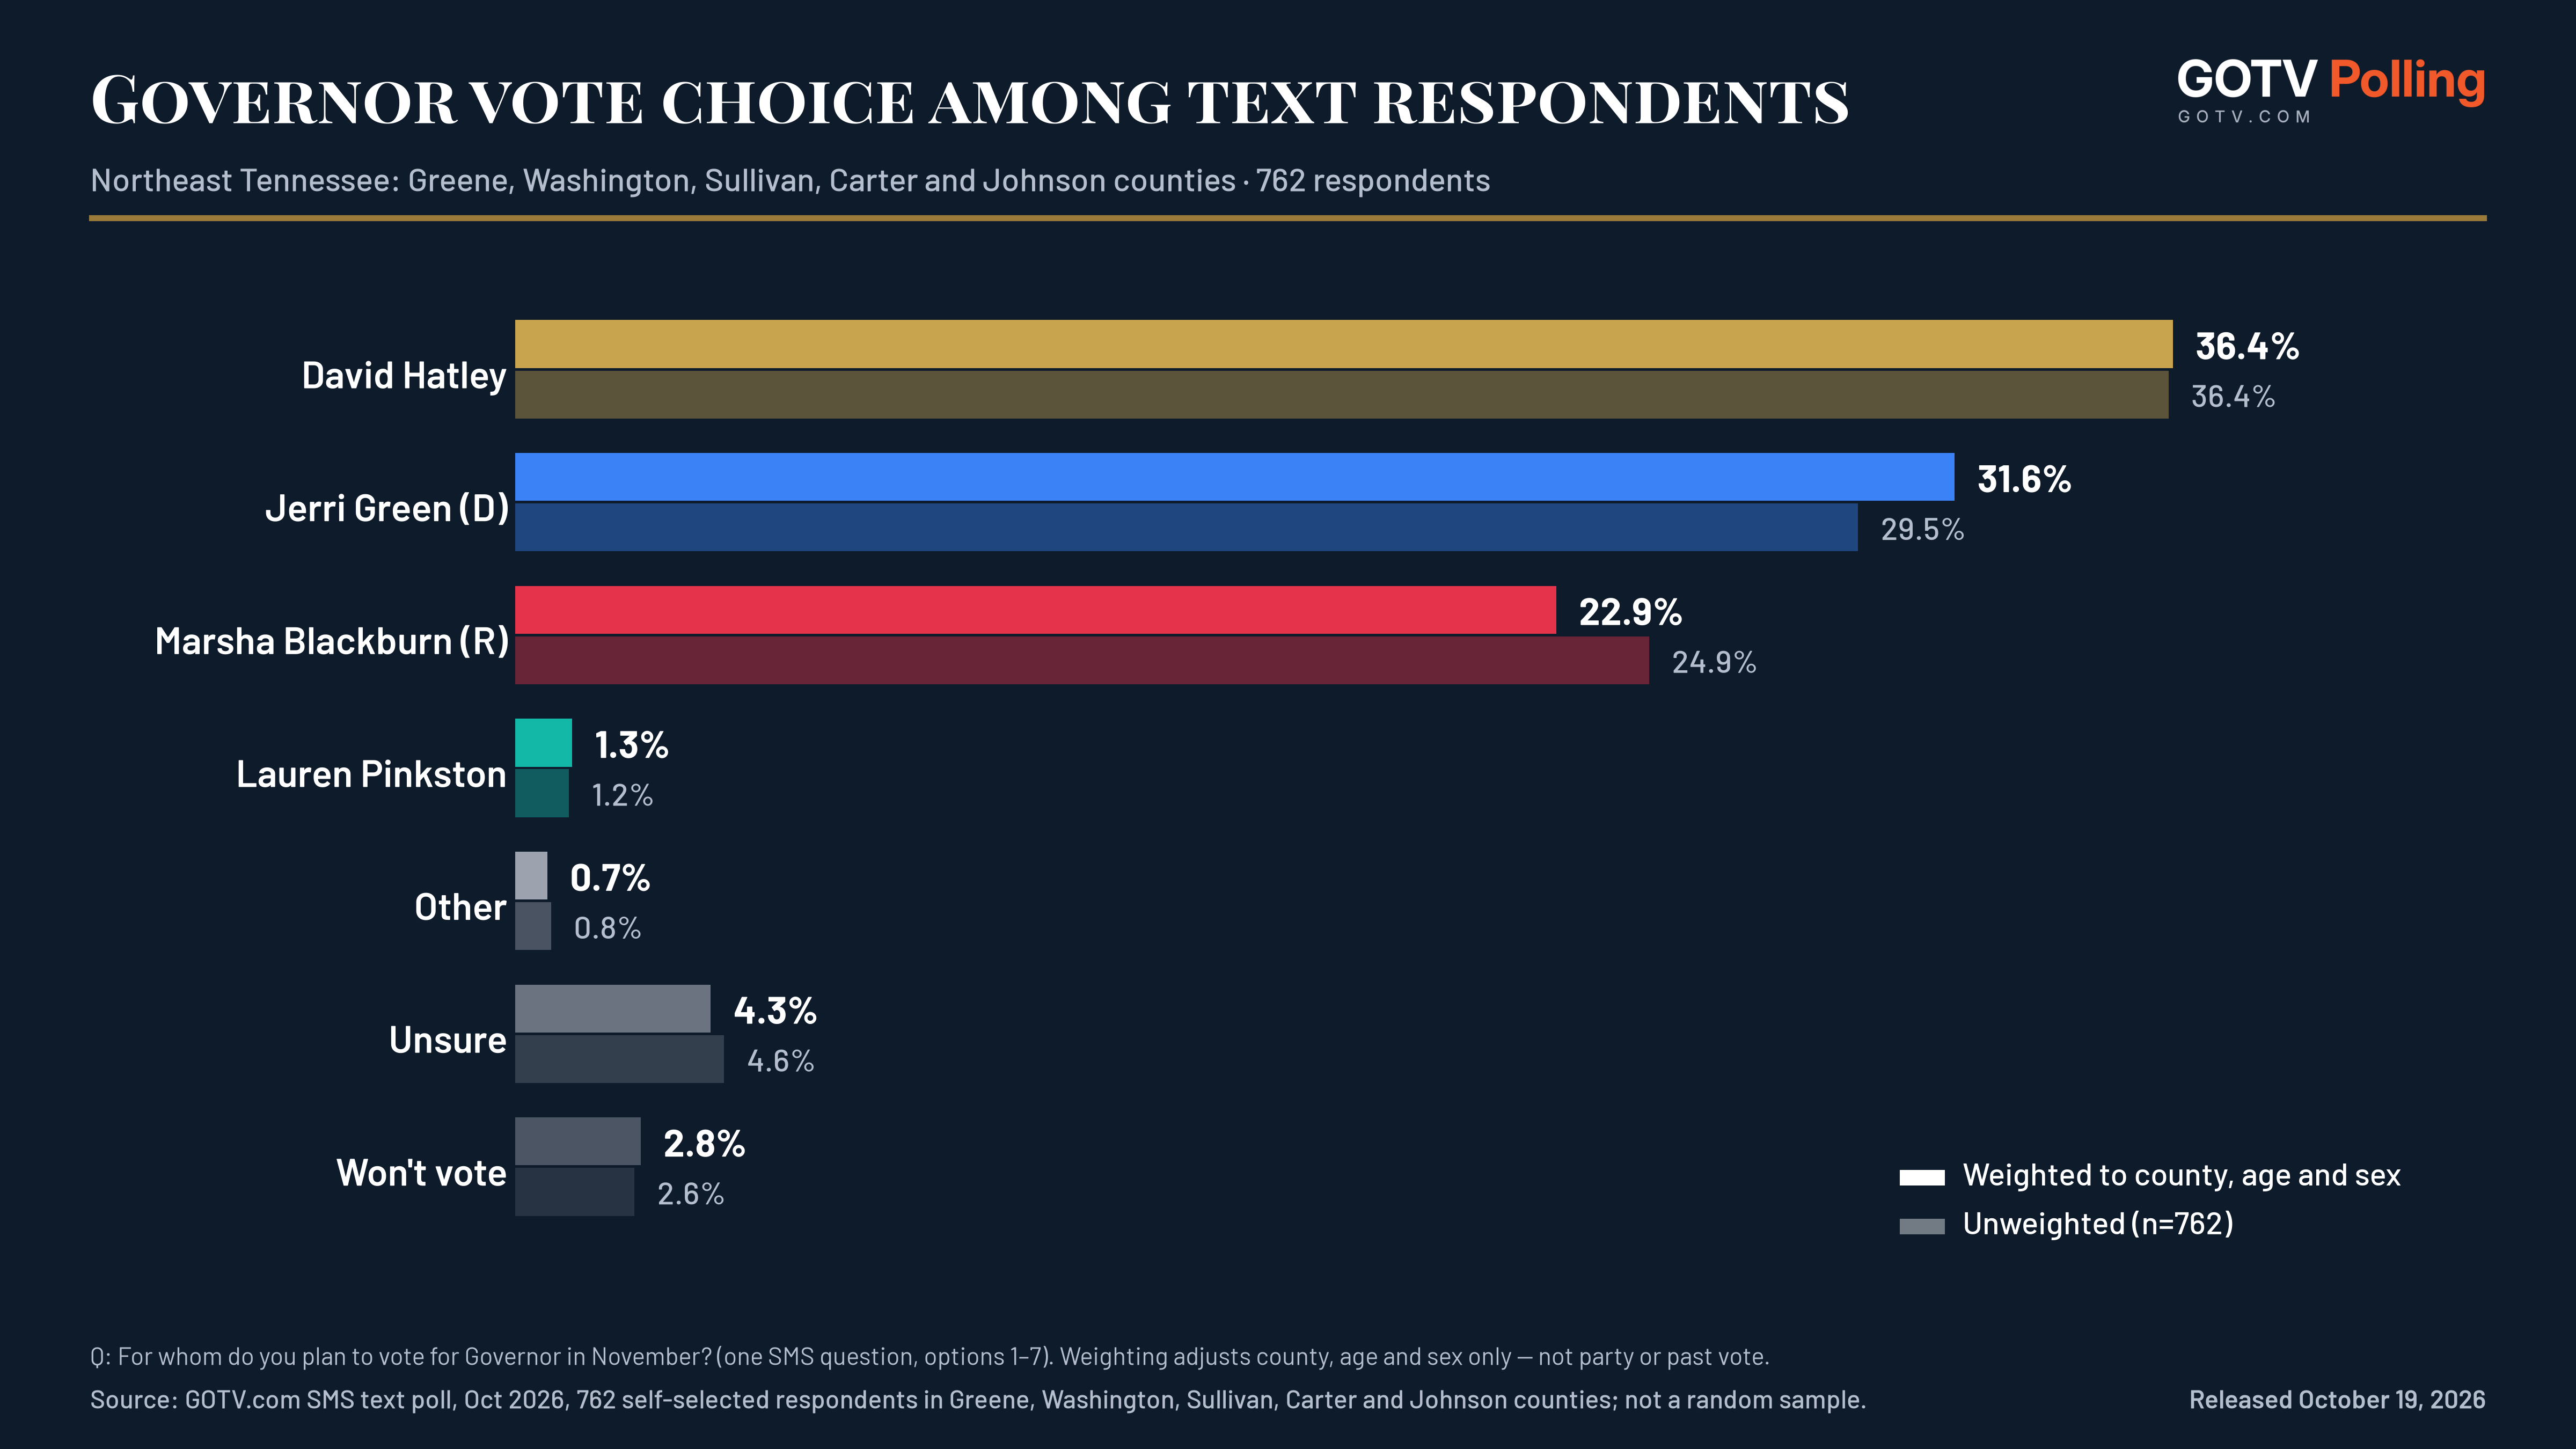
- AMONG 762 TEXT RESPONDENTS IN FIVE NORTHEAST TENNESSEE COUNTIES (UNWEIGHTED): HATLEY 36.4%, GREEN 29.5%, BLACKBURN 24.9%, PINKSTON 1.2%; 4.6% UNSURE
- WEIGHTED TO COUNTY, AGE AND SEX ONLY: HATLEY 36.4%, GREEN 31.6%, BLACKBURN 22.9%
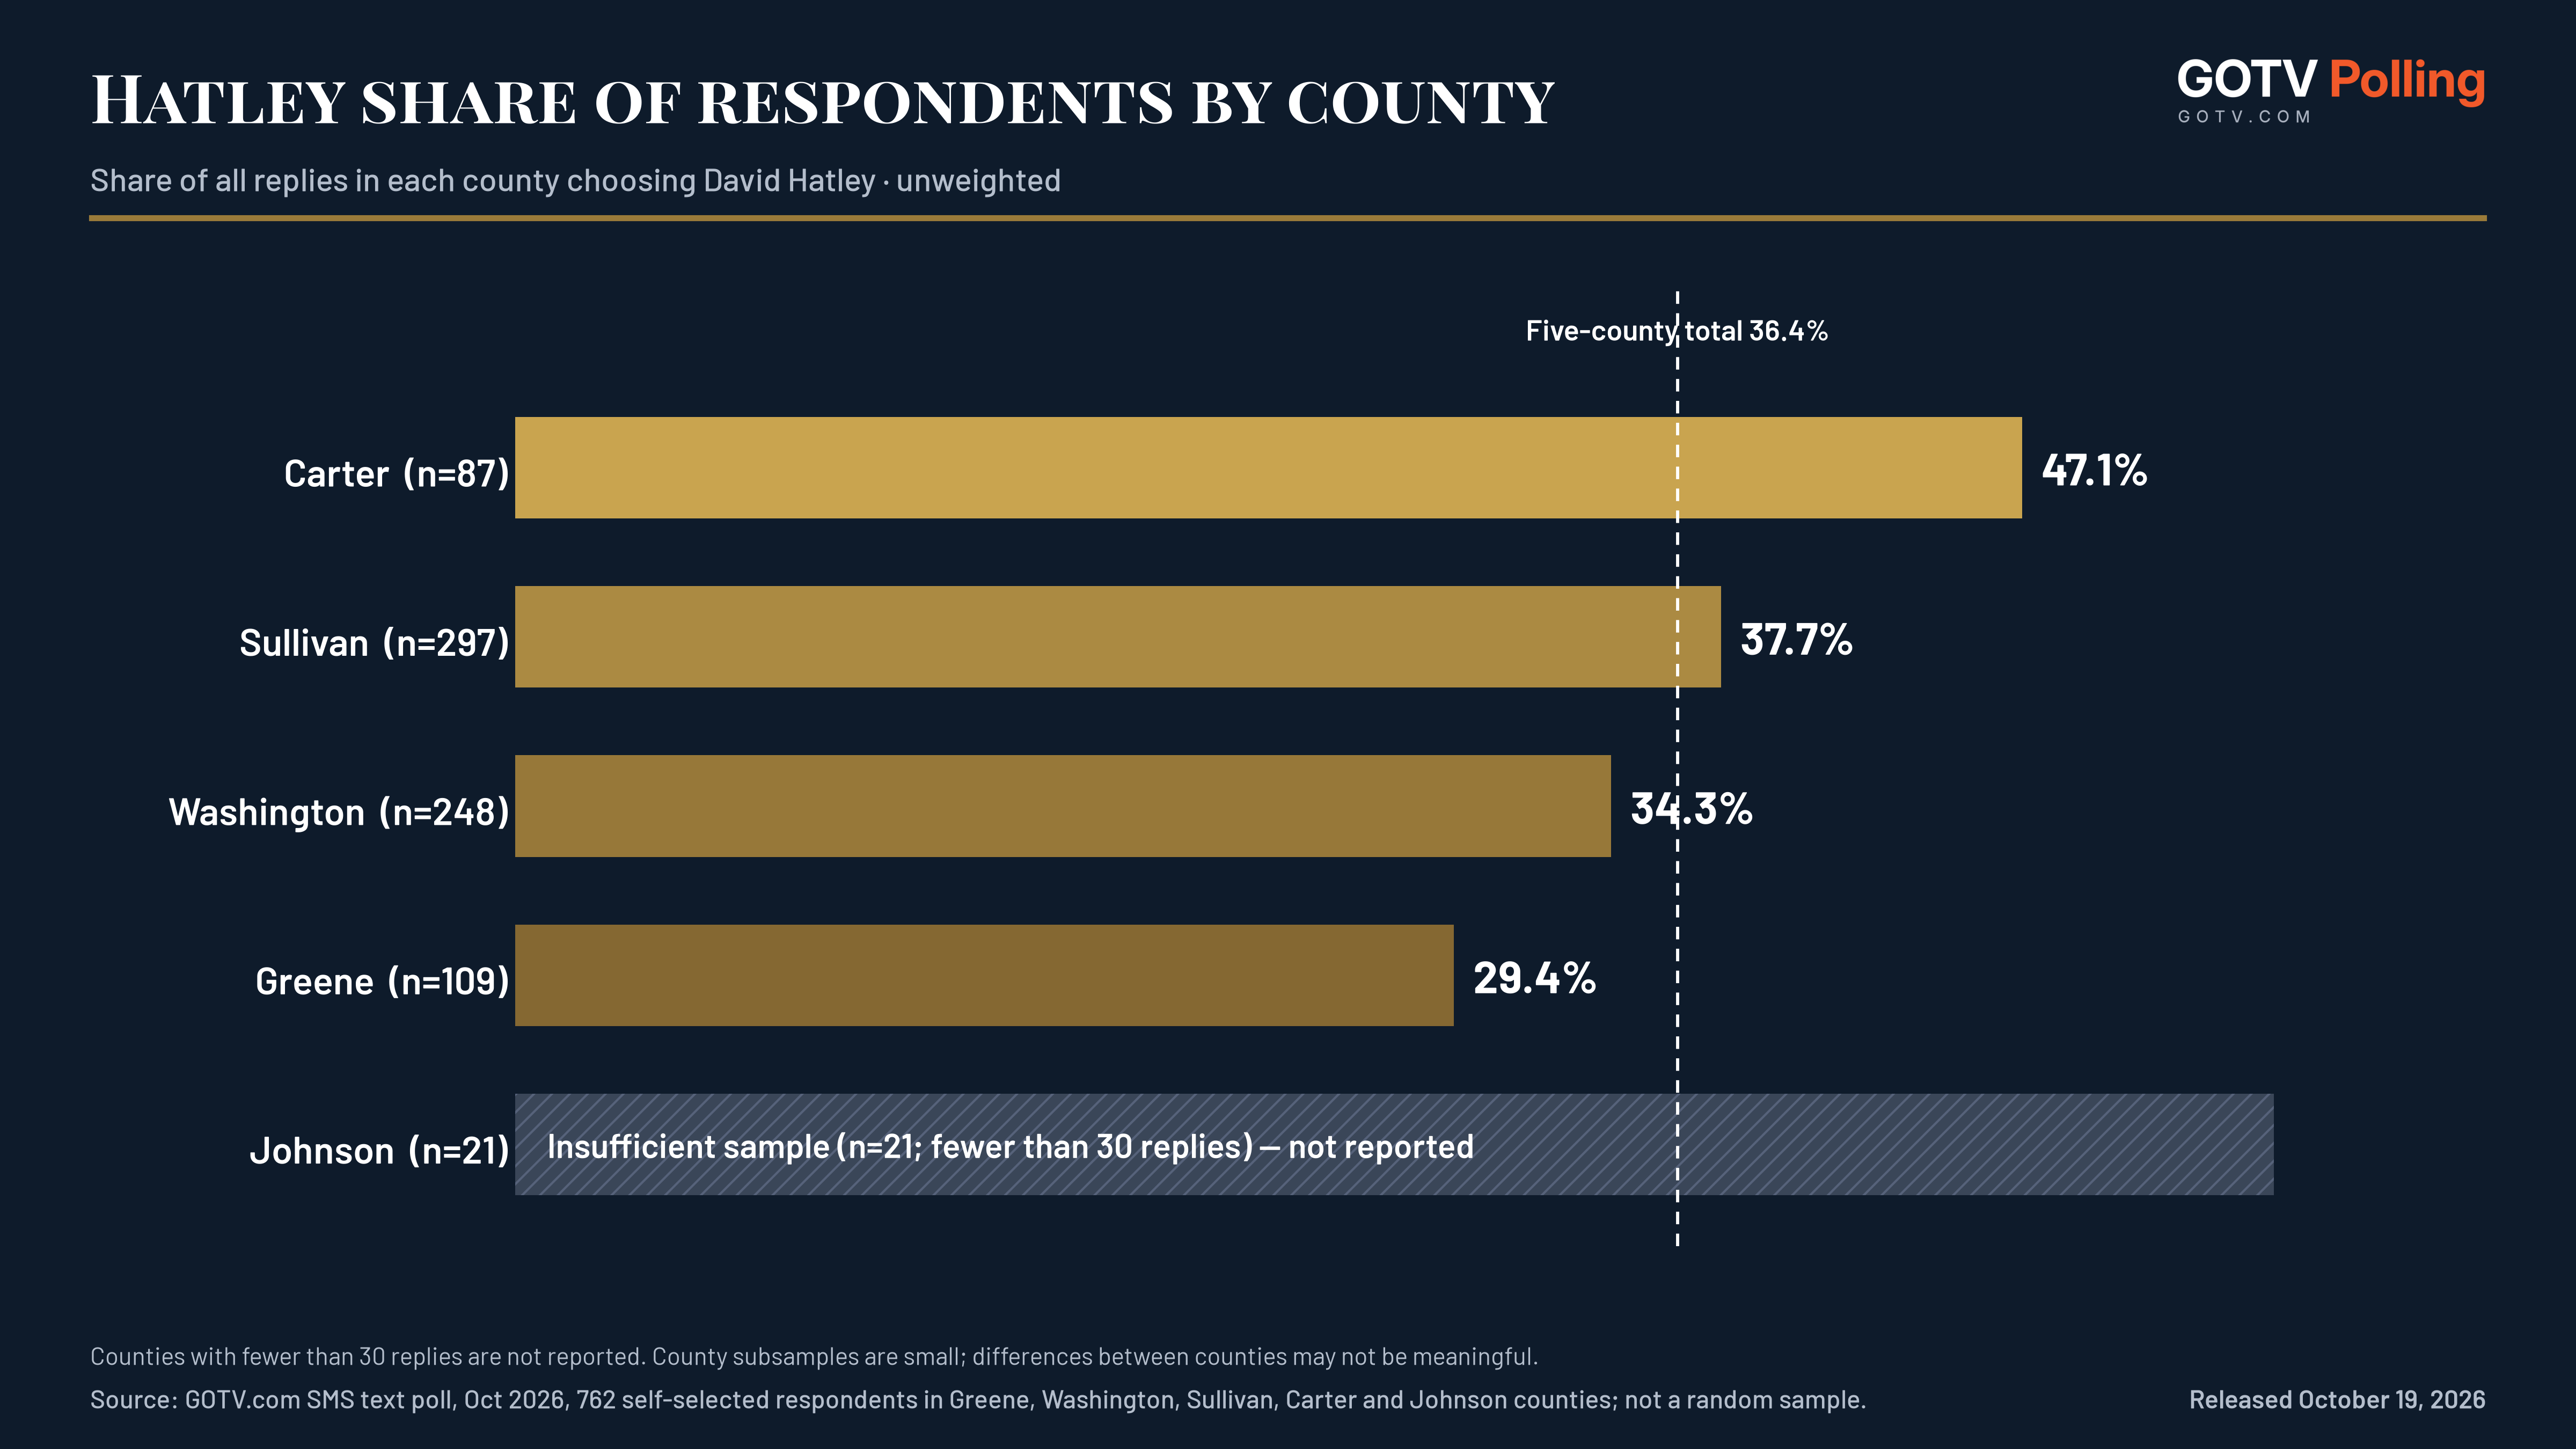
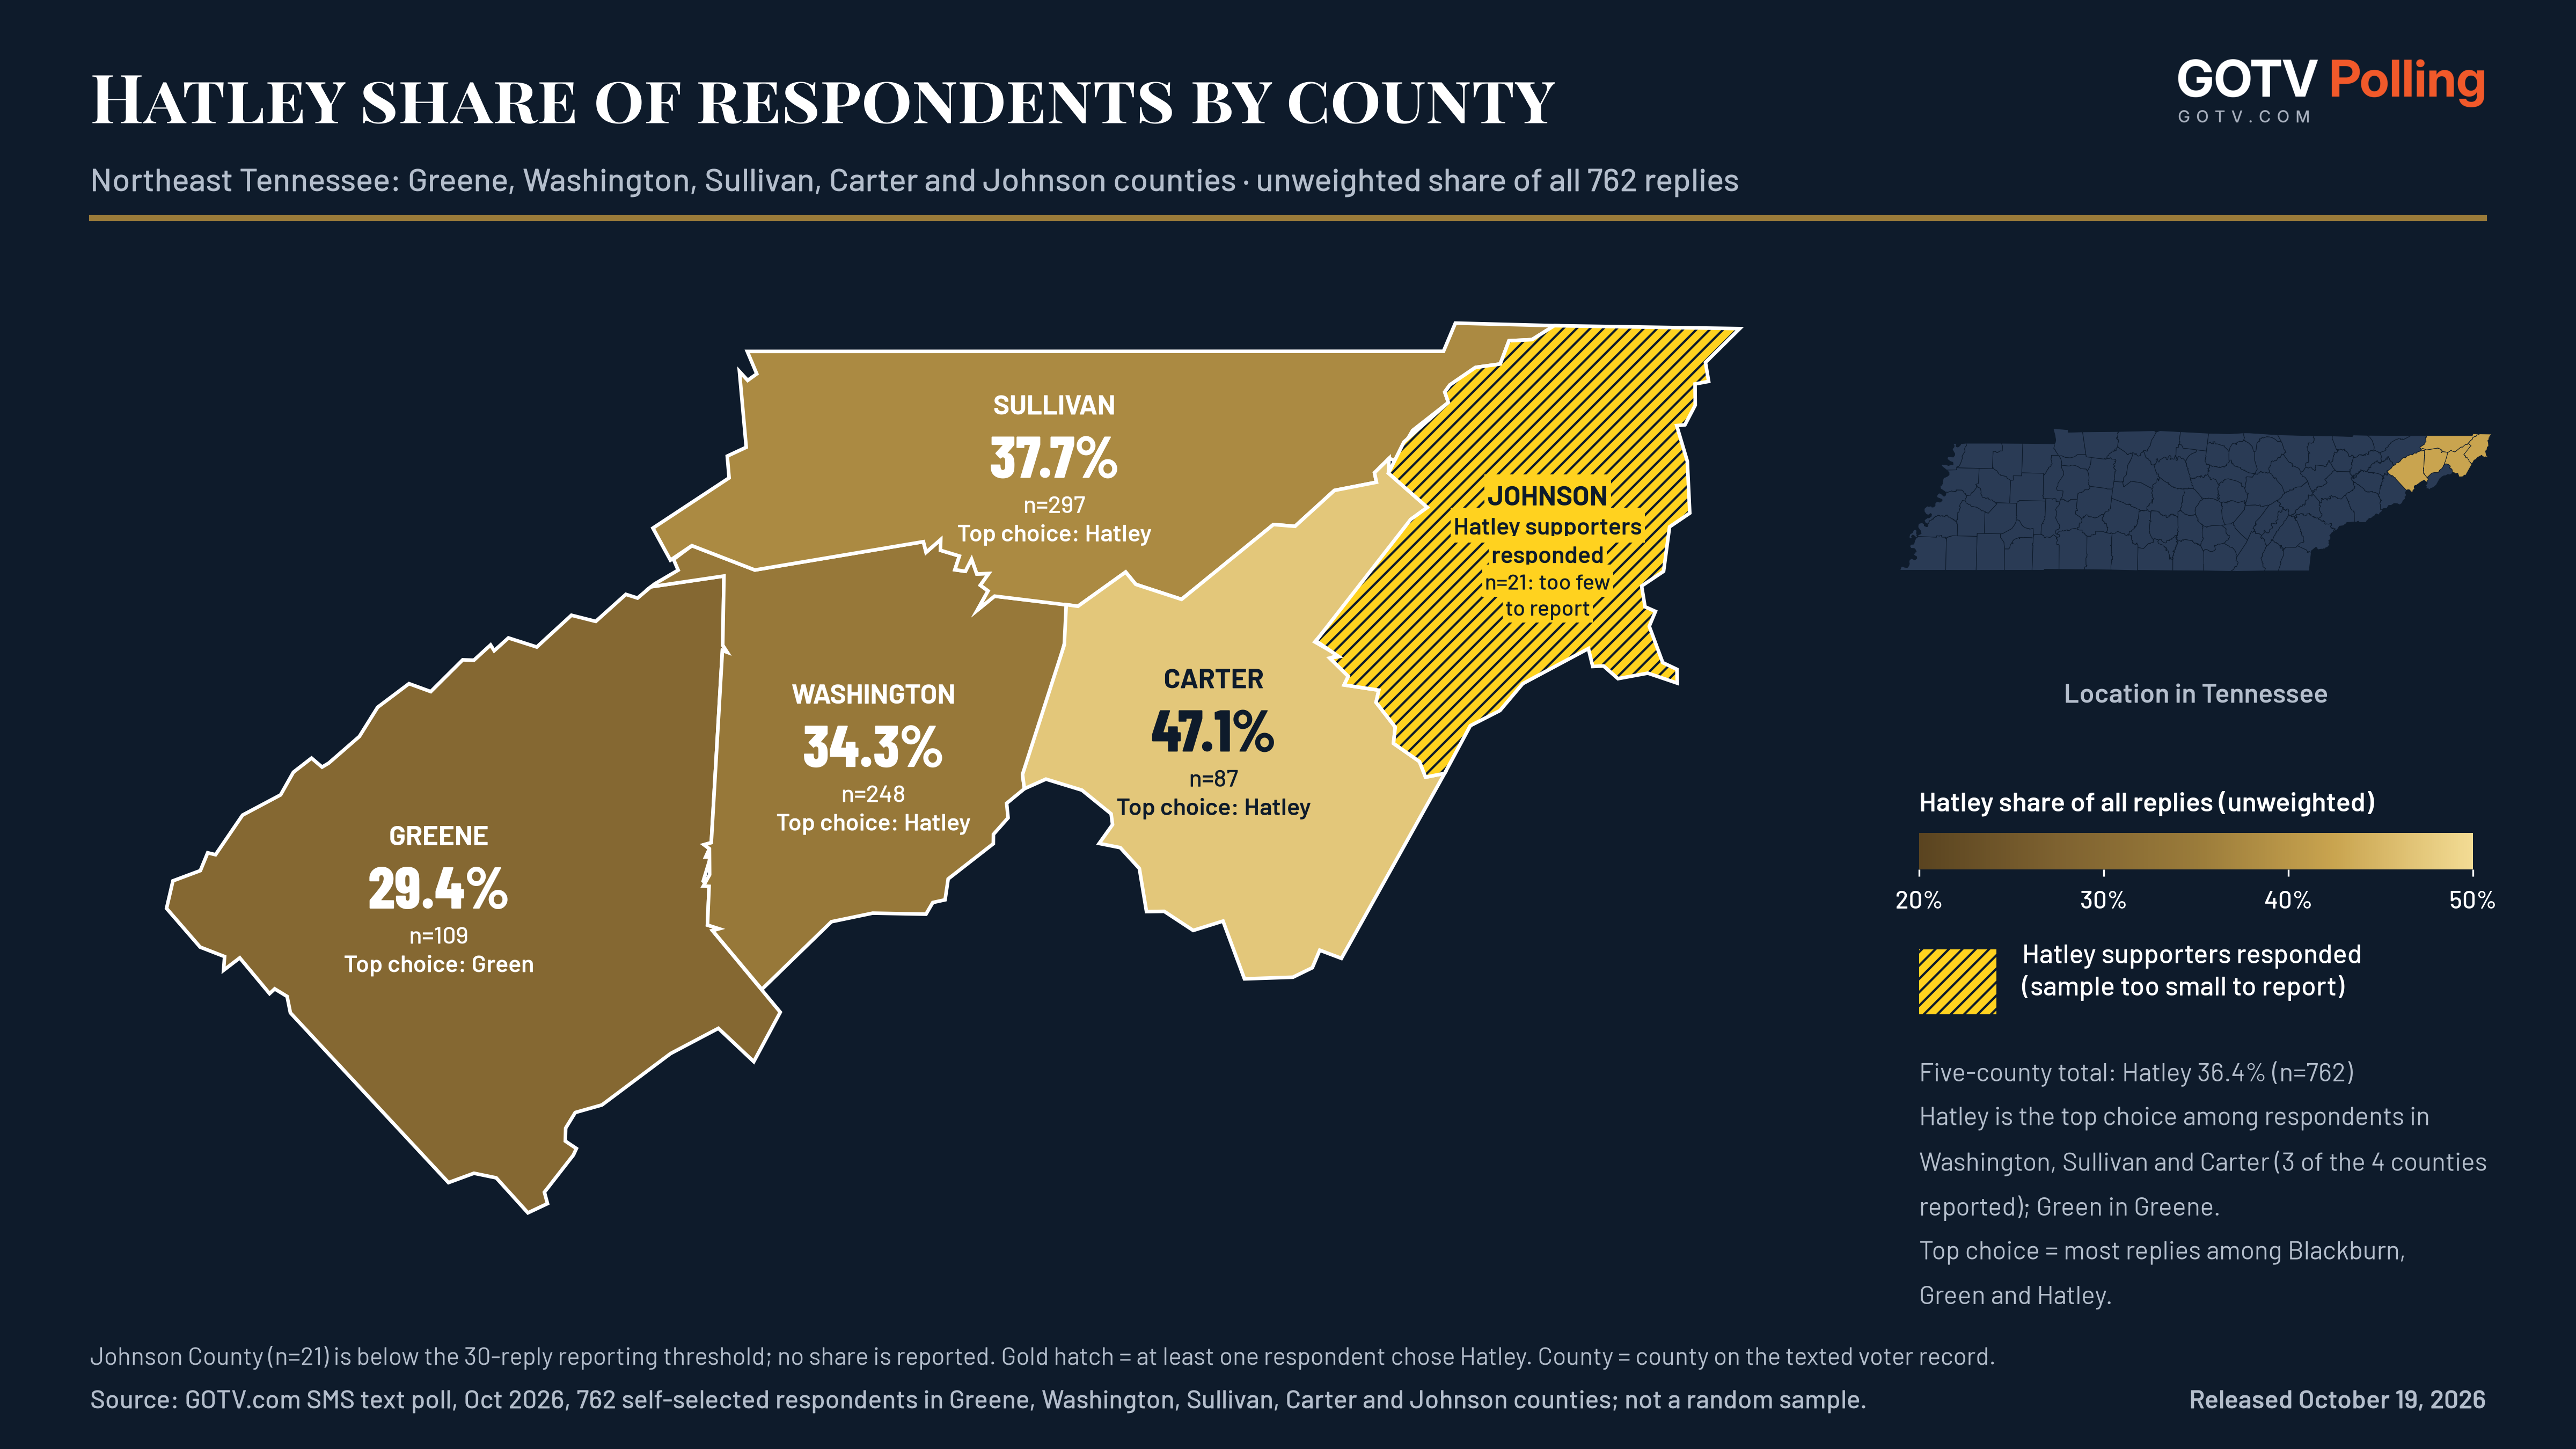
- HATLEY BY COUNTY AMONG RESPONDENTS: SULLIVAN 37.7% (N=297); WASHINGTON 34.3% (N=248); GREENE 29.4% (N=109); CARTER 47.1% (N=87); JOHNSON: 21 REPLIES, TOO FEW TO SHOW A PERCENTAGE (FEWER THAN 30)
- RESPONDENTS SKEW DEMOCRATIC: GREEN 54.2% OF BLACKBURN+GREEN REPLIES VS HARRIS 22.9% OF THE 2024 TWO-PARTY VOTE IN THESE COUNTIES — SMALL, SELF-SELECTED SAMPLE; RESULTS ARE NOT A FORECAST
Margin of error: ±3.6 percentage points (n=762, 95% confidence). Unweighted self-selected text replies; weighted columns adjust for county, age and sex only.
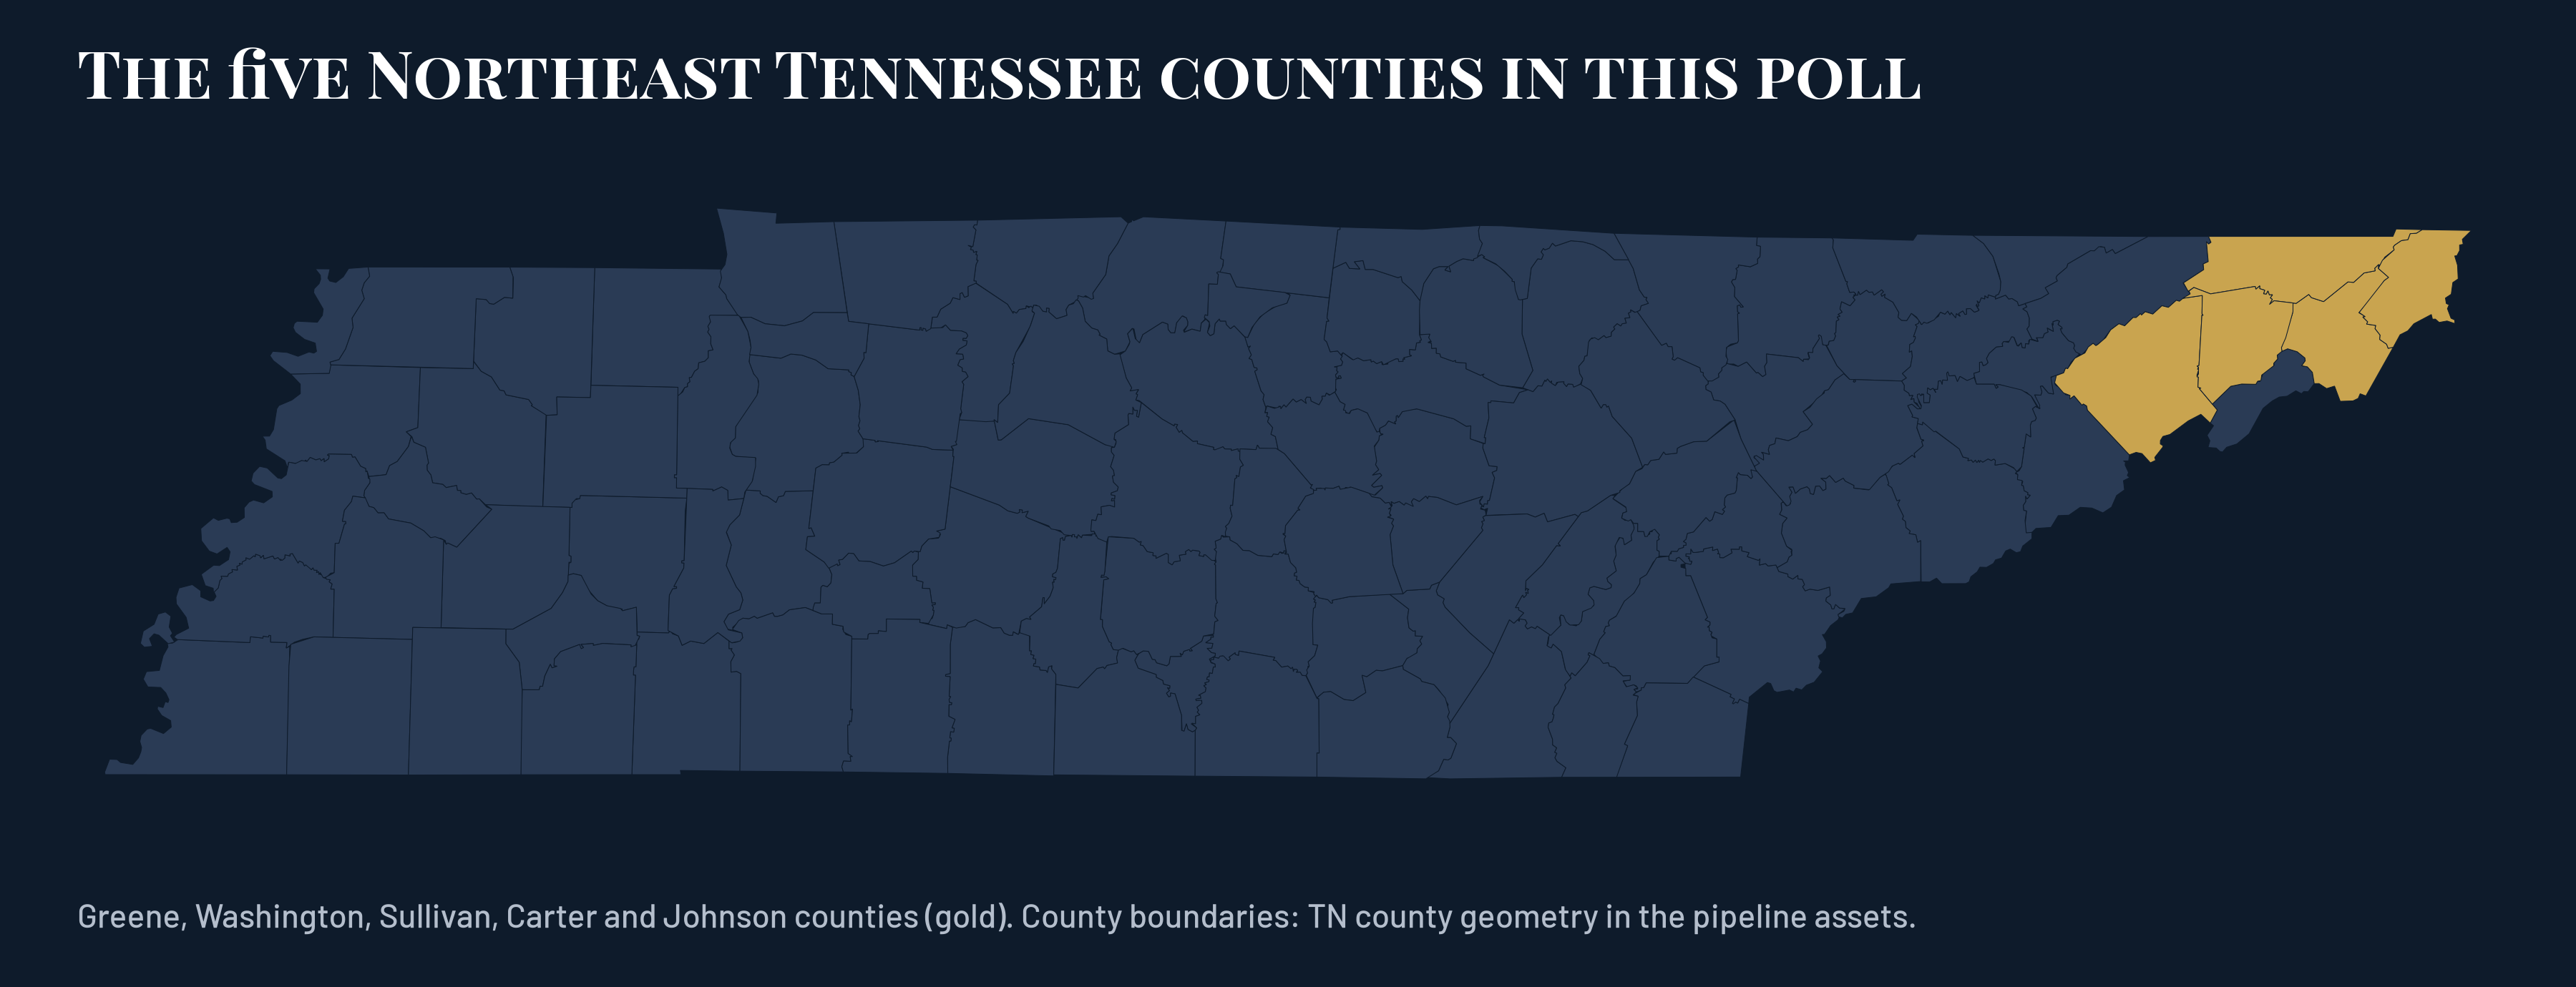
JOHNSON CITY, Tenn. / October 19, 2026: Hatley for Governor today released Northeast Tennessee results from its text-message poll: 762 voter-file contacts in Greene, Washington, Sullivan, Carter and Johnson counties replied to a one-question text survey sent on October 17, 2026 by GOTV Polling (FullPAC, Inc., GOTV.com) with analysis by GOTV Intel. The poll was commissioned and paid for by Hatley for Governor, the campaign committee of gubernatorial candidate David Hatley.
Among respondents in the five counties, 36.4% chose David Hatley, 29.5% Jerri Green (D), 24.9% Marsha Blackburn (R) and 1.2% Lauren Pinkston; 0.8% chose another candidate, 4.6% were unsure and 2.6% said they won't vote (unweighted). The poll asked one question, vote choice for Governor. Toplines, crosstabs and key results are available at gotvpolling.com/polls/hatley-northeast-tn-2026-10-19.
How to read these results. These are replies from 762 people in Greene, Washington, Sullivan, Carter and Johnson counties who chose to answer a one-question text message. Respondents lean far more Democratic than these counties voted in 2024: Green has 54.2% of Blackburn-plus-Green replies, while Kamala Harris won 22.9% of the 2024 two-party vote in the five counties combined (+31.3 points), and within each county with at least 30 Blackburn-plus-Green replies, replies run a median 29.4 points more Democratic than the county voted in 2024. Weighting to county, age and sex (the only demographics available, and age and sex only for some respondents) moves Green from 29.5% to 31.6% and Blackburn from 24.9% to 22.9%, and leaves Hatley at 36.4% (36.4% unweighted). Party, race, education and 2024 vote were not collected, so the results cannot be corrected for the partisan skew. The base is small (n=762; county subsamples 21–297), so county and demographic subgroup figures rest on few replies. Margin of error: ±3.6 percentage points (n=762, 95% confidence). The figures describe respondents only and are not a prediction of the election.
“This clarifies what we are seeing across this state: people want change,” said David Hatley. “I’m grateful for every single voter who trusts me with their support, and I don’t take one of them for granted. Nobody handed us 36% across these five counties. We earned it, from 29.4% in Greene County to 47.1% in Carter County. That’s what happens when you show up and ask people for their vote.”
“Marsha Blackburn has been in Congress since 2003. She no longer takes real questions from her constituents, and she believes she’s entitled to the Governor’s office,” the Hatley for Governor campaign said. “Incumbents have every advantage. If she had done even a C-level job, she’d be at 60% in the polls. Among the people who answered this poll in these five counties, she’s at 22.9%.”
“David Hatley is a UNIFIER. The DC Ruling Class tells you elections are zero-sum because for them, they are,” the campaign said. “They have no real grassroots support, so for them winning is about who hits the hardest. When a candidate gets everyday Americans to a political event after a hard day’s work, that’s a sign he’s expanding the electorate.”
“Tennessee voters should ask themselves why corporations would spend close to $5 million attacking David Hatley if he had no shot,” the campaign said. “There’s a deeply American way to ask these questions and hear from the candidates directly. It’s called a DEBATE, and it’s October 27th.”
THE GOVERNOR'S RACE AMONG TEXT RESPONDENTS (FIVE NORTHEAST TENNESSEE COUNTIES)
Unweighted: Hatley 36.4% (277), Green 29.5% (225), Blackburn 24.9% (190), Pinkston 1.2% (9), Other 0.8% (6), Unsure 4.6% (35), Won't vote 2.6% (20); total 762.
Weighted to county, age and sex only (not party or past vote): Hatley 36.4%, Green 31.6%, Blackburn 22.9%, Pinkston 1.3%, Unsure 4.3%.
The question did not offer a leaner follow-up or a certainty question, so soft support cannot be measured from this poll.
HATLEY BY COUNTY AMONG RESPONDENTS
By county: Sullivan 37.7% (n=297); Washington 34.3% (n=248); Greene 29.4% (n=109); Carter 47.1% (n=87); Johnson: 21 replies, too few to show a percentage (fewer than 30).
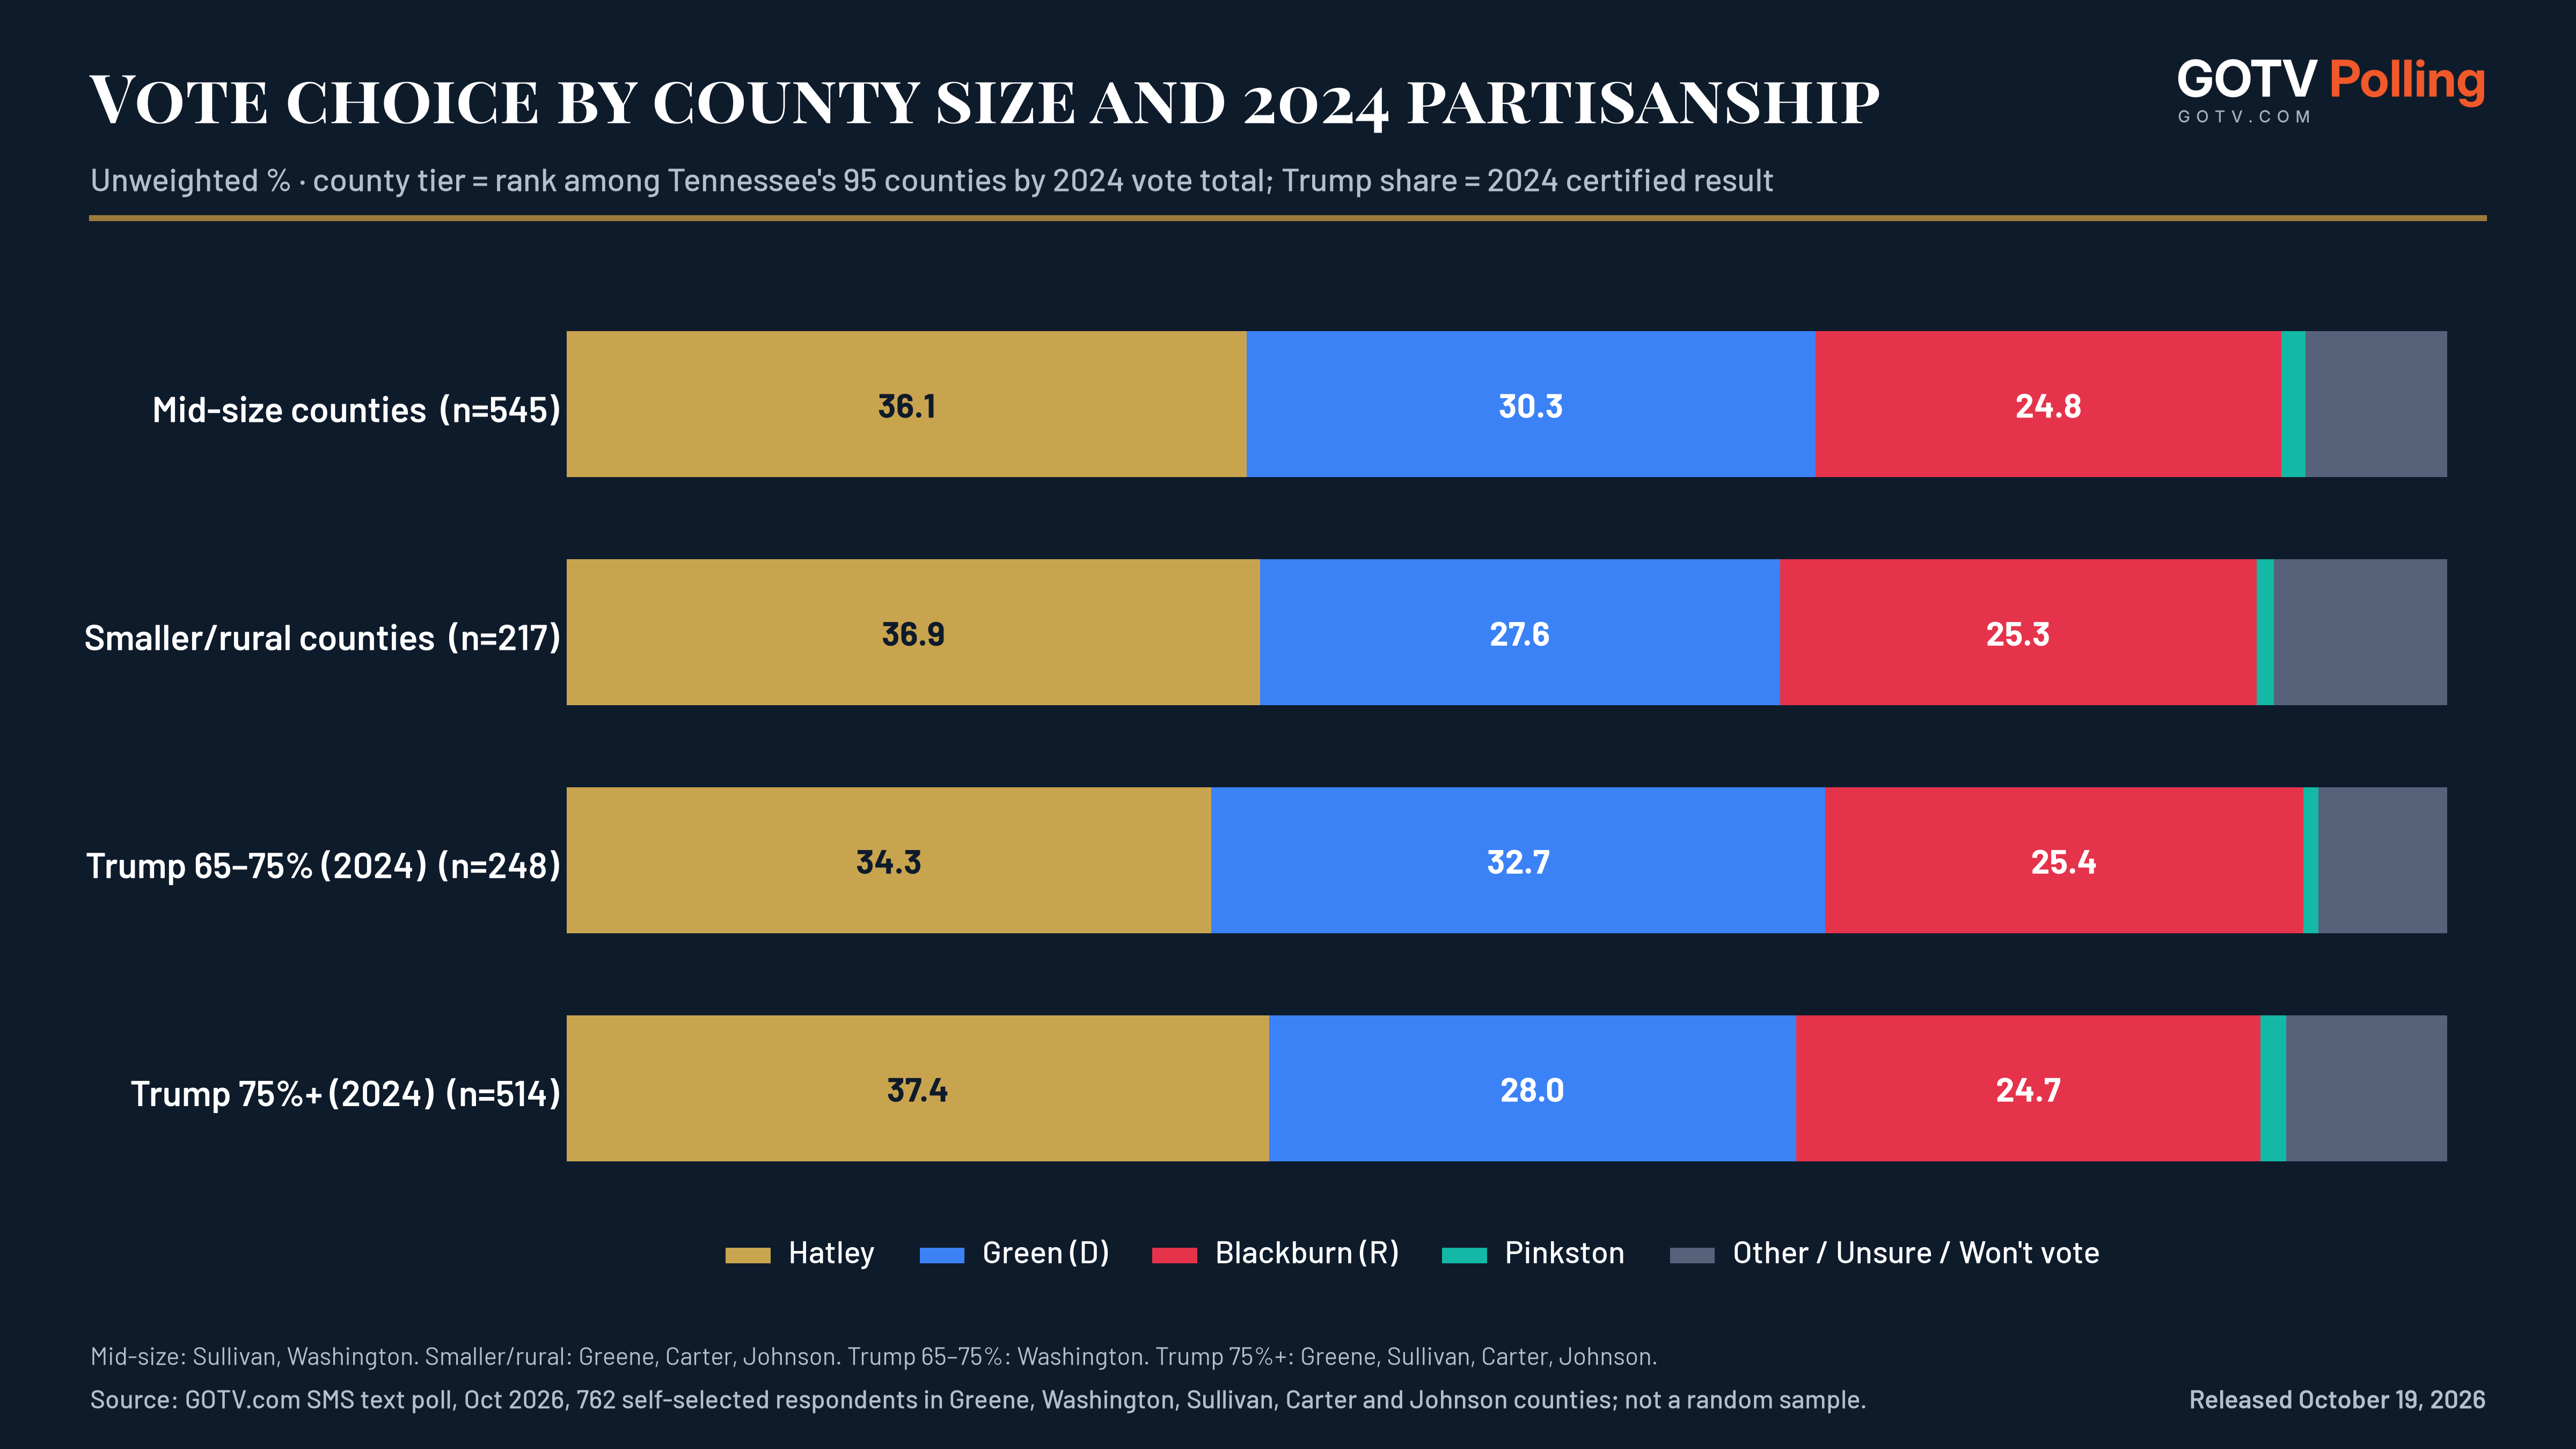
By county size (rank among Tennessee's 95 counties by 2024 vote total): mid-size counties (Washington, Sullivan) 36.1% (n=545); smaller/rural counties (Greene, Carter, Johnson) 36.9% (n=217).
By county partisanship: counties Trump won with 65-75% in 2024 (Washington) 34.3% (n=248); counties Trump won with 75%+ in 2024 (Greene, Sullivan, Carter, Johnson) 37.4% (n=514).
County subsamples are small (n=21–297); differences between counties may not be meaningful.
WHO RESPONDED
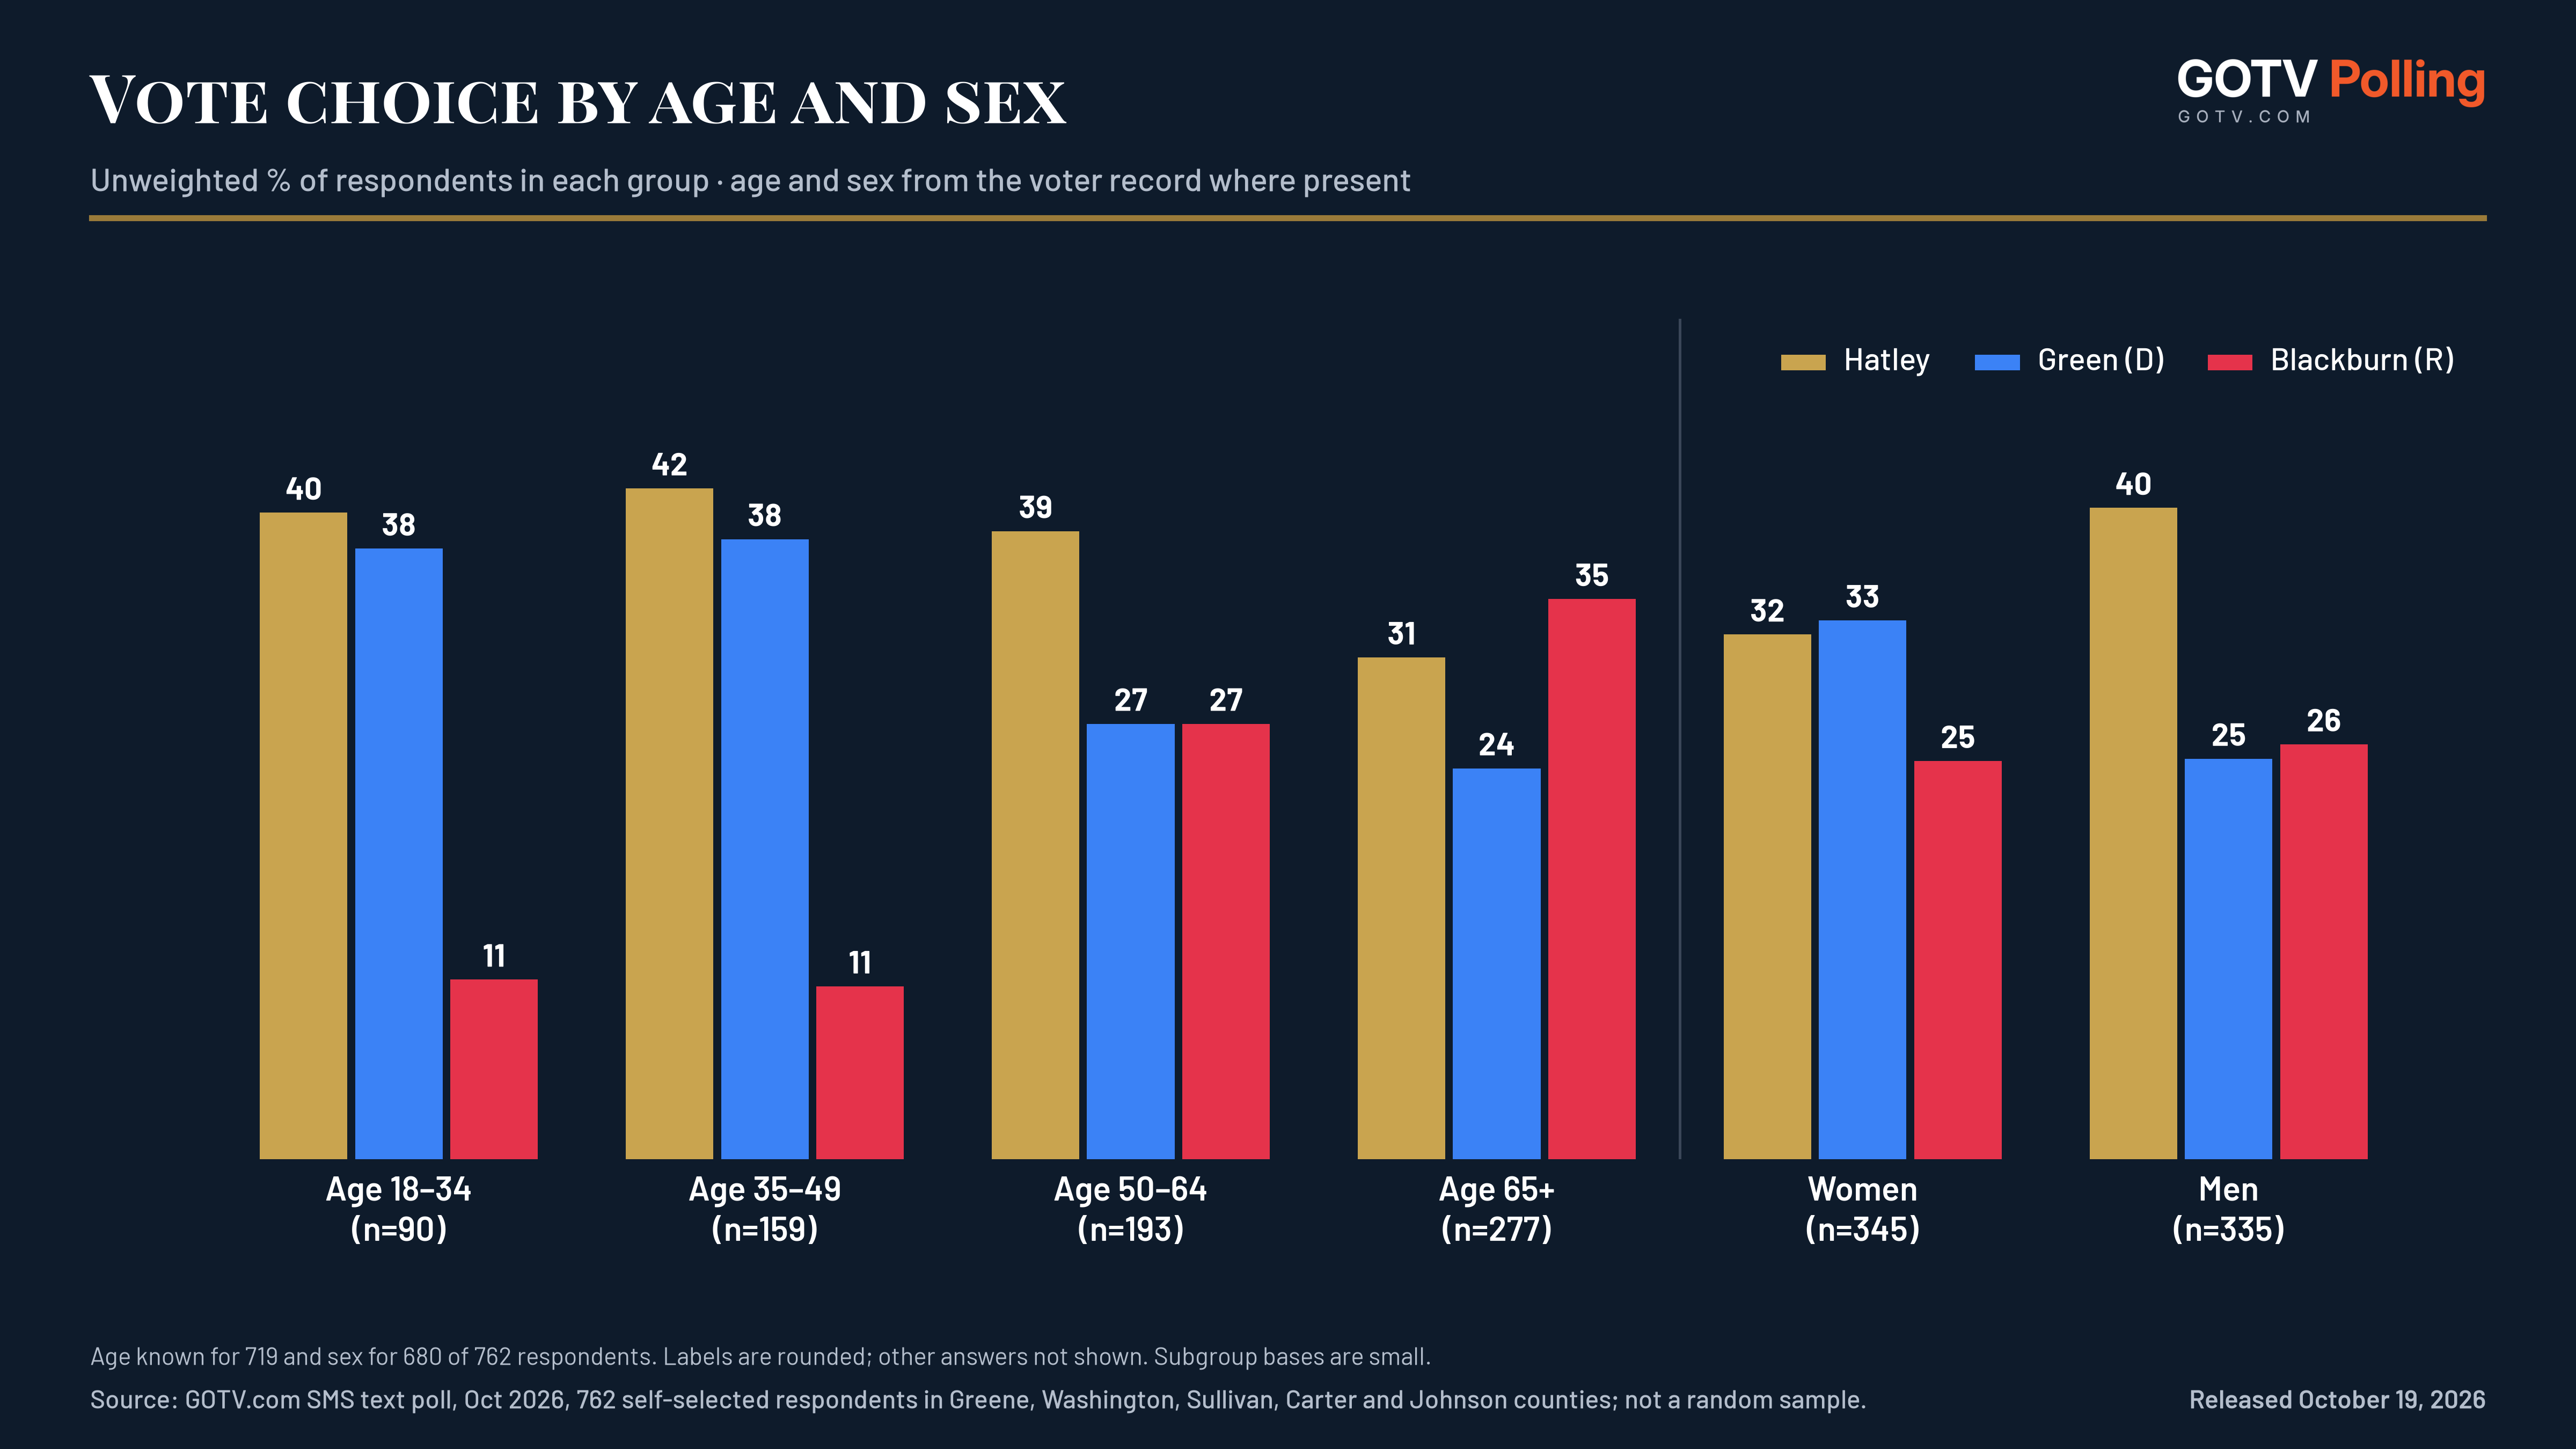
By sex (where the voter record includes sex): women 32.5% Hatley / 33.3% Green / 24.6% Blackburn (n=345); men 40.3% / 24.8% / 25.7% (n=335).
By age (where known), Hatley: 18–34 40.0% (n=90), 35–49 41.5% (n=159), 50–64 38.9% (n=193), 65+ 31.0% (n=277).
Voters 18–34 are 12.5% of respondents with a known age against a 19.8% weighting target (Tennessee voter age target; no county-level age targets), so younger voters remain under-represented.
“So here’s our ask: bring your friends and family to the polls,” the campaign said. “Your vote MATTERS, and change is possible. The DC elite is scared, and they’re telling you it doesn’t matter. IT DOES.”
“Hatley for Governor runs on the oldest play in Tennessee politics: find the people who believe in you, one at a time, and make sure every one of them votes,” the campaign said. “Our list is growing by the hour.”
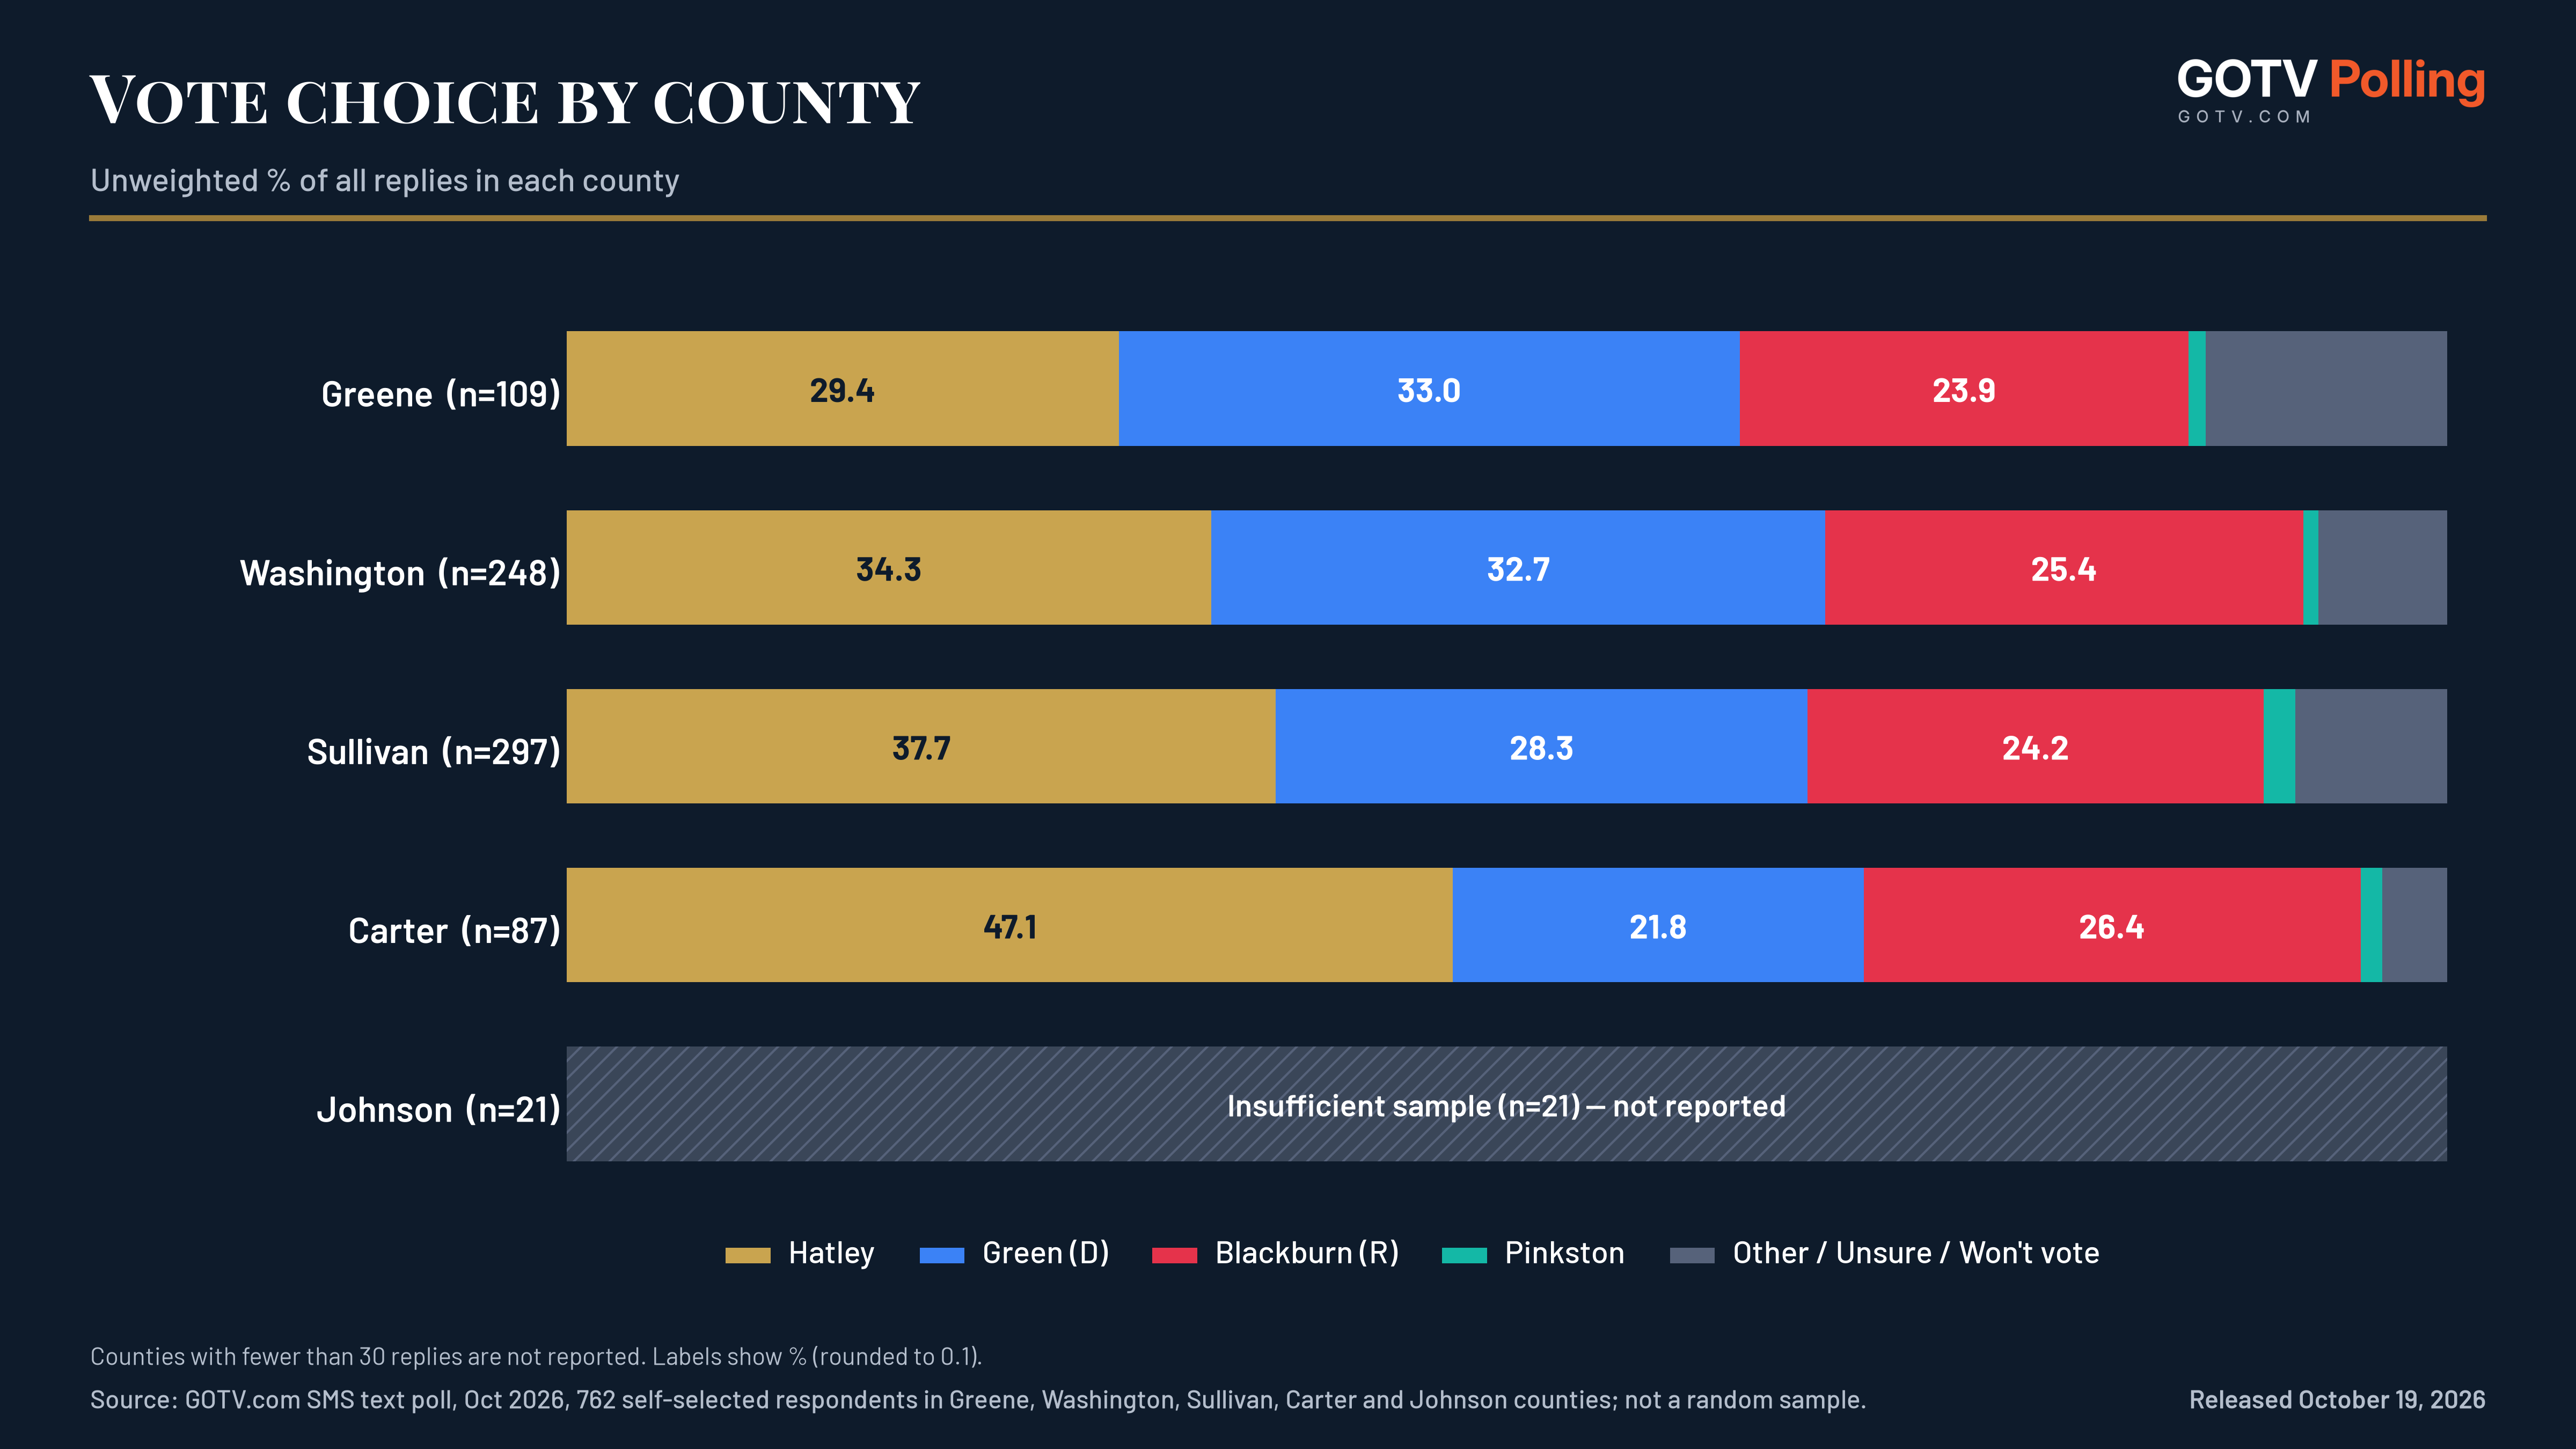
Results by county
| County | Respondents | Hatley | Green | Blackburn | Leader |
|---|---|---|---|---|---|
| Sullivan | 297 | 37.7% | 28.3% | 24.2% | Hatley |
| Washington | 248 | 34.3% | 32.7% | 25.4% | Hatley |
| Greene | 109 | 29.4% | 33.0% | 23.9% | Green |
| Carter | 87 | 47.1% | 21.8% | 26.4% | Hatley |
| Johnson | 21 | Insufficient sample (21 replies; fewer than 30) | — | ||
| Total (5 counties) | 762 | 36.4% | 29.5% | 24.9% | |
Percentages blank where county n < 30; leader suppressed where three-candidate replies < 10. Gap shown only where Blackburn+Green replies ≥ 30. Counts are raw replies, not estimates of county vote.
Charts
Maps
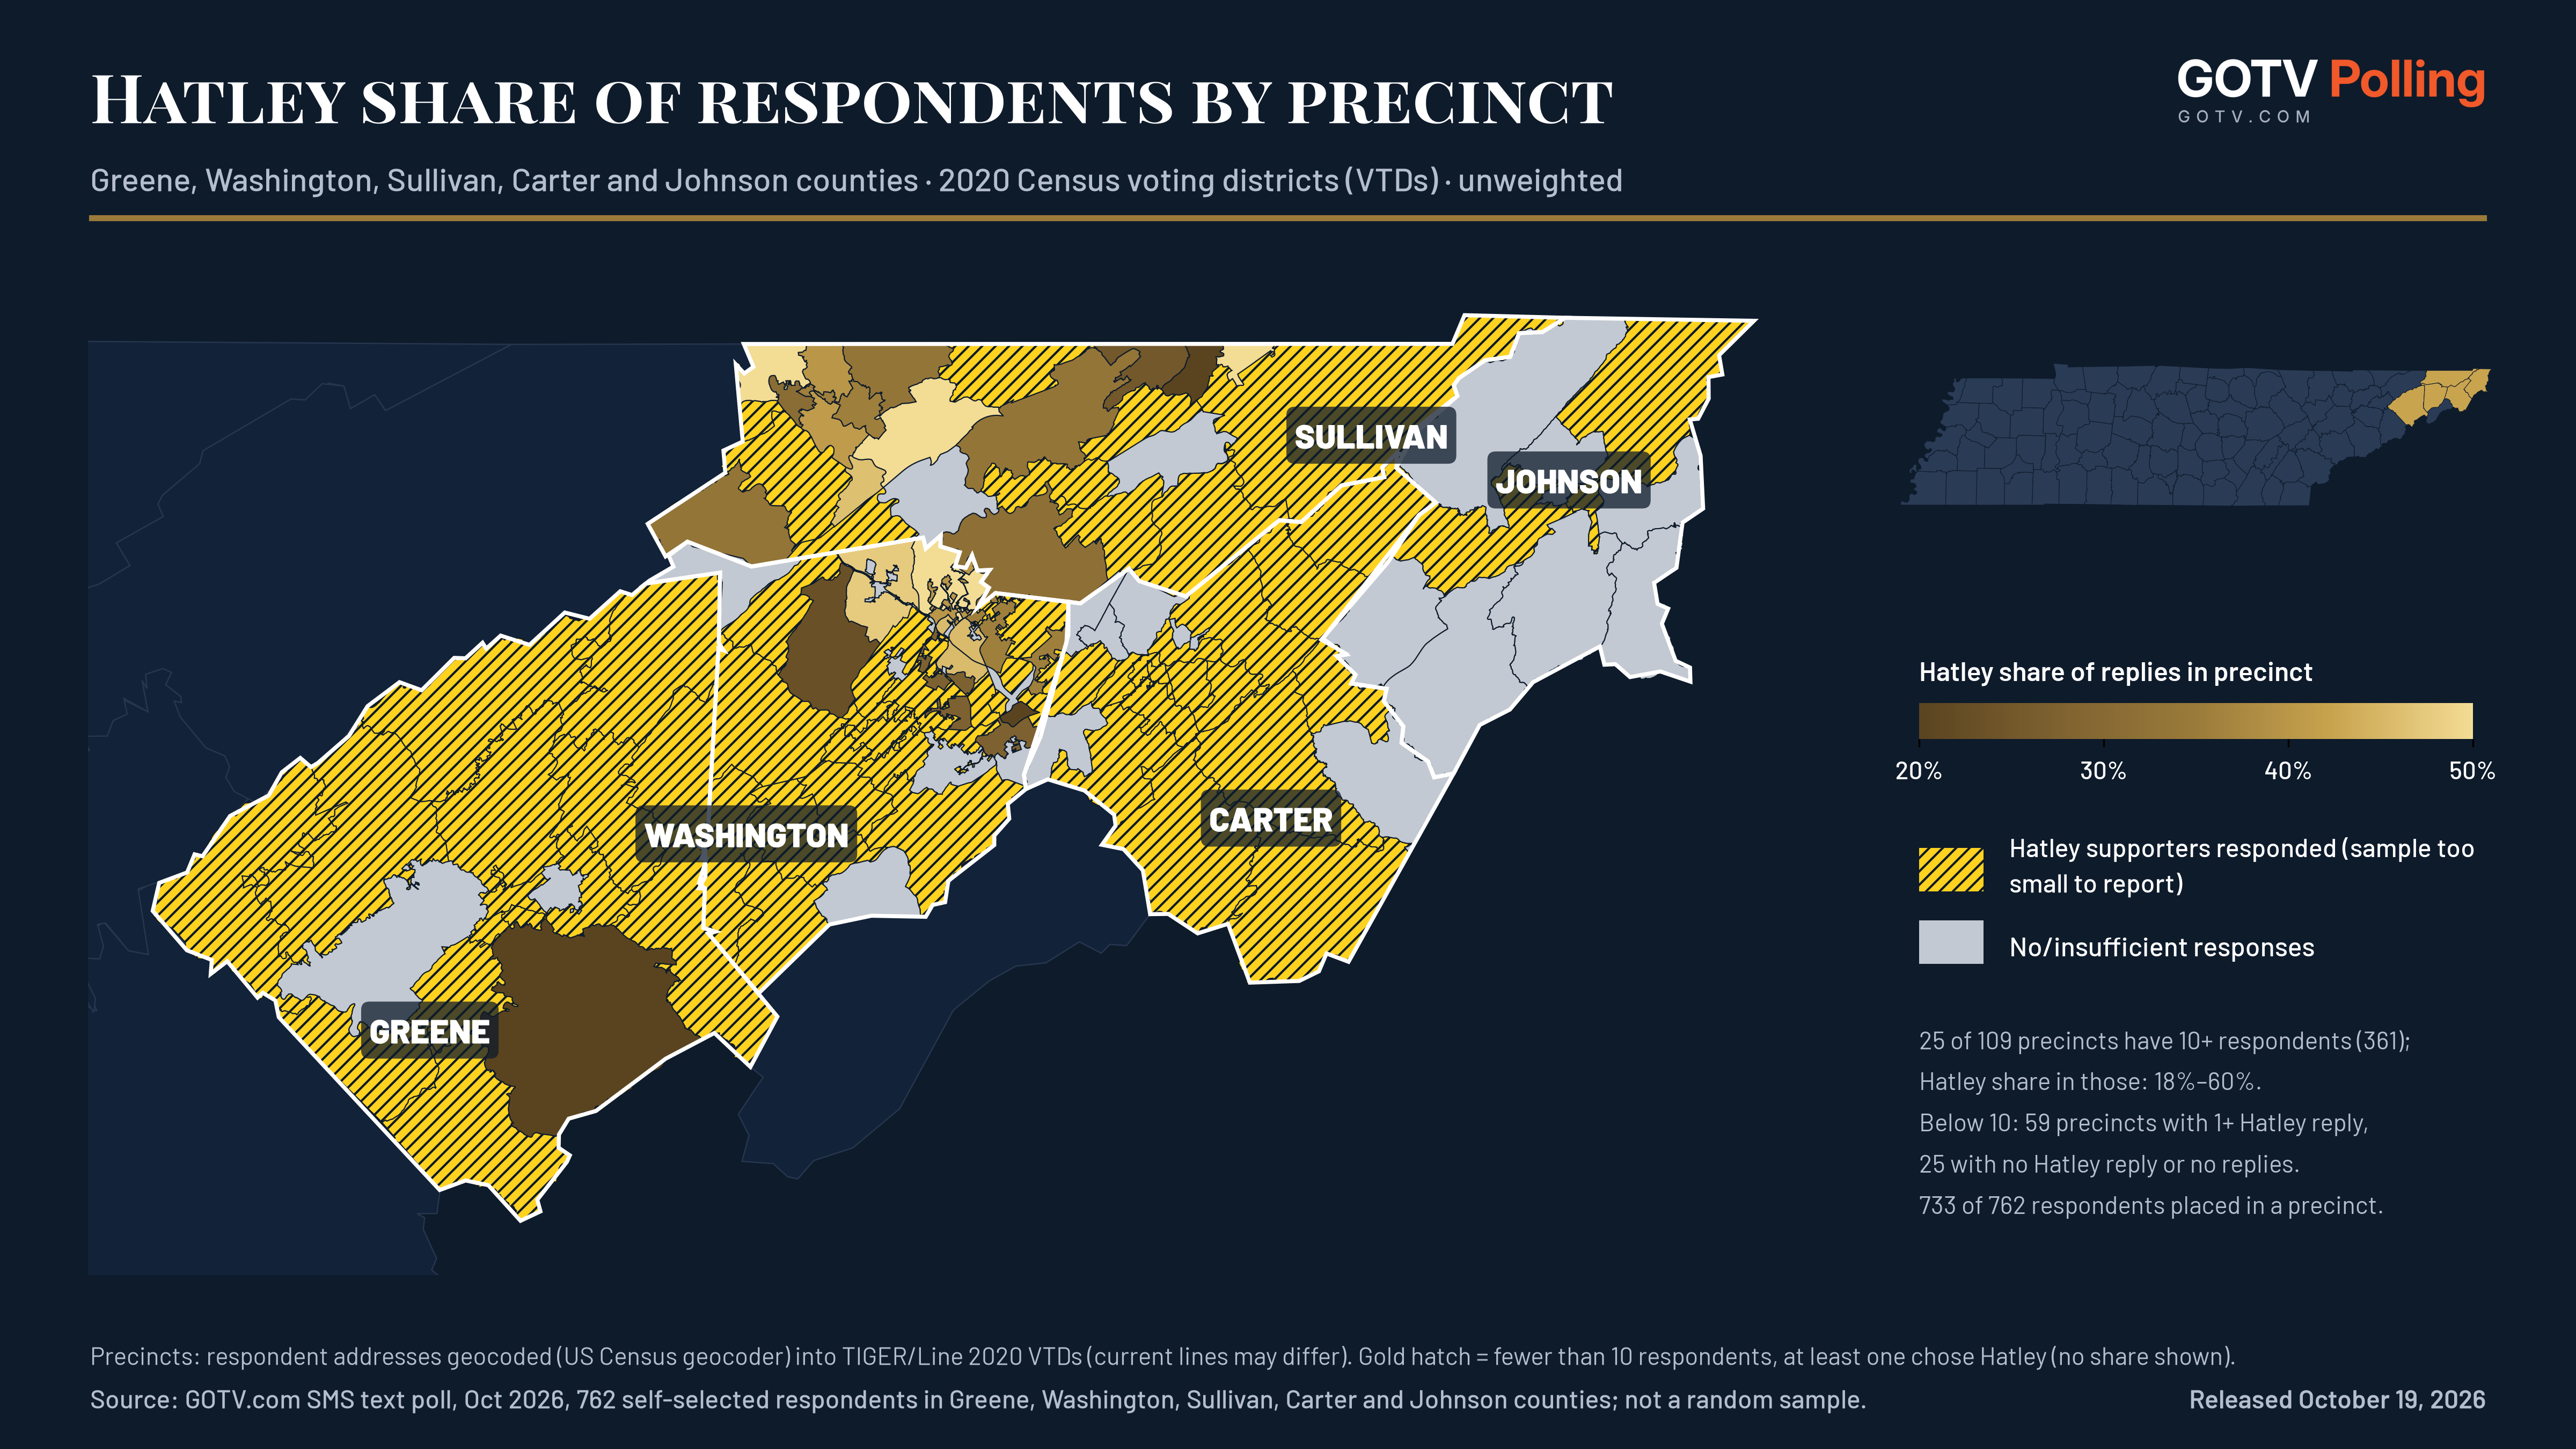
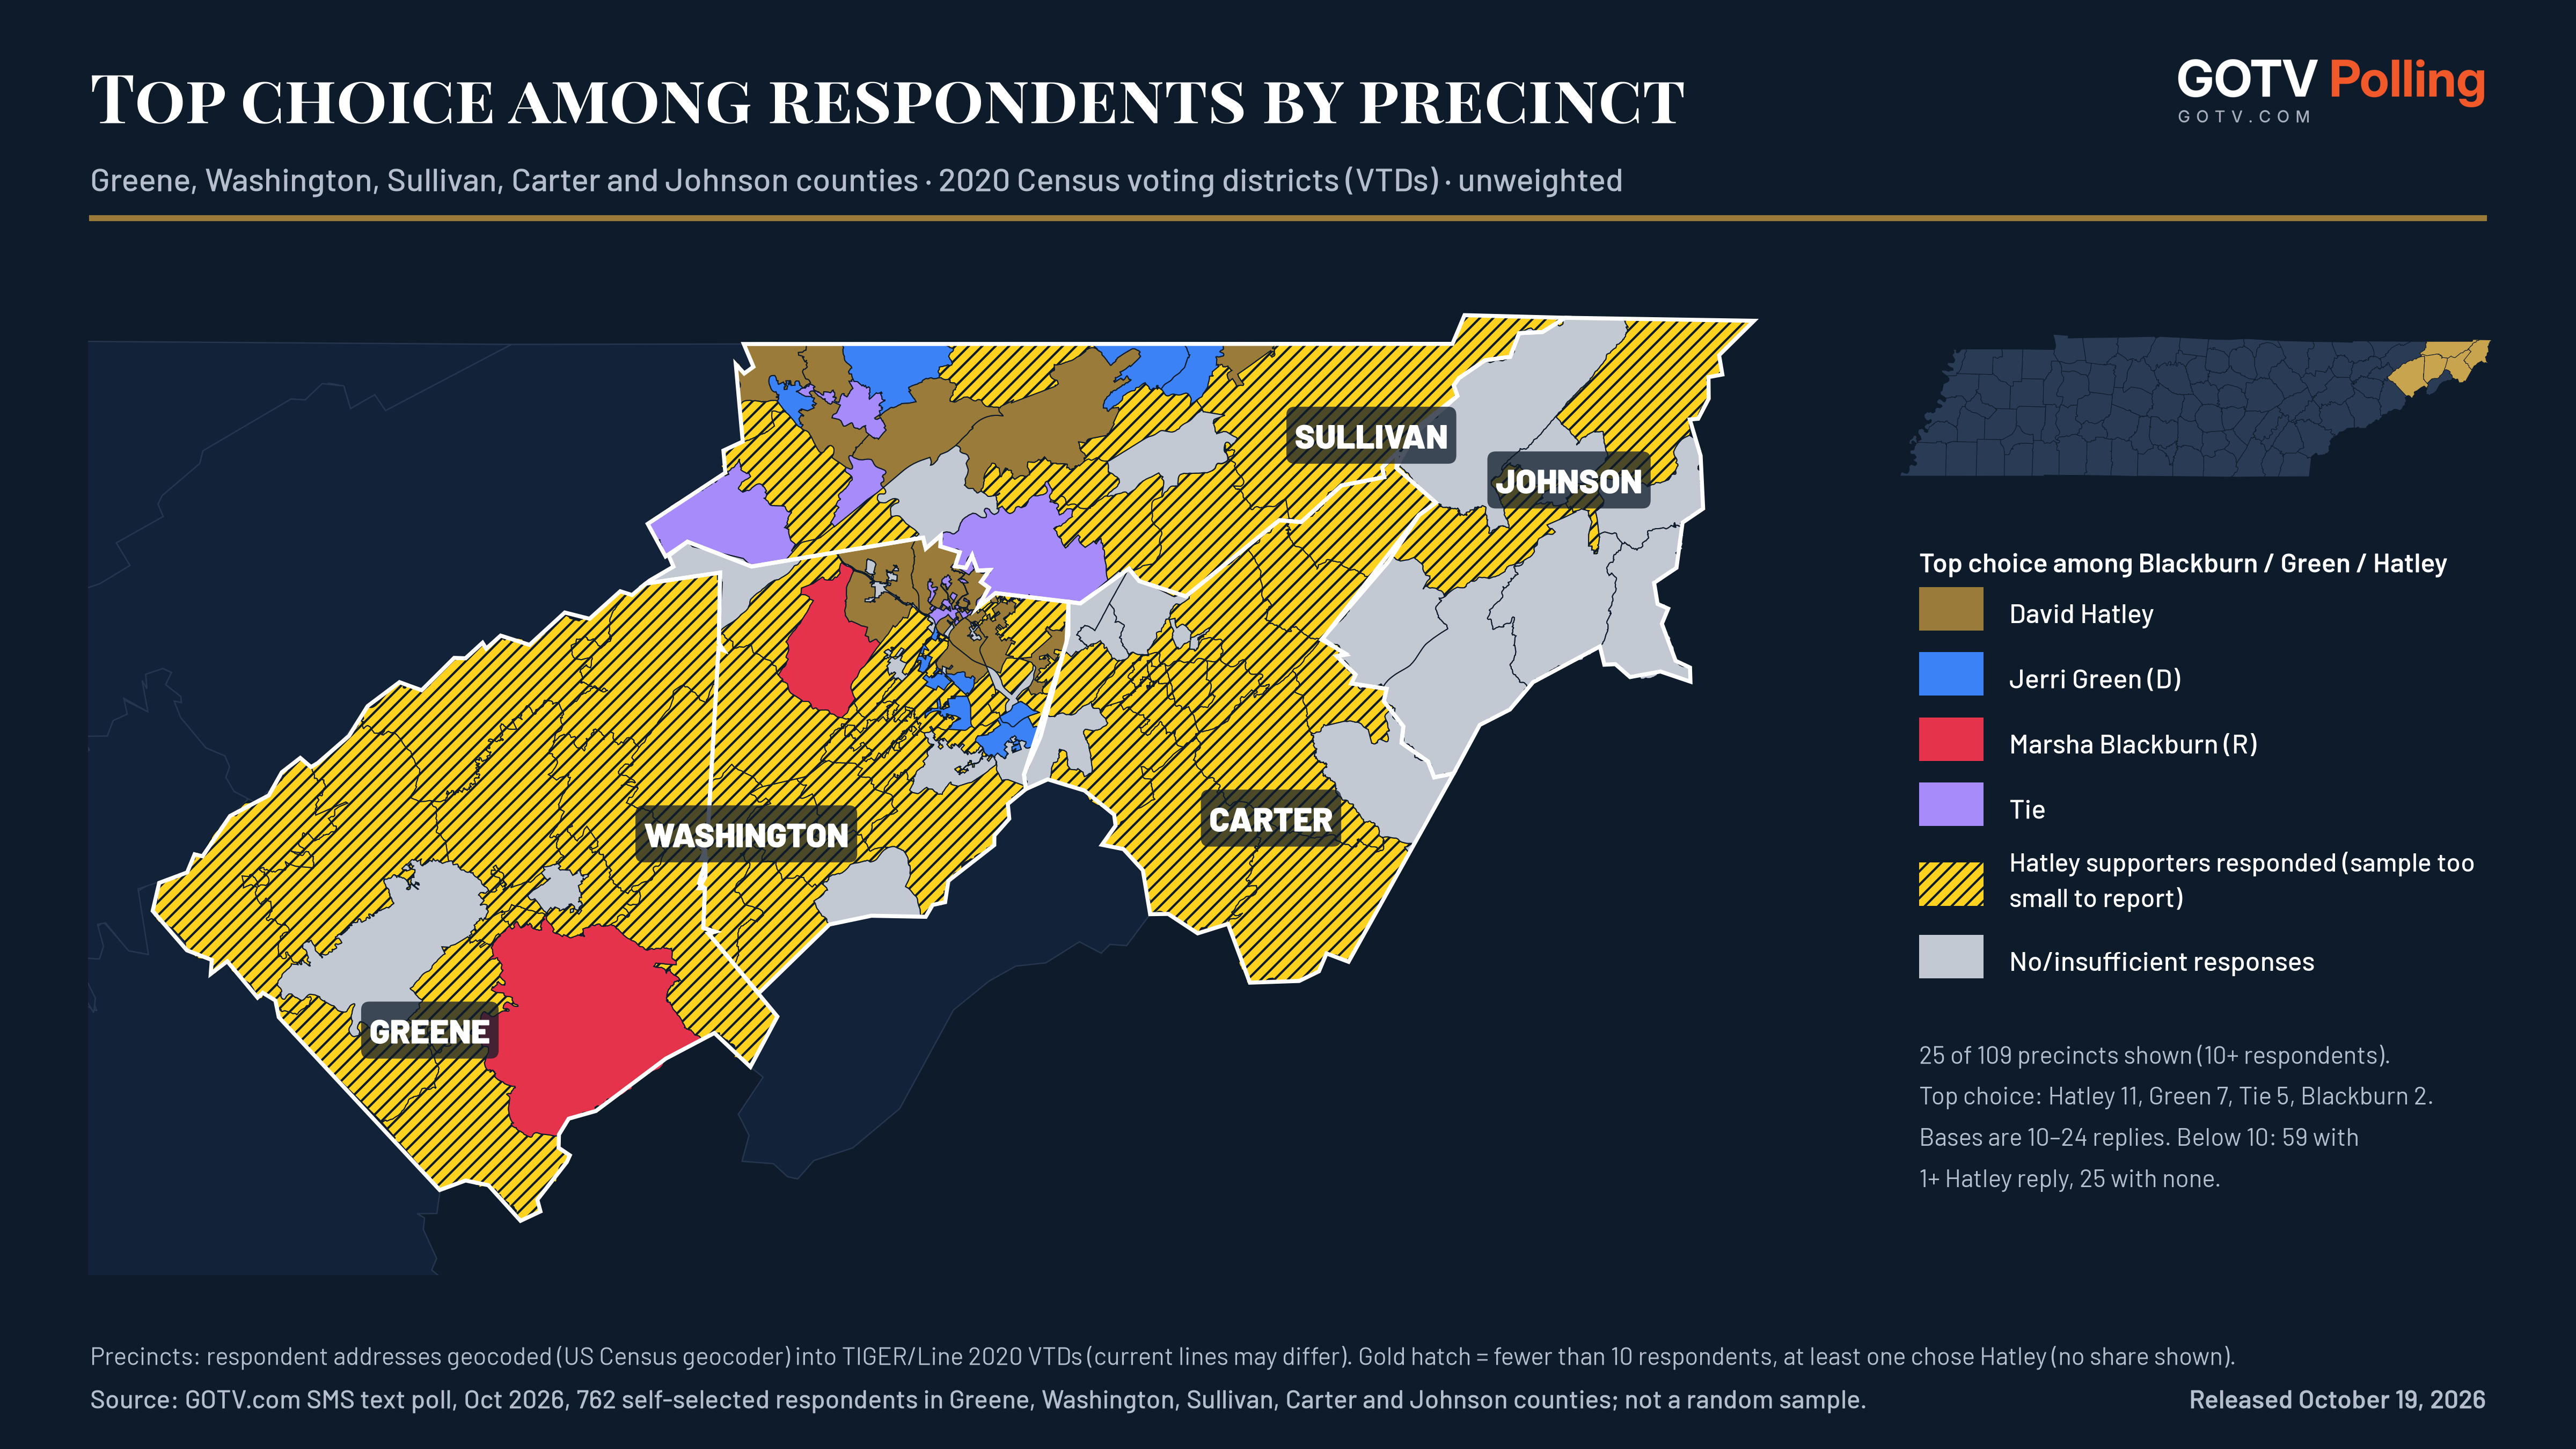
Crosstabs
Q1 For whom do you plan to vote for Governor in November? — UNWEIGHTED
Base: classified SMS respondents (one per phone). Unweighted.
| Total | County | Age | Sex | County tier | County 2024 Trump share | |||||||||||
|---|---|---|---|---|---|---|---|---|---|---|---|---|---|---|---|---|
| Total | Greene | Washington | Sullivan | Carter | Johnson | 18-34 | 35-49 | 50-64 | 65+ | Female | Male | Mid-size (6-15) | Smaller/rural (16-95) | Trump 65-75% | Trump 75%+ | |
| Unweighted Base | 762 | 109 | 248 | 297 | 87 | 21 | 90 | 159 | 193 | 277 | 345 | 335 | 545 | 217 | 248 | 514 |
| Weighted Base | 762 | 109 | 248 | 297 | 87 | 21 | 90 | 159 | 193 | 277 | 345 | 335 | 545 | 217 | 248 | 514 |
| Marsha Blackburn (R) | 190 | 26 | 63 | 72 | 23 | * | 10 | 17 | 52 | 96 | 85 | 86 | 135 | 55 | 63 | 127 |
| col % | 24.9% | 23.9% | 25.4% | 24.2% | 26.4% | * | 11.1% | 10.7% | 26.9% | 34.7% | 24.6% | 25.7% | 24.8% | 25.3% | 25.4% | 24.7% |
| David Hatley | 277 | 32 | 85 | 112 | 41 | * | 36 | 66 | 75 | 86 | 112 | 135 | 197 | 80 | 85 | 192 |
| col % | 36.4% | 29.4% | 34.3% | 37.7% | 47.1% | * | 40.0% | 41.5% | 38.9% | 31.0% | 32.5% | 40.3% | 36.1% | 36.9% | 34.3% | 37.4% |
| Jerri Green (D) | 225 | 36 | 81 | 84 | 19 | * | 34 | 61 | 52 | 67 | 115 | 83 | 165 | 60 | 81 | 144 |
| col % | 29.5% | 33.0% | 32.7% | 28.3% | 21.8% | * | 37.8% | 38.4% | 26.9% | 24.2% | 33.3% | 24.8% | 30.3% | 27.6% | 32.7% | 28.0% |
| Lauren Pinkston | 9 | 1 | 2 | 5 | 1 | * | 3 | 2 | 1 | 2 | 3 | 4 | 7 | 2 | 2 | 7 |
| col % | 1.2% | 0.9% | 0.8% | 1.7% | 1.1% | * | 3.3% | 1.3% | 0.5% | 0.7% | 0.9% | 1.2% | 1.3% | 0.9% | 0.8% | 1.4% |
| Other | 6 | 0 | 3 | 3 | 0 | * | 1 | 0 | 2 | 3 | 3 | 3 | 6 | 0 | 3 | 3 |
| col % | 0.8% | 0.0% | 1.2% | 1.0% | 0.0% | * | 1.1% | 0.0% | 1.0% | 1.1% | 0.9% | 0.9% | 1.1% | 0.0% | 1.2% | 0.6% |
| Unsure | 35 | 9 | 9 | 14 | 1 | * | 2 | 4 | 8 | 19 | 18 | 14 | 23 | 12 | 9 | 26 |
| col % | 4.6% | 8.3% | 3.6% | 4.7% | 1.1% | * | 2.2% | 2.5% | 4.1% | 6.9% | 5.2% | 4.2% | 4.2% | 5.5% | 3.6% | 5.1% |
| Won't vote | 20 | 5 | 5 | 7 | 2 | * | 4 | 9 | 3 | 4 | 9 | 10 | 12 | 8 | 5 | 15 |
| col % | 2.6% | 4.6% | 2.0% | 2.4% | 2.3% | * | 4.4% | 5.7% | 1.6% | 1.4% | 2.6% | 3.0% | 2.2% | 3.7% | 2.0% | 2.9% |
| NET: any named candidate (1–4) | 701 | 95 | 231 | 273 | 84 | * | 83 | 146 | 180 | 251 | 315 | 308 | 504 | 197 | 231 | 470 |
| col % | 92.0% | 87.2% | 93.1% | 91.9% | 96.6% | * | 92.2% | 91.8% | 93.3% | 90.6% | 91.3% | 91.9% | 92.5% | 90.8% | 93.1% | 91.4% |
| Sigma | 100% | 100% | 100% | 100% | 100% | * | 100% | 100% | 100% | 100% | 100% | 100% | 100% | 100% | 100% | 100% |
Q1 For whom do you plan to vote for Governor in November? — WEIGHTED TO COUNTY/AGE/SEX ONLY
Base: all classified respondents. Raked to county (all), age and sex (where known). NOT weighted to party, race, education or 2024 vote.
| Total | County | Age | Sex | County tier | County 2024 Trump share | |||||||||||
|---|---|---|---|---|---|---|---|---|---|---|---|---|---|---|---|---|
| Total | Greene | Washington | Sullivan | Carter | Johnson | 18-34 | 35-49 | 50-64 | 65+ | Female | Male | Mid-size (6-15) | Smaller/rural (16-95) | Trump 65-75% | Trump 75%+ | |
| Unweighted Base | 762 | 109 | 248 | 297 | 87 | 21 | 90 | 159 | 193 | 277 | 345 | 335 | 545 | 217 | 248 | 514 |
| Weighted Base | 762 | 116.2 | 233.2 | 284.4 | 95.5 | 32.7 | 142.4 | 161.9 | 198.3 | 214.9 | 342.8 | 310.1 | 517.6 | 244.4 | 233.2 | 528.8 |
| Marsha Blackburn (R) | 174.4 | 25.6 | 53.3 | 63.7 | 23.5 | * | 13.4 | 16.9 | 53.9 | 74.5 | 77.7 | 74.6 | 117 | 57.4 | 53.3 | 121.2 |
| col % | 22.9% | 22.0% | 22.8% | 22.4% | 24.6% | * | 9.4% | 10.5% | 27.2% | 34.7% | 22.7% | 24.1% | 22.6% | 23.5% | 22.8% | 22.9% |
| David Hatley | 277.7 | 35.3 | 79.7 | 105.2 | 46.2 | * | 53 | 67.1 | 76.2 | 66.8 | 109.3 | 127.1 | 184.8 | 92.9 | 79.7 | 198.1 |
| col % | 36.4% | 30.4% | 34.2% | 37.0% | 48.4% | * | 37.2% | 41.4% | 38.4% | 31.1% | 31.9% | 41.0% | 35.7% | 38.0% | 34.2% | 37.5% |
| Jerri Green (D) | 241.2 | 39.7 | 83.8 | 88.2 | 20.7 | * | 62.7 | 62.1 | 53.4 | 52.1 | 123.1 | 80.7 | 172 | 69.2 | 83.8 | 157.4 |
| col % | 31.6% | 34.1% | 35.9% | 31.0% | 21.7% | * | 44.1% | 38.3% | 27.0% | 24.3% | 35.9% | 26.0% | 33.2% | 28.3% | 35.9% | 29.8% |
| Lauren Pinkston | 9.5 | 1.3 | 1.6 | 4.9 | 1.7 | * | 4.2 | 2 | 0.9 | 1.5 | 3 | 3.8 | 6.6 | 3 | 1.6 | 7.9 |
| col % | 1.3% | 1.1% | 0.7% | 1.7% | 1.8% | * | 2.9% | 1.2% | 0.5% | 0.7% | 0.9% | 1.2% | 1.3% | 1.2% | 0.7% | 1.5% |
| Other | 5.4 | 0 | 2.9 | 2.5 | 0 | * | 1.2 | 0 | 2 | 2.1 | 3.2 | 2.1 | 5.4 | 0 | 2.9 | 2.5 |
| col % | 0.7% | 0.0% | 1.2% | 0.9% | 0.0% | * | 0.8% | 0.0% | 1.0% | 1.0% | 0.9% | 0.7% | 1.0% | 0.0% | 1.2% | 0.5% |
| Unsure | 32.8 | 9.4 | 7.1 | 12.4 | 1.2 | * | 2.8 | 4 | 8.7 | 14.8 | 17.1 | 11.5 | 19.5 | 13.2 | 7.1 | 25.6 |
| col % | 4.3% | 8.1% | 3.1% | 4.3% | 1.2% | * | 2.0% | 2.5% | 4.4% | 6.9% | 5.0% | 3.7% | 3.8% | 5.4% | 3.1% | 4.8% |
| Won't vote | 21 | 4.9 | 4.8 | 7.6 | 2.2 | * | 5 | 9.8 | 3.1 | 3.1 | 9.3 | 10.3 | 12.4 | 8.6 | 4.8 | 16.2 |
| col % | 2.8% | 4.2% | 2.1% | 2.7% | 2.3% | * | 3.5% | 6.1% | 1.6% | 1.5% | 2.7% | 3.3% | 2.4% | 3.5% | 2.1% | 3.1% |
| NET: any named candidate (1–4) | 702.8 | 101.9 | 218.3 | 262 | 92.1 | * | 133.4 | 148.1 | 184.5 | 194.9 | 313.2 | 286.3 | 480.3 | 222.5 | 218.3 | 484.5 |
| col % | 92.2% | 87.7% | 93.6% | 92.1% | 96.4% | * | 93.7% | 91.4% | 93.0% | 90.7% | 91.4% | 92.3% | 92.8% | 91.0% | 93.6% | 91.6% |
| Sigma | 100% | 100% | 100% | 100% | 100% | * | 100% | 100% | 100% | 100% | 100% | 100% | 100% | 100% | 100% | 100% |
* = unweighted n < 50 (suppressed). Shaded = low base (n 50–99). Column letters are labels only; no significance testing.
Methodology
“For whom do you plan to vote for Governor in November?”
- Marsha Blackburn for Governor (R)
- David Hatley for Governor
- Jerri Green for Governor (D)
- Lauren Pinkston for Governor
- Other
- Unsure
- Won't vote
Single question, sent by text; options in fixed order, not rotated.
This text-message poll was conducted October 17, 2026 (texts sent 9:30 AM–4:26 PM PT / 11:30 AM–6:26 PM CT, for texts to these five counties) by GOTV Polling (FullPAC, Inc., GOTV.com). Text-message invitations were sent to voter-file phone lists in multiple sends on the same day. A single question ("For whom do you plan to vote for Governor in November?", with seven numbered options in fixed order) was sent; in Greene, Washington, Sullivan, Carter and Johnson counties it went to 30,158 phone numbers on voter-file records, of which the platform logged 28,553 as delivered. 1,815 of those phones replied, and 762 gave a reply that could be classified as one of the seven options, a response rate of 2.7% of phones logged as delivered on October 17. Each phone is counted once, using its earliest classifiable reply. County is the county on the texted voter record (inferred from ZIP and city for 39 respondents whose list lacked a county field). Respondents chose whether to answer, so this is a self-selected, non-probability sample. Results are shown unweighted and weighted to county, age and sex only. Party, race, education and 2024 vote were not collected and are not weighted. Margin of error: ±3.6 percentage points (n=762, 95% confidence). Full disclosure: Methodology and Disclosure Statement gotvpolling.com/polls/hatley-northeast-tn-2026-10-19/TN_Gov_SMS_Poll_Methodology_Disclosure_5County_FINAL.pdf.
AI disclosure: GOTV AI uses proprietary first-party data, along with agents and systems powered by SpaceX AI, Anthropic, and OpenAI.
Margin of error: ±3.6 percentage points (n=762, 95% confidence).
| Geography | Northeast TN: Greene, Washington, Sullivan, Carter, Johnson counties (county on the texted voter record) |
|---|---|
| Field dates | October 17, 2026 · text invitations sent to voter-file phone lists in multiple sends the same day |
| N | 762 classified respondents (earliest classifiable reply per phone). County n: Sullivan 297, Washington 248, Greene 109, Carter 87, Johnson 21. |
| Mode | Single-question SMS text poll (reply 1–7), one outbound message; no web survey, no IVR, no screener |
| Frame | Phone-matched voter-file records supplied to the SMS platform (file source to be confirmed); not a probability sample |
| Weighting | Primary UNWEIGHTED. Alternate: respondent-level raking to county (all; targets renormalised within the five counties), age (Tennessee voter targets) and sex (national assumption) where known. No county-level age/sex targets documented. No party/race/education/2024-vote weighting (not in data). |
| DEFF / effective n | 1.13 / 675; weights 0.70–4.30, untrimmed |
| Precision | Margin of error: ±3.6 percentage points (n=762, 95% confidence). Basis: 1.96 × √(0.25 ÷ 762), the simple-random-sample formula at p=50% (±3.8 with design effect 1.13). County subsamples ±5.7 to ±21.4 pts. Respondents self-selected; the margin of error covers sampling error only, not selection bias or the documented within-county partisan skew. |
| Known bias | Green 54.2% of Blackburn+Green replies vs Harris 22.9% of 2024 two-party vote in these counties; replies median 29.4 pts more Democratic than 2024 within counties. |
| Texts sent | Oct 17 poll wave: 30,158 texts to 30,158 phones (28,553 SUCCESS); response 2.67% of SUCCESS. Oct 18 supplemental send: 12,265 texts (11,591 SUCCESS); replies not included. Oct 17–18 total 42,423 texts, one per phone. See 'Texts sent (send log)'. |
| Opt-outs | 818 phones in these counties sent opt-out language (rebuilt) vs 762 respondents — compliance review. |
| Sponsor | Hatley for Governor (David Hatley campaign). Paid for by Hatley for Governor, Joe Cronin, Treasurer. |
| Vendor | GOTV Polling (FullPAC, Inc. · GOTV.com); analysis GOTV Intel |
| AI disclosure | GOTV AI uses proprietary first-party data, along with agents and systems powered by SpaceX AI, Anthropic, and OpenAI. |
Texts sent
| County | Oct 17 texts sent (= phones) | Oct 17 SUCCESS | Oct 17 FAIL | Respondents (Oct 17 replies) | Response % of Oct 17 SUCCESS | Oct 18 texts sent (= phones) | Oct 18 SUCCESS | Oct 18 FAIL | Oct 17–18 texts sent | Oct 17–18 SUCCESS |
|---|---|---|---|---|---|---|---|---|---|---|
| Greene | 4,670 | 4,423 | 247 | 109 | 2.5 | 1,865 | 1,759 | 106 | 6,535 | 6,182 |
| Washington | 9,448 | 8,976 | 472 | 248 | 2.8 | 3,977 | 3,776 | 201 | 13,425 | 12,752 |
| Sullivan | 11,243 | 10,640 | 603 | 297 | 2.8 | 4,725 | 4,470 | 255 | 15,968 | 15,110 |
| Carter | 3,447 | 3,259 | 187 | 87 | 2.7 | 1,340 | 1,255 | 85 | 4,787 | 4,514 |
| Johnson | 1,350 | 1,255 | 95 | 21 | 1.7 | 358 | 331 | 27 | 1,708 | 1,586 |
| Total (5 counties) | 30,158 | 28,553 | 1,604 | 762 | 2.7 | 12,265 | 11,591 | 674 | 42,423 | 40,144 |
Source: final send log, Drive folder 'Hatley Send Log - Oct 17 - 18 2026' (final_send_log_all_fields.csv; outbound messages only). 'Texts sent' = outbound texts attempted; each phone was texted once (texts = unique phones; no phone in both sends). SUCCESS/FAIL = platform delivery status, not a confirmed read.
October 17 (the poll wave reported here; three sends, 9:30 AM–4:26 PM PT): county = county on the texted voter record, ZIP/city-inferred where missing (same rule as the respondent counts). Oct 17 totals match the poll's message-log cache exactly; the final log shows 28,552 SUCCESS in these counties (one status changed after the cache).
October 18 (supplemental send, 5:04–5:48 PM PT; export timestamps UTC): its list had no county field, so county = matched voter-file county. Replies to this send are NOT in the 762 respondents, so no response rate is shown for October 18 or for both days combined.
About Hatley for Governor
David Hatley is an independent candidate for Governor of Tennessee and a lifelong Tennessean who has spent thirty years building businesses and creating jobs. Born and raised in Elizabethton in Carter County, Hatley grew up without advantage or inheritance. He started his first business at age twelve and opened his first retail store at eighteen. Over the next three decades, he built nine companies, created 750 Tennessee jobs and grew his manufacturing operations to 740,000 square feet, all on American soil; his flagship company became the number one hot tub manufacturer in the United States, and he never moved a single job overseas. His platform, Elevate Tennessee, is built on four pillars: economic growth through manufacturing, workforce development from the ground up, fiscal responsibility without political theater, and leading with compassion to improve the quality of life for all Tennesseans. He is married to Deborah and is the father of Storm, Hudson, Branson and Channing. Learn more at hatleyforgovernor.com.
Downloads
- Press release (PDF) 182 KB
- Press release (DOCX) 1.5 MB
- Key results deck (PDF) 2.9 MB
- Crosstabs (XLSX) 670 KB
- Crosstabs (PDF) 1.3 MB
- Methodology and disclosure statement (PDF) 305 KB
Paid for by Hatley for Governor