
FOR IMMEDIATE RELEASE · Tuesday, October 27, 2026 · Contact: GOTV Polling, Hector@GOTV.com, 781.518.8534
GOTV Polling: Blackburn continues to drop, while Independent Candidate David Hatley surges at 26.47% in Tennessee Governor's Race, Within Single Digits of the Lead
WEIGHTED TO COUNTY, AGE AND SEX: BLACKBURN 34.54%, GREEN 30.12%, HATLEY 26.47%, PINKSTON 2.96%, UNDECIDED 5.91% (TOTAL 100.00%)
UNWEIGHTED, 1,196 TEXT RESPONDENTS STATEWIDE: BLACKBURN 34.78%, GREEN 29.77%, HATLEY 26.17%, PINKSTON 2.51%, UNDECIDED 6.77% (TOTAL 100.00%)
TENNESSEE / October 27, 2026: Marsha Blackburn leads the Tennessee governor's race at 34.54%, 4.42 points ahead of Jerri Green at 30.12% and 8.07 points ahead of David Hatley, independent candidate for Governor, at 26.47%, according to statewide results released today by GOTV Polling (weighted to county, age and sex). Lauren Pinkston has 2.96% and 5.91% are undecided. Unweighted, the figures are Blackburn 34.78%, Green 29.77%, Hatley 26.17%, Pinkston 2.51% and Undecided 6.77%. 1,196 respondents answered a one-question automated text-message survey conducted October 25 and 26, 2026. Respondents were 49% Republican, 23% Democrat and 28% Non-Partisan.
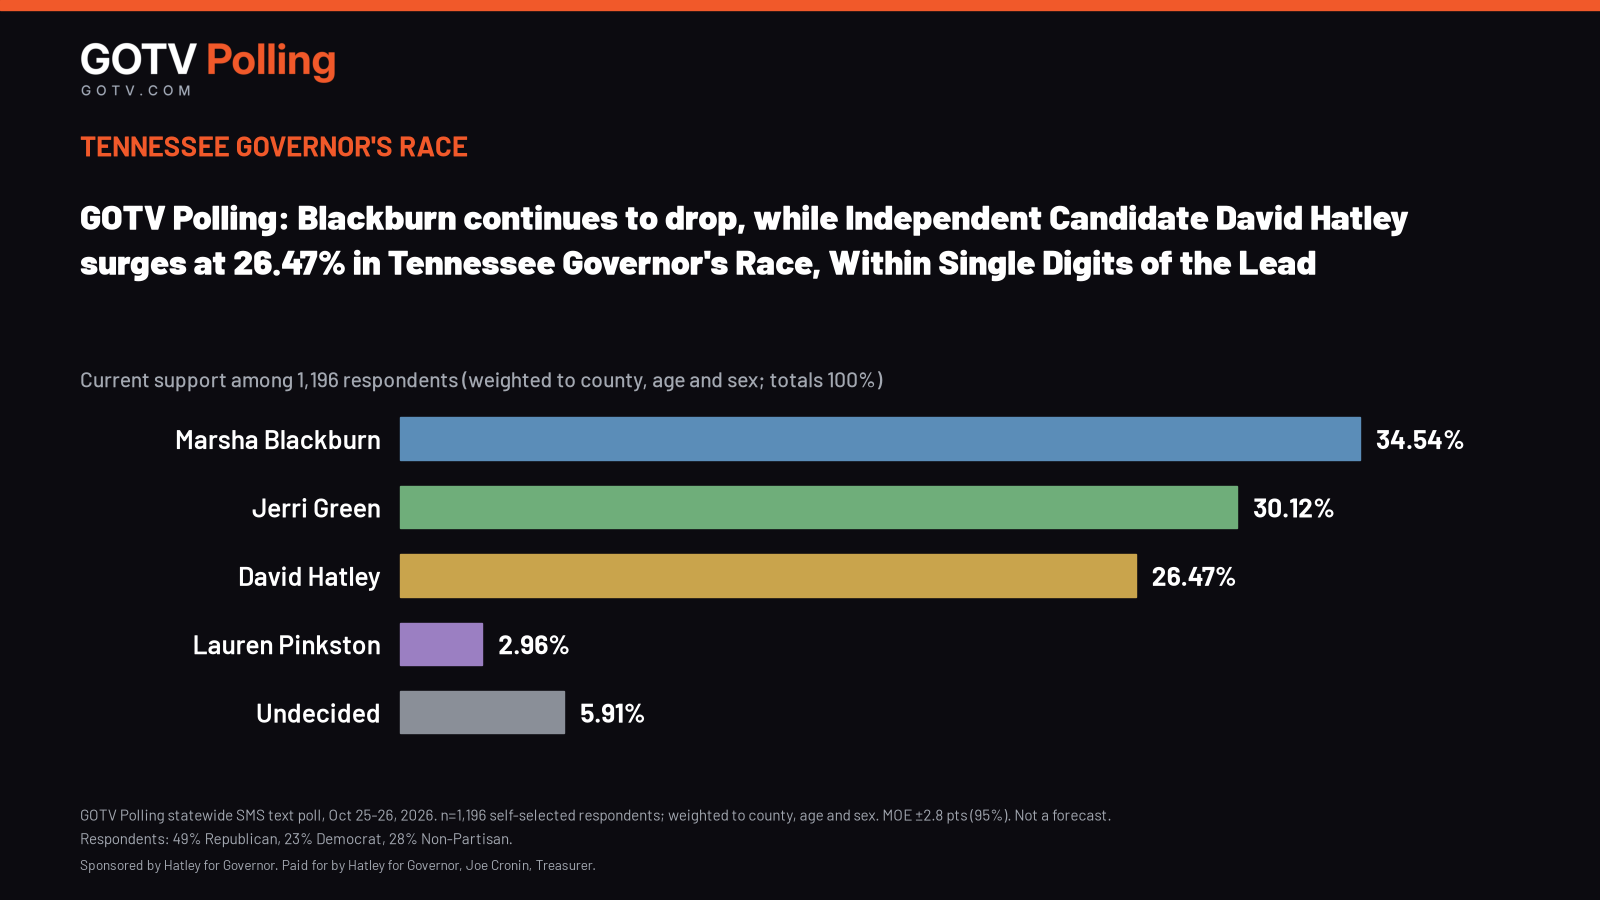
Full results: https://gotvpolling.com/tn-gov-oct-27-2026
CURRENT SUPPORT AMONG RESPONDENTS (TENNESSEE STATEWIDE)
| Candidate | Respondents (n) | Unweighted % | Weighted % (county/age/sex) |
|---|---|---|---|
| Marsha Blackburn | 416 | 34.78 | 34.54 |
| Jerri Green | 356 | 29.77 | 30.12 |
| David Hatley | 313 | 26.17 | 26.47 |
| Lauren Pinkston | 30 | 2.51 | 2.96 |
| Undecided | 81 | 6.77 | 5.91 |
| Total | 1,196 | 100.00 | 100.00 |
Party composition of respondents: 49% Republican, 23% Democrat, 28% Non-Partisan.
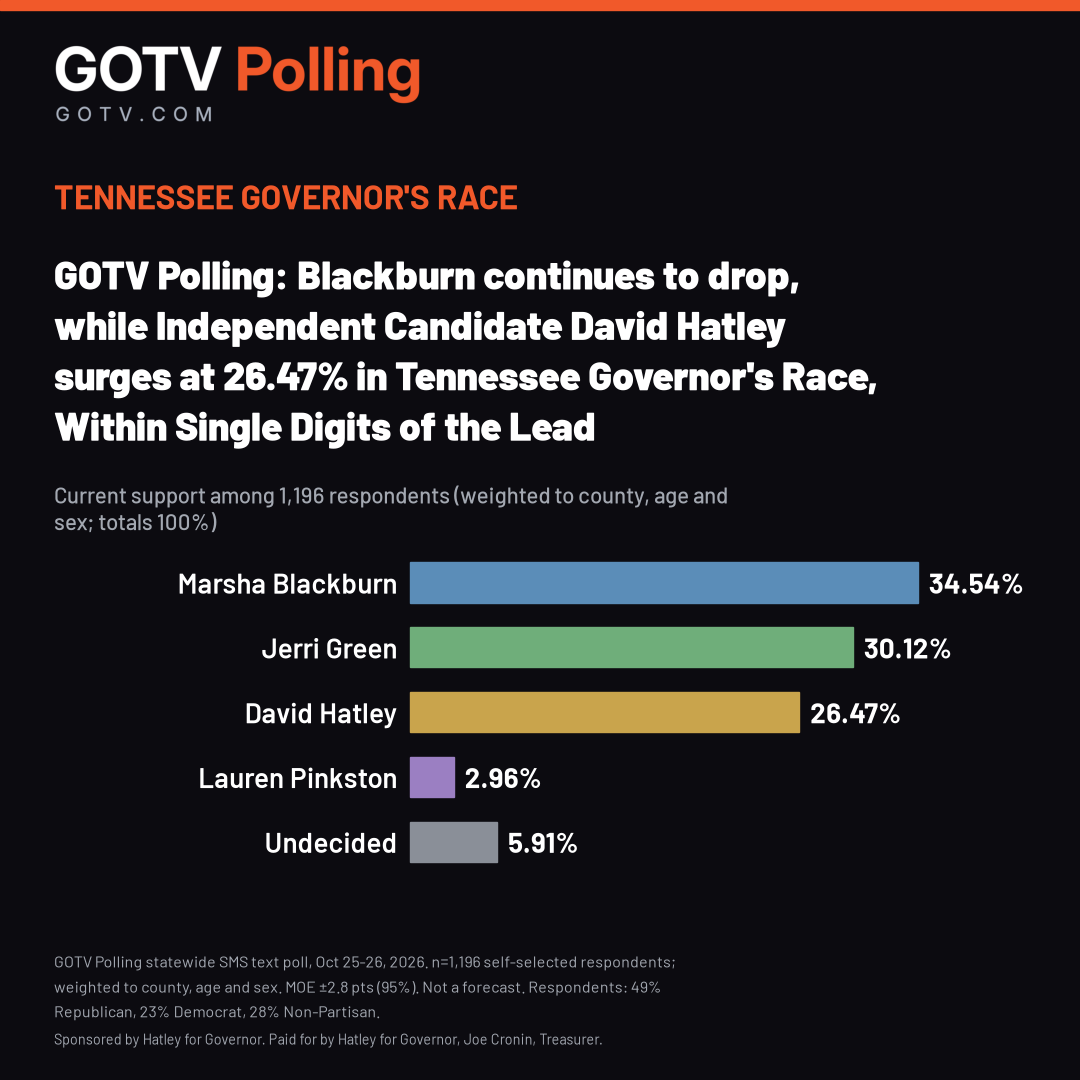
RESULTS BY GROUP (UNWEIGHTED %)
| Group | n | Blackburn | Green | Hatley | Pinkston | Undecided |
|---|---|---|---|---|---|---|
| East | 511 | 33.66 | 29.55 | 28.77 | 1.76 | 6.26 |
| Middle | 489 | 36.19 | 29.65 | 23.93 | 3.07 | 7.16 |
| West | 196 | 34.19 | 30.61 | 25.00 | 3.06 | 7.14 |
| Big-5 metro | 503 | 33.20 | 37.77 | 20.87 | 2.39 | 5.77 |
| Mid-size (6-15) | 337 | 32.94 | 26.41 | 30.27 | 3.26 | 7.12 |
| Smaller/rural (16-95) | 356 | 38.76 | 21.63 | 29.78 | 1.97 | 7.86 |
| Trump <50% | 260 | 31.54 | 38.46 | 21.54 | 2.31 | 6.15 |
| Trump 50-65% | 305 | 35.74 | 35.08 | 20.33 | 2.29 | 6.56 |
| Trump 65-75% | 258 | 34.88 | 26.36 | 27.52 | 2.33 | 8.91 |
| Trump 75%+ | 373 | 36.19 | 21.72 | 33.24 | 2.95 | 5.90 |
| Women | 595 | 32.10 | 31.77 | 25.21 | 3.36 | 7.56 |
| Men | 601 | 37.44 | 27.79 | 27.12 | 1.66 | 5.99 |
| 18-34 | 97 | 20.62 | 42.27 | 25.77 | 8.25 | 3.09 |
| 35-49 | 307 | 23.78 | 40.72 | 23.45 | 4.56 | 7.49 |
| 50-64 | 407 | 33.91 | 26.04 | 30.47 | 1.23 | 8.35 |
| 65+ | 385 | 48.05 | 21.82 | 23.90 | 0.78 | 5.45 |
Full unweighted and weighted results for every group are in the crosstabs released with this announcement.
HOW TO READ THESE RESULTS
These are replies from 1,196 people across Tennessee who chose to answer a one-question text message; they are self-selected and are not a representative probability sample of the Tennessee electorate. Respondents were 49% Republican, 23% Democrat and 28% Non-Partisan. Results are weighted to county, age and sex only; they are not weighted to party or past vote. Weighted results: Blackburn 34.54%, Green 30.12%, Hatley 26.47%, Pinkston 2.96% and Undecided 5.91%. Margin of error: ±2.8 percentage points (n=1,196, 95% confidence; ±3.6 with the weighting design effect). The margin of error reflects sampling error only and does not capture non-sampling error such as self-selection or coverage. The figures describe respondents and are not a prediction of the election.
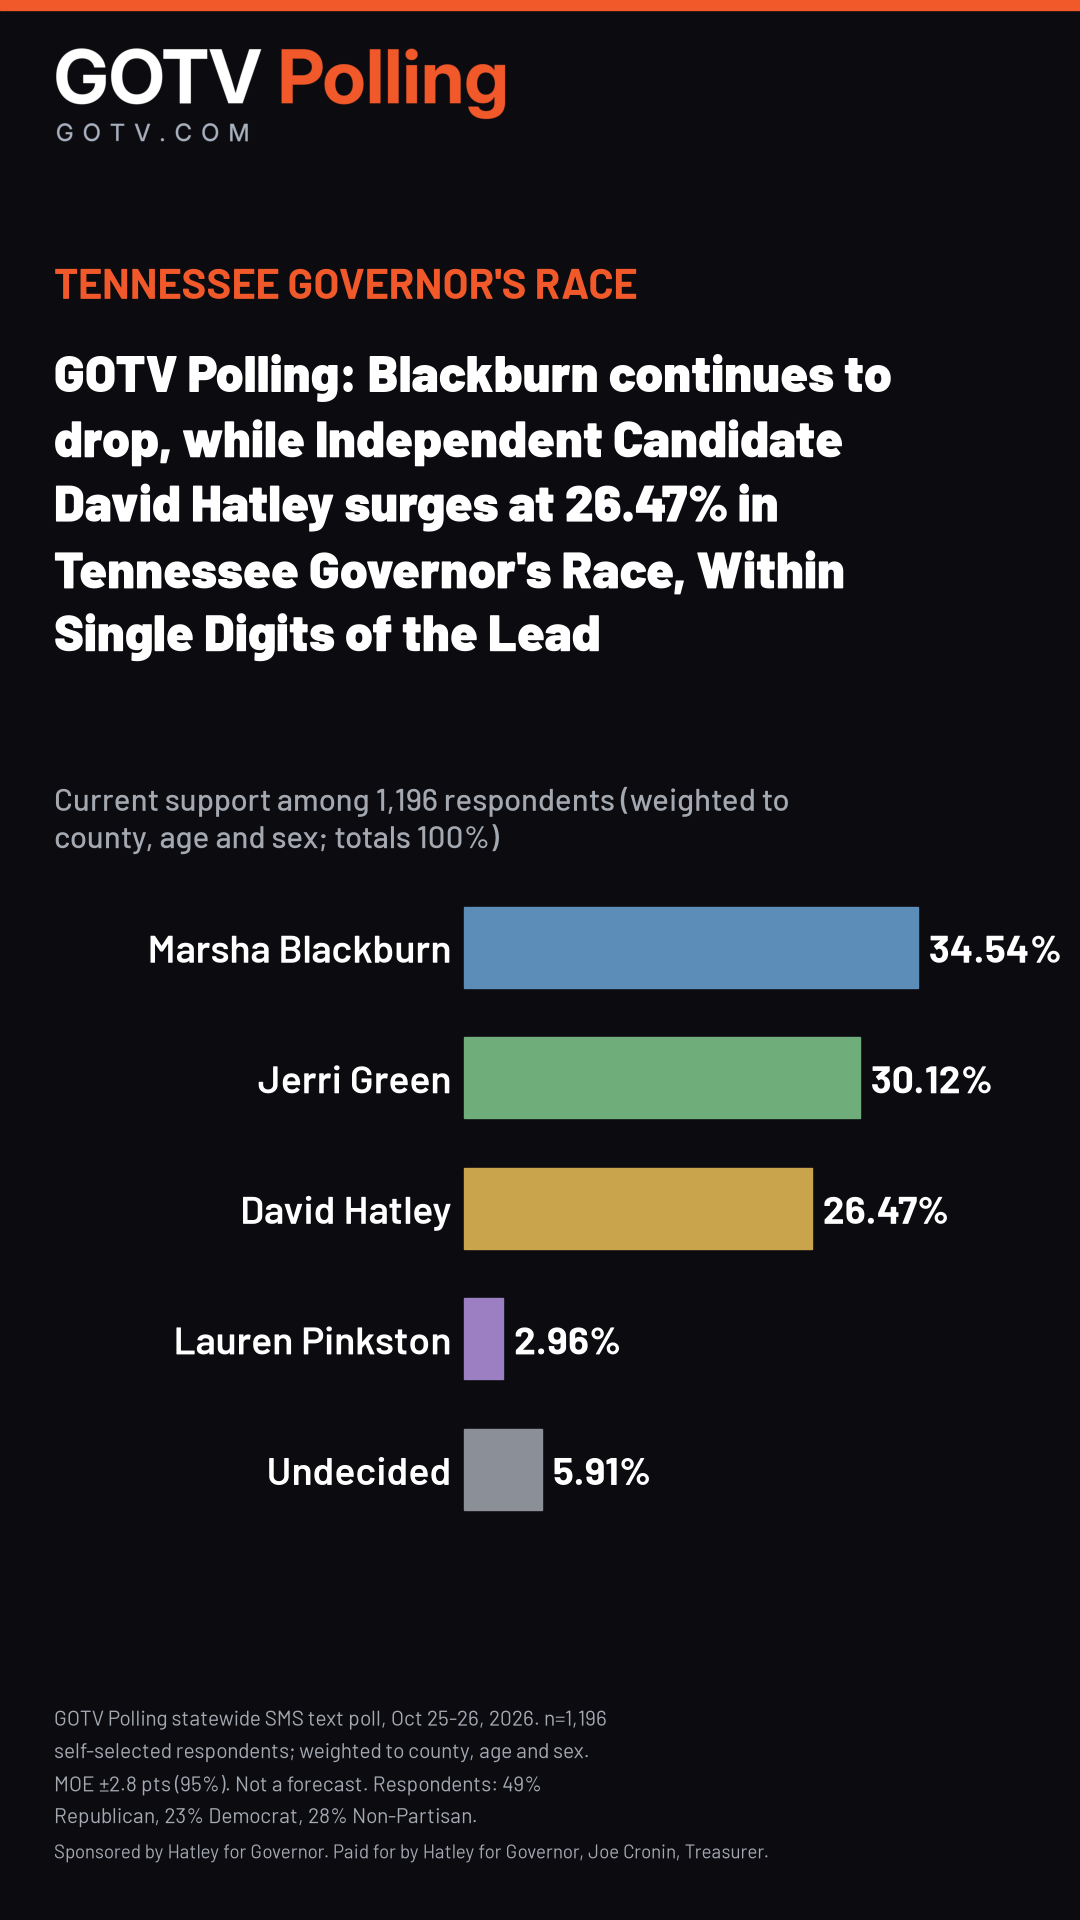
METHODOLOGY
This automated text-message survey of Tennessee registered voters was conducted October 25 and 26, 2026 by GOTV Polling. The sample was expanded on October 26 to include additional registered voters, selected to improve geographic and demographic balance. 1,196 respondents gave a valid answer (one per phone, earliest classifiable reply). Non-probability, self-selected sample; primary results are unweighted, with weighted results raked to county, age and sex only. Margin of error ±2.8 percentage points (95% confidence; ±3.6 with the weighting design effect). Responses are reported in five categories: Blackburn, Green, Hatley, Pinkston and Undecided. Respondents were 49% Republican, 23% Democrat and 28% Non-Partisan. A full methodology and disclosure statement accompanies this release.
ABOUT GOTV POLLING
GOTV Polling (GOTV.com) conducts automated text-message surveys of registered voters and publishes toplines, crosstabs and a full methodology statement with each release.
Released with this announcement: press release, methodology and disclosure statement, crosstabs (XLSX and PDF).
Full results: https://gotvpolling.com/tn-gov-oct-27-2026
Methodology (PDF): https://gotvpolling.com/hatley-poll/files/Hatley_Poll_Methodology_2026-10-25_26.pdf
Crosstabs (XLSX): https://gotvpolling.com/hatley-poll/files/Hatley_Poll_Crosstabs_2026-10-25_26.xlsx
Crosstabs (PDF): https://gotvpolling.com/hatley-poll/files/Hatley_Poll_Crosstabs_2026-10-25_26.pdf
Graphic (PNG): https://gotvpolling.com/hatley-poll/graphics/GOTV_Polling_TN_Governor_Hatley_Poll_X_1600x900.png

###
Sponsored by Hatley for Governor. Paid for by Hatley for Governor, Joe Cronin, Treasurer.