
Alabama's 2nd Congressional District
U.S. House · Alabama · District 2 · General election: Tuesday, November 3, 2026
Candidates on the November 3 ballot
- Rhett MarquesRepublican
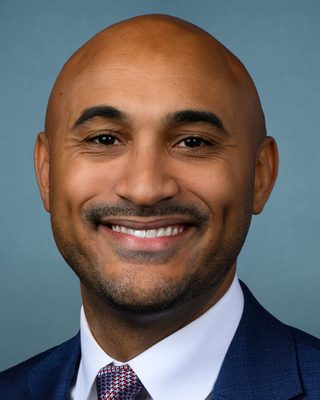 Shomari C. FiguresDemocraticPhoto: U.S. Congress
Source: Alabama Secretary of State, State Certification of Republican, Democratic and Independent Candidates, 2026 General Election, certified list (2026-08-26; retrieved 2026-10-30). The Secretary of State certified no independent candidates for these offices. Order of names does not reflect ballot order. Incumbent tags appear only where the official list marks incumbents. Photos come from the Candidate Alerts database where one is on file; otherwise initials are shown.
Federal campaign finance filings for this seat: FEC election page (FEC registration is not the same as ballot qualification).
Certified candidates
- Shomari Figures DemocraticIncumbent @repscfigures
- Rhett Marques Republican
Certified candidate list from Candidate Alerts, as of 2026-09-24, based on Alabama Secretary of State. Includes candidates the database marks as on the November 3 ballot. Incumbent tags here follow the database.
Past election results
Held under the district lines in effect at the time. Those boundaries differ from the 2026 district.
| Candidate | Party | Votes | Share |
|---|---|---|---|
| Shomari Figures | Democratic | 158,041 | 54.6% |
| Caroleene Dobson | Republican | 131,414 | 45.4% |
| Write-In | NON | 219 | 0.1% |
| Total | 289,674 |
Source: Alabama Secretary of State, official precinct-level results. Status: Official precinct-level results (Alabama Secretary of State)
Held under the district lines in effect at the time. Those boundaries differ from the 2026 district.
| Candidate | Party | Votes | Share |
|---|---|---|---|
| Barry Moore | Republican | 137,460 | 69.1% |
| Phyllis Harvey-Hall | Democratic | 58,014 | 29.2% |
| Jonathan Realz | Libertarian | 3,396 | 1.7% |
| Write-In | NON | 91 | 0.0% |
| Total | 198,961 |
Source: Alabama Secretary of State, official precinct-level results. Status: Official precinct-level results (Alabama Secretary of State)
Held under the district lines in effect at the time. Those boundaries differ from the 2026 district.
| Candidate | Party | Votes | Share |
|---|---|---|---|
| Barry Moore | Republican | 197,996 | 65.2% |
| Phyllis Harvey-Hall | Democratic | 105,286 | 34.7% |
| Write-In | NON | 287 | 0.1% |
| Total | 303,569 |
Source: Alabama Secretary of State, official precinct-level results. Status: Official precinct-level results (Alabama Secretary of State)
Certified results from state or county election authorities, as compiled in the Candidate Alerts precinct results database (public API candidatealerts.com/api/district-results). Totals are sums of certified precinct and county-level rows.
Demographics
2020 Census demographics by district are not yet published in this data set.
0 of 312 precincts are above 50%, and 0 are above 25%. Source: Census American Community Survey 2020-2024 5-year block groups, allocated to current precinct shapes by area.
Poll status
Map
Share of adults (18+) who speak Spanish at home, by precinct. Census ACS 2020-2024 5-year estimates on the current precinct layer. Hover a precinct for its value.
Alabama votes on new congressional district lines in 2026. The Census 119th Congress boundary file does not reflect the new lines, so only the state outline is shown here.
Precinct map: past elections and demographics
Choose a layer above. Hover a precinct for its values.
Precinct results
Certified precinct results on current precinct shapes, grouped by county. 302 precincts. "(part)" marks a precinct only partly inside this district; its full vote is shown, so district sums are approximate and are not the official district total. Elections were held under older lines and are shown on the 2026 district.
| County | 2024 President | 2022 Governor | 2020 President | |||
|---|---|---|---|---|---|---|
| Margin | Votes | Margin | Votes | Margin | Votes | |
| Montgomery | D+31.2 | 40,938 | D+5.5 | 41,618 | D+14.1 | 63,133 |
| Houston | R+40.2 | 30,518 | R+50.4 | 18,142 | R+41.7 | 28,972 |
| Coffee | R+57.9 | 17,452 | R+63.6 | 10,929 | R+58.5 | 17,264 |
| Dale | R+51.0 | 15,966 | R+59.5 | 8,823 | R+51.8 | 15,951 |
| Russell | D+6.9 | 11,551 | R+4.1 | 4,735 | D+0.9 | 15,105 |
| Elmore | R+52.3 | 9,467 | R+60.2 | 6,235 | R+53.2 | 13,170 |
| Pike | R+22.5 | 9,859 | R+30.8 | 6,244 | R+20.2 | 10,399 |
| Macon | D+54.1 | 7,125 | D+50.6 | 5,101 | D+58.6 | 7,137 |
| Butler | R+24.9 | 5,147 | R+40.2 | 3,618 | R+18.2 | 7,565 |
| Crenshaw | R+53.1 | 5,848 | R+59.0 | 4,262 | R+47.6 | 5,869 |
| Barbour | R+24.3 | 5,587 | R+29.7 | 3,845 | R+20.4 | 5,596 |
| Geneva | R+79.8 | 4,906 | R+84.2 | 3,339 | R+80.1 | 5,004 |
| Lowndes | D+30.9 | 4,806 | D+26.2 | 3,470 | D+30.5 | 4,971 |
| Covington | R+72.2 | 3,569 | R+74.9 | 2,398 | R+68.9 | 3,596 |
| Henry | R+38.8 | 1,357 | R+51.7 | 1,564 | R+48.0 | 3,206 |
| Bullock | R+3.2 | 756 | D+26.9 | 1,214 | D+26.6 | 2,221 |
| All counties (approx.) | R+18.0 | 174,852 | R+25.2 | 125,537 | R+18.0 | 209,159 |
Montgomery: 43 precincts
| Precinct | 2024 President | 2022 Governor | 2020 President | |||
|---|---|---|---|---|---|---|
| Margin | Votes | Margin | Votes | Margin | Votes | |
| 1ST CHRISTIAN CH | - | - | R+10.6 | 2,922 | R+9.7 | 3,500 |
| 1ST SOUTHERN BAPT | R+34.5 | 284 | R+43.0 | 200 | R+36.9 | 287 |
| ALDERSGATE METHODIST | D+69.7 | 2,773 | D+58.4 | 1,737 | D+68.0 | 2,386 |
| ASU ACADOME | - | - | D+65.2 | 480 | D+74.8 | 971 |
| AUM OUTREACH CTR | - | - | R+34.4 | 1,115 | R+35.3 | 1,242 |
| BEULAH BAPT CH | D+92.3 | 1,954 | D+89.8 | 1,343 | D+94.5 | 1,882 |
| CATOMA SCH | - | - | - | - | R+29.9 | 793 |
| CHISHOLM CC | - | - | D+45.5 | 444 | D+49.7 | 698 |
| CLEVELAND AVE YMCA | D+67.3 | 1,081 | D+65.0 | 671 | D+73.0 | 1,102 |
| DALRAIDA CH CHRIST | R+4.2 | 2,910 | R+28.4 | 1,873 | R+24.1 | 2,925 |
| DAVIS CROSSRODS | R+48.3 | 238 | R+64.3 | 185 | R+52.2 | 228 |
| DUBLIN SO MO VFD | R+55.4 | 410 | R+62.1 | 282 | R+48.7 | 398 |
| EASTDALE BAPT CH | D+62.7 | 1,247 | D+52.8 | 757 | D+55.8 | 1,202 |
| EASTMONT BAPT CH | R+10.1 | 3,005 | R+33.7 | 2,261 | R+36.4 | 2,750 |
| FRAZER CHURCH | D+23.8 | 4,956 | D+0.3 | 3,326 | D+9.5 | 4,473 |
| G. WASHINGTON SC | - | - | R+14.4 | 2,725 | R+16.0 | 3,519 |
| HAYNEVILLE RD COMM CTR | D+70.6 | 821 | D+69.1 | 544 | D+71.7 | 869 |
| HIGHLAND GARDEN CC | D+38.6 | 596 | D+25.7 | 362 | D+38.2 | 647 |
| HOUSTON HILLS CC | D+54.2 | 755 | D+43.6 | 466 | D+54.3 | 741 |
| HUNTER STATION CC | D+31.4 | 303 | D+31.5 | 200 | D+40.3 | 318 |
| KING HILL COMM CTR | - | - | D+25.5 | 483 | D+30.8 | 799 |
| LAGOON PARK FIRE | - | - | R+26.4 | 1,607 | R+21.1 | 2,341 |
| LAPINE BAPT CH | R+42.9 | 219 | R+52.1 | 140 | R+36.6 | 216 |
| LEO DRUM THEATER | - | - | R+40.9 | 2,403 | R+25.8 | 2,695 |
| MCINTYRE CC | D+89.0 | 1,151 | D+89.3 | 776 | D+92.9 | 1,217 |
| MUSEUM OF FINE ARTS | D+42.4 | 2,347 | - | - | D+28.9 | 2,276 |
| NEWTOWN COMM CTR | D+77.9 | 380 | D+79.3 | 208 | D+84.2 | 387 |
| PINE LEVEL SO MO VFD | R+48.0 | 421 | R+50.9 | 275 | R+45.9 | 431 |
| PINTLALA FIRE DEPT | R+31.0 | 1,192 | R+33.9 | 832 | R+37.6 | 1,081 |
| RAMER PUBLIC LIBRARY | R+31.7 | 398 | R+35.5 | 279 | R+30.9 | 398 |
| RUFUS LEWIS LIBRARY | D+88.8 | 643 | D+88.2 | 450 | D+90.9 | 613 |
| SHERIDAN HEIGHTS CTR | - | - | D+85.5 | 1,019 | D+82.6 | 1,533 |
| SNOWDOUN WOMEN'S CLUB | - | - | R+43.1 | 320 | R+32.5 | 434 |
| SOUTHLAWN BAPT | - | - | D+83.6 | 1,007 | D+89.3 | 1,250 |
| ST JAMES METHODIST | - | - | R+33.7 | 3,955 | R+38.9 | 4,412 |
| ST PAUL AME CH | D+61.4 | 2,251 | D+49.0 | 1,436 | D+58.0 | 2,128 |
| ST. JAMES BAPT CH | D+79.4 | 641 | - | - | D+85.3 | 687 |
| TRENHOLM COMM COLLEGE | - | - | D+87.8 | 591 | D+91.8 | 984 |
| UNION ACADEMY BAPT | R+31.4 | 140 | R+30.6 | 85 | R+23.1 | 143 |
| UNION CHAPEL AME | D+47.1 | 590 | D+43.4 | 389 | D+44.6 | 581 |
| VAUGHN PARK CH | D+33.4 | 3,710 | - | - | D+16.3 | 3,087 |
| WHITFIELD METHODIST | D+68.4 | 1,585 | D+55.3 | 1,101 | D+63.3 | 1,512 |
| WOODLAND UN METHODIST | R+16.3 | 3,937 | R+35.8 | 2,369 | R+34.6 | 2,997 |
Houston: 22 precincts
| Precinct | 2024 President | 2022 Governor | 2020 President | |||
|---|---|---|---|---|---|---|
| Margin | Votes | Margin | Votes | Margin | Votes | |
| ANDREW BELLE COMM CTR | D+3.2 | 598 | D+1.7 | 404 | D+9.8 | 630 |
| BAY SPRINGS VFD | R+70.1 | 680 | R+80.8 | 453 | R+71.9 | 670 |
| COTTONWOOD CITY HALL | - | - | - | - | R+66.6 | 1,208 |
| COTTONWOOD COMM. RM | - | - | R+72.8 | 791 | - | - |
| DOTHAN 1ST ASSEMBLY CLC | R+59.0 | 3,121 | R+72.8 | 2,014 | R+66.6 | 2,909 |
| DOTHAN CIVIC CTR | R+27.9 | 1,911 | R+39.8 | 1,324 | R+28.6 | 1,822 |
| DOUG TEW COMM CTR | R+28.8 | 2,297 | R+46.3 | 1,419 | R+30.7 | 2,125 |
| ENTERPRISE CH | R+81.8 | 939 | R+83.7 | 601 | R+83.6 | 937 |
| FARM CTR | R+34.9 | 2,869 | R+50.9 | 1,871 | R+43.6 | 2,821 |
| GORDON CITY HALL | R+8.9 | 202 | R+17.5 | 114 | D+5.6 | 233 |
| KINSEY SR CTR | R+33.4 | 1,319 | R+39.3 | 848 | R+31.2 | 1,255 |
| MT. GILEAD BAPT CH | R+61.4 | 2,721 | R+72.0 | 1,784 | R+66.4 | 2,452 |
| ROSSIE PURCELL LIBRARY | - | - | - | - | R+68.4 | 772 |
| ROSSIE PURCELL MUN BLDG | R+67.7 | 834 | R+75.5 | 548 | - | - |
| ST. JOHN'S PARK | R+32.9 | 331 | R+16.7 | 209 | R+28.2 | 312 |
| TAYLOR CITY HALL | R+69.7 | 1,691 | - | - | - | - |
| VAUGHN BLUMBERG CTR | R+29.7 | 2,203 | - | - | R+32.3 | 2,108 |
| WALTON PARK | D+71.6 | 1,306 | D+72.0 | 883 | D+73.6 | 1,384 |
| WEBB CITY HALL | R+64.1 | 718 | R+70.8 | 445 | R+60.4 | 737 |
| WESTGATE PARK | R+56.4 | 3,268 | R+70.3 | 2,317 | R+65.8 | 3,155 |
| WICKSBURG VFD | R+83.3 | 1,658 | R+86.7 | 972 | R+88.5 | 1,460 |
| WIREGRASS PARK | D+20.2 | 1,852 | D+11.7 | 1,145 | D+18.6 | 1,982 |
Coffee: 26 precincts
| Precinct | 2024 President | 2022 Governor | 2020 President | |||
|---|---|---|---|---|---|---|
| Margin | Votes | Margin | Votes | Margin | Votes | |
| BASIN VTG HOUSE | R+89.0 | 345 | R+90.0 | 240 | R+86.4 | 338 |
| CHESTNUT GROVE VTG | - | - | - | - | R+95.8 | 142 |
| COOL SPGS | - | - | R+77.9 | 583 | R+69.1 | 715 |
| DAMASCUS SR. CTR. | R+89.9 | 544 | R+87.4 | 388 | R+88.2 | 561 |
| EANON VTG HOUSE | R+90.5 | 518 | R+92.5 | 322 | R+91.2 | 445 |
| ELBA ZION CHRISTIAN COMM. | D+41.5 | 236 | D+44.8 | 163 | - | - |
| ENTERPRISE CIVIC CTR. | R+58.4 | 3,047 | R+70.5 | 1,953 | - | - |
| ENTERPRISE REC. CTR. | - | - | - | - | R+62.7 | 2,706 |
| EPRISE STATE COMM. COLL. | R+22.0 | 1,200 | R+33.1 | 768 | R+35.5 | 1,248 |
| FRISCO VTG HOUSE | R+70.1 | 592 | R+64.7 | 394 | R+57.3 | 419 |
| GOODMAN VTG HOUSE | R+82.5 | 538 | R+84.3 | 338 | R+81.4 | 469 |
| HERITAGE UMC | R+35.4 | 1,553 | R+40.3 | 827 | R+31.5 | 1,653 |
| HOLLEY'S STORE | R+89.9 | 119 | R+90.8 | 76 | R+90.7 | 107 |
| INO SR. CTR. | R+93.3 | 194 | R+94.4 | 126 | R+92.0 | 199 |
| JOHNS CHAPEL AME | D+2.9 | 1,270 | R+1.8 | 776 | D+3.3 | 1,353 |
| KINSTON CITY HALL | R+91.5 | 422 | R+92.1 | 278 | R+91.3 | 424 |
| MT PLEASANT SR. CTR. | R+83.4 | 1,358 | - | - | R+86.2 | 1,161 |
| NEWBIA VTG HOUSE | R+82.4 | 119 | R+77.6 | 85 | R+73.5 | 113 |
| PINE LEVEL SR. CTR. | R+89.3 | 234 | R+90.6 | 139 | R+87.4 | 230 |
| PLEASANT RIDGE VTG | R+67.6 | 939 | R+78.5 | 562 | R+72.5 | 641 |
| VICTORIA BAPT. CH | - | - | - | - | R+82.2 | 269 |
| WISE MILL | R+85.8 | 557 | R+86.1 | 366 | - | - |
| WISE MILL CH | - | - | - | - | R+83.0 | 305 |
| YMCA | R+59.4 | 3,195 | R+68.6 | 2,247 | R+63.4 | 3,027 |
| ZION CHAPEL SR. CTR. | R+86.4 | 472 | R+87.6 | 298 | R+83.0 | 452 |
| ZION CHRISTIAN COMM. | - | - | - | - | D+50.5 | 287 |
Dale: 17 precincts
| Precinct | 2024 President | 2022 Governor | 2020 President | |||
|---|---|---|---|---|---|---|
| Margin | Votes | Margin | Votes | Margin | Votes | |
| ARGUTA COMM. CTR. | R+83.8 | 229 | R+80.9 | 152 | R+86.8 | 204 |
| ARITON CITY HALL | R+76.5 | 599 | R+77.3 | 422 | R+65.9 | 631 |
| CLAYHATCHEE COMM. | R+71.5 | 502 | R+79.6 | 333 | R+74.0 | 473 |
| CLOPTON COMM. | R+85.2 | 162 | R+89.1 | 101 | R+78.6 | 154 |
| DALEVILLE CULTURE & CONV | R+33.9 | 1,651 | R+40.6 | 980 | R+34.0 | 1,649 |
| ECHO FIRE | R+87.5 | 931 | R+89.6 | 643 | R+88.3 | 914 |
| EWELL FIRE | - | - | R+68.4 | 677 | R+68.7 | 1,002 |
| GRIMES COMM. CTR. | R+36.8 | 973 | R+56.9 | 443 | R+46.2 | 769 |
| LEVEL PLAINS COMM. CTR. | R+41.6 | 1,629 | - | - | R+41.0 | 1,591 |
| MARLEY MILL FORESTRY | R+61.4 | 1,044 | - | - | R+65.8 | 859 |
| MIDLAND CITY VOTING HALL | R+42.4 | 609 | - | - | - | - |
| NEWTON TOWN HALL | R+70.1 | 937 | R+75.6 | 635 | R+76.5 | 949 |
| OZARK CIVIC CTR. | R+29.9 | 4,418 | R+38.4 | 3,098 | R+28.9 | 4,528 |
| PINCKARD TOWN HALL | R+70.8 | 1,486 | R+77.2 | 803 | R+71.1 | 1,148 |
| ROCKY HEAD - FT. RUCKER | - | - | - | - | R+30.8 | 273 |
| SKIPPERVILLE METHODIST | R+80.0 | 586 | R+84.5 | 394 | R+76.6 | 603 |
| SYLVAN GROVE | R+84.8 | 210 | R+92.3 | 142 | R+86.3 | 204 |
Russell: 20 precincts
| Precinct | 2024 President | 2022 Governor | 2020 President | |||
|---|---|---|---|---|---|---|
| Margin | Votes | Margin | Votes | Margin | Votes | |
| AUSTIN SUMBRY PARK | D+53.0 | 912 | - | - | D+38.0 | 837 |
| CENTRAL ACTIVITES BLDG | R+7.0 | 1,690 | - | - | R+1.7 | 1,690 |
| CLAUDE PARKMAN BLDG | - | - | D+72.6 | 296 | D+66.9 | 504 |
| COTTONTON FIRE STATION | - | - | R+44.4 | 266 | R+48.2 | 340 |
| COTTONTON VFD | R+42.7 | 464 | - | - | - | - |
| CVC | - | - | - | - | D+33.3 | 886 |
| CVCC | D+36.3 | 1,019 | D+30.3 | 580 | - | - |
| DIXIE VFD | R+46.0 | 376 | - | - | R+39.3 | 328 |
| FIRE DEPT HURTSBORO | - | - | D+41.1 | 443 | D+56.0 | 637 |
| FT. MITCHELL COMM CTR | D+17.9 | 2,077 | D+9.1 | 1,237 | D+5.5 | 1,810 |
| GOLDEN ACRES BAPT | R+35.0 | 637 | - | - | R+38.9 | 535 |
| HATCHECHUBBEE FIRE | - | - | R+2.9 | 138 | R+3.1 | 194 |
| HATCHECHUBBEE VFD | R+8.6 | 163 | - | - | - | - |
| LADONIA VFD | R+26.8 | 2,546 | - | - | R+47.4 | 2,076 |
| OLD SEALE C.H. | - | - | - | - | R+25.1 | 844 |
| PITTSVIEW FIRE | - | - | D+32.3 | 226 | D+32.4 | 318 |
| PITTSVIEW VFD | D+29.9 | 318 | - | - | - | - |
| ROY MARTIN CTR | - | - | R+53.7 | 1,549 | R+37.5 | 2,297 |
| RUSSELL COUNTY C.H. | D+45.8 | 557 | - | - | D+41.2 | 621 |
| SPENCER REC CTR | D+79.7 | 792 | - | - | D+81.3 | 1,188 |
Elmore: 14 precincts
| Precinct | 2024 President | 2022 Governor | 2020 President | |||
|---|---|---|---|---|---|---|
| Margin | Votes | Margin | Votes | Margin | Votes | |
| BLUE RIDGE BAPT. | R+61.6 | 942 | R+74.8 | 709 | R+67.8 | 939 |
| COOSADA TOWN HALL | R+21.2 | 711 | R+29.5 | 482 | R+14.8 | 743 |
| CRENSHAW PARK | D+13.2 | 507 | D+10.2 | 314 | D+17.3 | 519 |
| FRIENDSHIP COMM. CTR. | R+52.2 | 640 | - | - | - | - |
| FRIENDSHIP FIRE | - | - | R+55.5 | 375 | R+46.3 | 615 |
| GOD'S CONGREGATION | - | - | - | - | D+76.0 | 192 |
| GOD'S CONGREGATIONAL | D+71.4 | 112 | D+61.8 | 76 | - | - |
| MULDER METHODIST | - | - | - | - | R+58.7 | 3,671 |
| ROCK SPRGS. VOTING | R+53.0 | 506 | R+60.0 | 305 | R+55.1 | 510 |
| RUSHENVILLE BAPT. (part) | R+84.3 | 860 | R+86.5 | 578 | R+84.2 | 843 |
| TALLAWEKA BAPT. | R+62.2 | 1,636 | R+73.9 | 1,006 | R+63.7 | 1,692 |
| WALLSBORO COMM. | - | - | R+56.3 | 776 | R+50.8 | 1,084 |
| WALLSBORO COMM. CTR. | R+53.8 | 1,127 | - | - | - | - |
| WETUMPKA CIVIC CTR. | R+58.3 | 2,426 | R+67.7 | 1,614 | R+61.1 | 2,362 |
Pike: 34 precincts
| Precinct | 2024 President | 2022 Governor | 2020 President | |||
|---|---|---|---|---|---|---|
| Margin | Votes | Margin | Votes | Margin | Votes | |
| ANTIOCH CH OF CHRIST | R+71.1 | 301 | R+76.8 | 203 | R+69.6 | 289 |
| BANKS VOTING CTR #1 | R+53.8 | 106 | R+56.2 | 73 | R+42.9 | 98 |
| BANKS VOTING CTR #2 | R+69.8 | 311 | R+74.2 | 198 | R+54.1 | 342 |
| CHINA GROVE | - | - | - | - | R+11.2 | 196 |
| CHINA GROVE CO. BLDG. | R+27.2 | 184 | R+22.6 | 115 | - | - |
| EBENEZER VOTING CTR #1 | R+39.4 | 71 | R+45.8 | 48 | - | - |
| EBENEZER VOTING CTR #2 | R+72.0 | 100 | R+72.0 | 75 | R+48.8 | 125 |
| ENON CO BLDG | R+82.2 | 213 | R+88.4 | 146 | R+79.3 | 217 |
| FIRST BAPT CH | - | - | - | - | R+37.9 | 1,252 |
| FIRST BAPT CHURCH | R+30.3 | 1,006 | R+48.2 | 788 | - | - |
| GALLOWAY RD COMM CTR | D+41.0 | 768 | D+34.4 | 468 | D+66.9 | 598 |
| GOLDEN SATELLITE BLDG | R+8.2 | 268 | R+17.1 | 193 | R+11.0 | 326 |
| GOSHEN TOWN HALL | R+70.9 | 388 | R+71.1 | 263 | R+67.8 | 379 |
| HAMILTON CROSS ROADS | R+76.6 | 184 | R+87.1 | 140 | R+80.7 | 202 |
| HENDERSON VOTING CTR #1 | R+79.4 | 165 | R+88.3 | 60 | R+81.2 | 85 |
| HENDERSON VOTING CTR #2 | R+80.5 | 159 | R+63.6 | 88 | R+61.9 | 126 |
| JOSIE CO BLDG | R+68.5 | 216 | R+68.6 | 159 | R+65.8 | 199 |
| LITTLE OAK SCOTT FARMS BLDG | - | - | - | - | R+75.3 | 267 |
| MEEKSVILLE VFD | - | - | - | - | D+5.7 | 402 |
| OAK BOWERY CH OF CHRIST | R+23.6 | 144 | R+23.3 | 103 | R+20.8 | 144 |
| PIKE CO COURTHOUSE | D+41.9 | 804 | D+52.3 | 407 | D+35.2 | 934 |
| RURAL HOME CO BLDG | R+41.6 | 450 | R+40.9 | 301 | R+40.1 | 419 |
| SACO VFD | - | - | - | - | R+16.7 | 24 |
| SACO VFD #1 | D+50.0 | 8 | R+20.0 | 5 | - | - |
| SACO VFD #2 | D+27.1 | 48 | D+28.0 | 25 | - | - |
| SACO VOTING CTR #2 | - | - | - | - | D+77.8 | 27 |
| SPRINGHILL VFD | R+73.9 | 329 | R+74.7 | 198 | R+70.2 | 289 |
| SWEET PILGRIM CH | R+18.7 | 123 | R+9.0 | 67 | R+7.4 | 122 |
| TARENTUM COMM CLUB | - | - | - | - | R+61.6 | 354 |
| TARENTUM COMM CLUBHOUSE | R+62.4 | 351 | R+66.2 | 210 | - | - |
| TENNILLE METHODIST CH | R+84.2 | 95 | R+85.5 | 69 | R+83.5 | 85 |
| TROY PUBLIC LIBRARY | D+51.1 | 1,146 | D+44.4 | 710 | D+67.0 | 1,021 |
| TROY REC | - | - | - | - | R+40.5 | 1,877 |
| TROY REC CTR | R+37.6 | 1,921 | R+53.5 | 1,132 | - | - |
Macon: 14 precincts
| Precinct | 2024 President | 2022 Governor | 2020 President | |||
|---|---|---|---|---|---|---|
| Margin | Votes | Margin | Votes | Margin | Votes | |
| BROWNVILLE VFD | D+49.8 | 229 | D+50.0 | 162 | D+55.0 | 240 |
| CHISHOLM COMM CTR | D+4.1 | 388 | R+4.0 | 249 | D+2.8 | 358 |
| COTTON VALLEY REC CTR | D+74.6 | 224 | D+71.9 | 192 | D+78.5 | 246 |
| DIST 4 COMM CTR | R+25.7 | 421 | R+24.6 | 272 | R+16.3 | 418 |
| DIST 4 REC CTR | D+88.9 | 244 | D+89.4 | 179 | D+91.8 | 281 |
| FRANKLIN TOWN HALL | D+43.5 | 618 | D+41.0 | 451 | D+41.3 | 632 |
| MARGARET MURRAY | - | - | - | - | D+92.8 | 97 |
| NATIONAL GUARD ARMORY | D+85.0 | 799 | D+77.3 | 585 | D+88.1 | 830 |
| NOTASULGA TOWN HALL | R+6.5 | 836 | R+6.8 | 586 | D+6.2 | 787 |
| PRAIRIE FARM REC CTR | D+44.1 | 725 | D+37.7 | 539 | D+45.6 | 737 |
| SOJOURNER COMM CTR | D+91.7 | 1,001 | D+82.8 | 691 | D+92.1 | 903 |
| TUSKEGEE MUNICIPAL CMPLX | D+89.6 | 1,047 | D+83.8 | 784 | D+89.6 | 1,009 |
| VOLUNTEER FIRE STATION | D+47.9 | 265 | D+44.0 | 193 | D+63.1 | 271 |
| WARRIOR DIST 2 REC CTR | D+76.8 | 328 | D+74.8 | 218 | D+86.0 | 328 |
Butler: 24 precincts
| Precinct | 2024 President | 2022 Governor | 2020 President | |||
|---|---|---|---|---|---|---|
| Margin | Votes | Margin | Votes | Margin | Votes | |
| CENTRAL VFD | R+19.2 | 438 | R+24.9 | 313 | R+14.3 | 467 |
| CHAPMAN POST OFFICE | R+60.1 | 143 | - | - | R+70.4 | 142 |
| DUNBAR COMM. CTR. | D+56.3 | 833 | D+45.8 | 528 | D+59.6 | 874 |
| FOREST HOME VTG HOUSE | R+62.7 | 249 | R+71.6 | 190 | R+54.0 | 139 |
| FRIENDSHIP OLD SCH | - | - | - | - | R+88.8 | 116 |
| FRIENDSHIP OLD SCH HOUSE | R+88.4 | 129 | - | - | - | - |
| FRIENDSHIP OLD SCHOOL | - | - | R+91.8 | 98 | - | - |
| GARLAND VFD | R+53.2 | 171 | R+54.0 | 126 | - | - |
| GARLAND VTG HOUSE | - | - | - | - | R+47.6 | 273 |
| GREENVILLE POLICE DEPT. | - | - | - | - | R+4.8 | 1,148 |
| HARRISON'S VTG HOUSE | R+83.7 | 356 | R+88.7 | 256 | R+86.4 | 243 |
| HEALTH DEPT. | - | - | R+48.8 | 732 | R+19.5 | 1,205 |
| INDUSTRY | - | - | - | - | R+93.6 | 156 |
| INDUSTRY OLD SCH HOUSE | R+89.9 | 139 | - | - | - | - |
| MANNINGHAM VTG HOUSE | D+17.0 | 159 | D+5.9 | 118 | R+7.1 | 226 |
| MCKENZIE CITY HALL | R+54.0 | 493 | R+54.8 | 321 | - | - |
| MCKENZIE TOWN HALL | - | - | - | - | R+46.5 | 404 |
| MIDWAY & DAMASCUS VFD | R+53.3 | 246 | R+53.8 | 171 | - | - |
| MIDWAY VTG HOUSE | - | - | - | - | R+48.0 | 246 |
| PROVIDENCE VTG HOUSE | R+53.0 | 400 | R+48.4 | 285 | R+45.4 | 425 |
| ROCKY CREEK VTG HOUSE | R+73.6 | 280 | R+89.1 | 202 | R+72.6 | 288 |
| SEARCY VFD | R+32.2 | 199 | R+37.8 | 143 | R+51.2 | 217 |
| SR. MULTIPURPOSE CTR. | D+24.1 | 750 | - | - | D+22.3 | 824 |
| STEINER'S STORE | R+76.5 | 162 | R+80.0 | 135 | R+72.7 | 172 |
Crenshaw: 21 precincts
| Precinct | 2024 President | 2022 Governor | 2020 President | |||
|---|---|---|---|---|---|---|
| Margin | Votes | Margin | Votes | Margin | Votes | |
| BRANTLEY COMM. | - | - | - | - | R+36.6 | 743 |
| BRANTLEY COMM. CTR | R+43.7 | 689 | R+49.7 | 539 | - | - |
| BUSH'S GROCERY | - | - | R+55.9 | 34 | R+60.8 | 51 |
| CHAPEL HILL COMM. | R+89.6 | 414 | R+87.3 | 315 | R+83.8 | 364 |
| COUNTY COURTHOUSE | R+70.6 | 907 | R+78.9 | 559 | R+61.7 | 810 |
| DANIELVILLE SCH | R+84.0 | 324 | R+88.3 | 196 | - | - |
| DANIELVILLE SCHOOL | - | - | - | - | R+83.7 | 282 |
| DOZIER CITY HALL | R+41.9 | 291 | R+53.8 | 195 | R+42.0 | 283 |
| GLENWOOD CITY HALL | R+62.0 | 163 | R+62.3 | 130 | R+57.1 | 175 |
| HARBIN FARM CTR | D+17.2 | 466 | D+17.3 | 283 | D+34.2 | 476 |
| HIGHLAND HOME FD | R+81.6 | 554 | R+85.4 | 369 | R+83.9 | 477 |
| LILLER'S STORE | - | - | R+87.0 | 192 | R+85.7 | 251 |
| PANOLA COMM. CTR | R+45.8 | 301 | R+55.9 | 227 | R+44.0 | 309 |
| PATSBURG DEPOT | - | - | R+97.6 | 125 | R+94.3 | 159 |
| PETREY COMM. CTR | R+3.5 | 652 | D+26.8 | 339 | D+26.6 | 511 |
| PLEASANT HOME SCH | R+57.1 | 126 | R+63.0 | 81 | R+42.2 | 109 |
| RUTLEDGE COMM. | - | - | - | - | R+50.3 | 465 |
| RUTLEDGE COMM. CTR | R+56.7 | 506 | R+61.4 | 363 | - | - |
| VFD HONORAVILLE | R+84.6 | 182 | - | - | - | - |
| VIDETTE COMM. CTR | - | - | R+92.3 | 104 | R+85.7 | 140 |
| WEEDS STORE BRANTLEY | R+91.6 | 273 | R+91.5 | 211 | R+86.0 | 264 |
Barbour: 12 precincts
| Precinct | 2024 President | 2022 Governor | 2020 President | |||
|---|---|---|---|---|---|---|
| Margin | Votes | Margin | Votes | Margin | Votes | |
| BAKERHILL TOWN HALL | R+35.9 | 409 | R+40.3 | 258 | R+35.4 | 413 |
| BEVILL CTR. | R+58.1 | 1,046 | R+69.2 | 685 | R+59.3 | 963 |
| BLUE SPRINGS CITY HALL | R+83.2 | 268 | R+87.8 | 196 | R+78.9 | 270 |
| CLAYTON COURTHOUSE | D+15.4 | 735 | D+9.6 | 512 | D+24.7 | 756 |
| CLIO CITY HALL | R+6.2 | 420 | D+0.3 | 291 | D+0.0 | 474 |
| ELAMVILLE VFD | R+55.0 | 269 | R+59.7 | 201 | R+53.0 | 287 |
| EUFAULA COMM. CTR. | R+18.8 | 1,088 | R+25.9 | 779 | R+26.1 | 1,039 |
| GREEN'S CROSSROADS | R+29.2 | 130 | R+37.0 | 100 | R+22.5 | 129 |
| LOUISVILLE CITY HALL | R+6.3 | 476 | R+5.2 | 329 | D+11.8 | 516 |
| MT. ANDREWS COMM. CTR. | D+53.3 | 152 | D+54.6 | 97 | D+59.7 | 144 |
| SPRINGHILL VFD | D+6.7 | 326 | D+2.8 | 213 | D+16.8 | 333 |
| TEXASVILLE COMM. CTR. | R+54.9 | 268 | R+67.9 | 184 | R+54.0 | 272 |
Geneva: 8 precincts
| Precinct | 2024 President | 2022 Governor | 2020 President | |||
|---|---|---|---|---|---|---|
| Margin | Votes | Margin | Votes | Margin | Votes | |
| COFFEE SPRINGS | R+79.5 | 341 | R+86.2 | 224 | R+82.3 | 333 |
| DEVCO COMM. CTR. | R+81.7 | 438 | R+88.8 | 276 | R+83.4 | 469 |
| FADETTE | R+84.4 | 784 | R+87.5 | 519 | R+85.1 | 760 |
| HUGHES COMM. CTR. | R+74.5 | 2,288 | R+77.8 | 1,438 | R+72.6 | 2,217 |
| HUGHES VTG HOUSE | R+87.1 | 448 | R+85.8 | 318 | R+92.0 | 426 |
| LYTLE | R+85.1 | 356 | R+90.2 | 255 | R+83.1 | 354 |
| PINEY GROVE | - | - | R+98.0 | 148 | R+91.0 | 201 |
| REVELS STORE | R+90.4 | 251 | R+93.8 | 161 | R+88.5 | 244 |
Lowndes: 12 precincts
| Precinct | 2024 President | 2022 Governor | 2020 President | |||
|---|---|---|---|---|---|---|
| Margin | Votes | Margin | Votes | Margin | Votes | |
| BETHEL CHURCH | D+60.7 | 323 | D+45.9 | 207 | D+49.8 | 265 |
| BURKEVILLE VFD | D+33.3 | 406 | D+28.1 | 299 | D+34.4 | 424 |
| BURKVILLE FIRE STATION #2 | R+27.8 | 443 | - | - | - | - |
| FT. DEPOSIT ARMORY | D+42.8 | 556 | D+34.7 | 392 | D+36.4 | 527 |
| HAYNEVILLE C.H. ANNEX | D+50.6 | 581 | D+47.8 | 433 | D+52.1 | 599 |
| LILY BAPTIST CHURCH | R+14.0 | 157 | R+18.1 | 127 | R+13.7 | 182 |
| LOWNDES CITY DEV OFC | - | - | R+32.2 | 311 | R+25.0 | 452 |
| LOWNDESBORO CME CHURCH | R+61.3 | 432 | R+69.4 | 317 | R+66.5 | 462 |
| MOSSES TOWN HALL | D+92.1 | 555 | D+90.8 | 403 | D+93.8 | 584 |
| NEW SALEM CHURCH | D+31.4 | 404 | D+27.2 | 268 | D+36.1 | 435 |
| SANDY RIDGE COMMUNITY | R+13.5 | 310 | R+12.0 | 233 | R+12.9 | 310 |
| WHITE HALL TOWN HALL | D+68.1 | 639 | D+66.3 | 480 | D+70.3 | 731 |
Covington: 3 precincts
| Precinct | 2024 President | 2022 Governor | 2020 President | |||
|---|---|---|---|---|---|---|
| Margin | Votes | Margin | Votes | Margin | Votes | |
| OPP SR. ACTIVITY CTR. (part) | R+68.7 | 2,784 | R+71.9 | 1,888 | R+64.9 | 2,866 |
| ROSE HILL COMM. CTR. | R+85.5 | 406 | R+85.9 | 276 | R+83.1 | 378 |
| UNION GROVE FIRE | R+83.6 | 379 | R+86.8 | 234 | R+85.8 | 352 |
Henry: 13 precincts
| Precinct | 2024 President | 2022 Governor | 2020 President | |||
|---|---|---|---|---|---|---|
| Margin | Votes | Margin | Votes | Margin | Votes | |
| CAPPS POST OFFICE | - | - | - | - | R+21.6 | 388 |
| DOUGLAS CROSSROADS | - | - | R+86.2 | 298 | R+87.7 | 357 |
| EDWIN CLUBHOUSE | R+31.9 | 210 | - | - | - | - |
| HALEBURG CITY HALL | R+75.4 | 256 | R+77.5 | 204 | R+77.2 | 263 |
| JUDSON COMM. | - | - | - | - | R+65.2 | 811 |
| LAWRENCEVILLE HS | - | - | - | - | R+22.5 | 249 |
| LAWRENCEVILLE VT. HOUSE | - | - | R+29.9 | 187 | - | - |
| NEWVILLE VT. HOUSE | R+33.4 | 719 | R+34.7 | 521 | - | - |
| NEWVILLE VTG HOUSE | - | - | - | - | R+31.2 | 701 |
| SHORTERVILLE BAPTIST | R+15.1 | 172 | R+14.6 | 151 | - | - |
| SHORTERVILLE HOUSE | - | - | - | - | R+8.5 | 188 |
| UNION VT. HOUSE | - | - | R+66.5 | 203 | - | - |
| UNION VTG HOUSE | - | - | - | - | R+47.4 | 249 |
Bullock: 19 precincts
| Precinct | 2024 President | 2022 Governor | 2020 President | |||
|---|---|---|---|---|---|---|
| Margin | Votes | Margin | Votes | Margin | Votes | |
| ABERFOIL | - | - | - | - | D+47.7 | 199 |
| CORINTH | - | - | - | - | R+64.7 | 51 |
| CORNERSTONE | - | - | - | - | D+32.1 | 268 |
| CORNERSTONE REC. CTR. | D+49.6 | 274 | D+49.5 | 188 | - | - |
| FITZPATRICK | - | - | - | - | R+37.3 | 220 |
| FITZPATRICK VFD | R+40.1 | 242 | R+45.5 | 187 | - | - |
| GUERRYTON | - | - | - | - | D+76.6 | 77 |
| INDIAN CREEK 00050.001 | - | - | - | - | D+20.7 | 111 |
| INVERNESS | - | - | - | - | R+9.7 | 103 |
| MIDWAY | - | - | - | - | D+84.6 | 384 |
| PEACHBURG | - | - | - | - | D+64.0 | 89 |
| PEROTE | - | - | - | - | R+17.5 | 103 |
| PEROTE VOTING BLDG. | R+26.3 | 240 | - | - | - | - |
| PEROTE VOTING BUILDING | - | - | R+20.8 | 178 | - | - |
| POST OAK | - | - | - | - | R+40.7 | 270 |
| SARDIS | - | - | - | - | D+68.0 | 125 |
| THOMPSON | - | - | - | - | D+30.3 | 109 |
| THREE NOTCH HWY 82E | - | - | - | - | D+71.4 | 112 |
| UNION SPRINGS REC. CTR. | - | - | D+53.7 | 661 | - | - |
2024 President (Kamala D. Harris vs. Donald J. Trump). Source: Alabama Secretary of State, official precinct-level results. Official precinct-level results (Alabama Secretary of State).
2022 Governor (Yolanda Rochelle Flowers vs. Kay Ivey). Source: Alabama Secretary of State, official precinct-level results. Official precinct-level results (Alabama Secretary of State).
2020 President (Joseph R. Biden vs. Donald J. Trump). Source: Alabama Secretary of State, official precinct-level results. Official precinct-level results (Alabama Secretary of State).
Precinct demographics
Demographics are Census American Community Survey (ACS) 2020-2024 5-year estimates for block groups, assigned to precincts by area share. They describe the resident population, not registered or likely voters, and include non-citizens. ACS margins of error are not shown; small precincts carry large error. Area weighting assumes people are spread evenly within each block group, so large rural precincts are the least reliable. Median income is a household-weighted average of block-group medians, an approximation.
| Area | Population | Voting-age pop. | % White non-Hisp. | % Hispanic | % Black | % Asian | Median income* | % Bachelor's+ | % 18-29 (of adults) | % 65+ | % Homeowners | % Below poverty | % Spanish at home (adults) |
|---|---|---|---|---|---|---|---|---|---|---|---|---|---|
| District | 728,340 | 561,404 | 49.2% | 5.0% | 40.4% | 1.7% | $62k | 24.6% | 20.6% | 17.7% | 64.1% | 19.6% | 2.9% |
| Montgomery (in district) | 233,487 | 177,182 | 29.7% | 4.9% | 58.9% | 3.3% | $68k | 34.4% | 21.4% | 16.2% | 57.7% | 20.0% | 2.7% |
| Houston (in district) | 110,901 | 85,457 | 63.2% | 4.7% | 27.2% | 1.1% | $63k | 23.1% | 18.1% | 18.7% | 63.6% | 17.6% | 3.1% |
| Russell (in district) | 59,831 | 45,316 | 44.0% | 6.1% | 45.0% | 0.5% | $53k | 18.1% | 19.7% | 15.3% | 61.3% | 22.2% | 3.1% |
| Coffee (in district) | 56,224 | 42,661 | 67.3% | 9.8% | 15.7% | 1.2% | $71k | 22.4% | 18.5% | 17.1% | 72.0% | 16.8% | 5.7% |
| Dale (in district) | 50,261 | 38,542 | 66.1% | 7.1% | 20.3% | 1.2% | $57k | 20.4% | 20.3% | 18.1% | 61.9% | 18.7% | 3.5% |
| Elmore (in district) | 38,390 | 29,532 | 71.9% | 3.4% | 22.2% | 0.3% | $86k | 25.1% | 19.0% | 17.5% | 76.9% | 11.7% | 1.5% |
| Pike (in district) | 33,858 | 27,342 | 54.5% | 2.7% | 37.2% | 1.9% | $54k | 28.1% | 35.7% | 15.5% | 61.1% | 23.4% | 1.6% |
| Geneva (in district) | 27,043 | 21,105 | 80.5% | 5.3% | 8.4% | 0.6% | $55k | 13.3% | 16.0% | 20.3% | 78.1% | 19.2% | 2.8% |
| Barbour (in district) | 24,696 | 19,576 | 43.8% | 6.2% | 46.3% | 0.6% | $51k | 10.6% | 18.3% | 20.1% | 68.3% | 21.4% | 4.8% |
| Macon (in district) | 19,369 | 16,392 | 17.1% | 2.2% | 77.2% | 0.3% | $46k | 21.3% | 34.5% | 20.9% | 61.2% | 24.3% | 1.5% |
| Butler (in district) | 18,919 | 14,740 | 50.3% | 1.7% | 44.9% | 1.3% | $46k | 13.5% | 16.7% | 22.0% | 65.7% | 22.5% | 1.8% |
| Henry (in district) | 17,835 | 14,195 | 70.2% | 2.2% | 24.8% | 0.2% | $66k | 21.8% | 14.7% | 23.8% | 79.5% | 18.4% | 1.4% |
| Crenshaw (in district) | 13,270 | 10,250 | 69.8% | 2.2% | 23.5% | 0.4% | $49k | 18.7% | 17.2% | 20.2% | 73.2% | 17.9% | 1.5% |
| Bullock (in district) | 10,167 | 8,079 | 21.1% | 6.0% | 69.4% | 0.4% | $34k | 8.1% | 19.0% | 18.6% | 66.7% | 33.2% | 4.2% |
| Lowndes (in district) | 9,872 | 7,705 | 24.7% | 0.2% | 73.8% | 0.0% | $40k | 14.4% | 17.9% | 20.6% | 77.5% | 29.9% | 1.4% |
| Covington (in district) | 4,217 | 3,330 | 84.2% | 0.6% | 10.4% | 0.0% | $50k | 12.8% | 17.2% | 21.6% | 77.5% | 19.7% | 0.5% |
Montgomery: 49 precincts
| Precinct | Population | Voting-age pop. | % White non-Hisp. | % Hispanic | % Black | % Asian | Median income* | % Bachelor's+ | % 18-29 (of adults) | % 65+ | % Homeowners | % Below poverty | % Spanish at home (adults) |
|---|---|---|---|---|---|---|---|---|---|---|---|---|---|
| Al State Univ / Acadome | 5,527 | 4,697 | 20.4% | 5.9% | 71.0% | 0.6% | $48k | 27.2% | 58.6% | 10.4% | 28.4% | 33.2% | 4.0% |
| Aldersgate UM Church | 10,441 | 7,656 | 13.1% | 6.8% | 78.9% | 0.2% | $41k | 30.8% | 30.7% | 10.3% | 32.6% | 35.5% | 2.3% |
| Arrowhead Country Club | 2,377 | 2,187 | 65.6% | 0.7% | 24.2% | 2.5% | $110k | 38.2% | 12.7% | 26.3% | 95.2% | 5.0% | 1.8% |
| Beulah Baptist Church | 5,536 | 4,410 | 1.0% | 6.9% | 90.5% | 0.0% | $40k | 10.0% | 14.9% | 21.3% | 51.5% | 36.9% | 6.1% |
| Catoma Elem School | 1,866 | 1,426 | 42.7% | 7.2% | 49.7% | 0.0% | $45k | 18.1% | 20.8% | 24.0% | 83.9% | 14.7% | 0.0% |
| Chisholm Comm Ctr | 3,145 | 2,164 | 16.0% | 2.0% | 73.7% | 6.8% | $49k | 10.6% | 28.7% | 10.2% | 43.8% | 25.9% | 1.6% |
| Cleveland Ave YMCA | 4,551 | 3,540 | 18.1% | 4.4% | 68.6% | 0.2% | $41k | 25.4% | 21.3% | 14.7% | 31.9% | 46.2% | 3.1% |
| Dalraida Church of Christ | 8,966 | 6,689 | 43.0% | 13.1% | 38.8% | 0.4% | $56k | 22.5% | 22.5% | 15.0% | 55.0% | 25.7% | 6.5% |
| Davis Crossroads Fire Station | 596 | 471 | 47.6% | 1.7% | 48.9% | 0.0% | $91k | 31.0% | 8.1% | 27.5% | 84.3% | 10.8% | 0.3% |
| Drum Theater/Huntingdon College | 7,189 | 5,750 | 60.8% | 6.6% | 29.1% | 0.3% | $92k | 60.9% | 24.5% | 18.4% | 67.2% | 11.2% | 4.0% |
| Dublin Fire Station | 700 | 592 | 71.3% | 4.2% | 19.7% | 0.0% | $57k | 18.9% | 22.0% | 26.2% | 78.8% | 25.0% | 0.4% |
| Eastdale Bapt Church | 3,873 | 2,627 | 27.0% | 0.5% | 70.9% | 1.0% | $48k | 20.1% | 17.4% | 15.5% | 41.0% | 39.8% | 0.0% |
| Eastmont Bapt Church | 7,327 | 5,767 | 49.2% | 1.9% | 46.6% | 0.7% | $74k | 37.8% | 15.4% | 24.4% | 65.0% | 8.3% | 1.0% |
| Fire Station #14 | 2,531 | 2,112 | 4.8% | 5.9% | 89.0% | 0.0% | $44k | 14.5% | 14.9% | 35.7% | 80.3% | 29.6% | 0.9% |
| First Southern Bapt Church | 830 | 644 | 47.6% | 18.3% | 33.8% | 0.0% | $66k | 17.0% | 26.6% | 12.6% | 48.6% | 24.3% | 2.4% |
| Fitzpatrick Elem School | 8,192 | 5,659 | 14.4% | 6.7% | 74.4% | 0.5% | $61k | 34.2% | 24.4% | 14.2% | 67.3% | 35.9% | 4.0% |
| Flowers Elem School | 5,446 | 3,983 | 36.2% | 6.1% | 51.5% | 0.8% | $59k | 23.4% | 23.2% | 11.9% | 54.5% | 15.0% | 4.8% |
| Frazer UM Church | 12,037 | 10,010 | 31.7% | 1.6% | 54.0% | 7.6% | $68k | 43.8% | 23.7% | 18.6% | 50.0% | 10.8% | 2.2% |
| Fresh Anointing House of Worship | 11,692 | 8,582 | 4.0% | 1.7% | 92.1% | 0.0% | $52k | 15.0% | 12.9% | 18.7% | 52.5% | 24.9% | 1.1% |
| Georgia Washingtn Mid School | 13,856 | 9,600 | 44.3% | 3.6% | 39.7% | 7.8% | $100k | 49.5% | 15.5% | 9.9% | 85.3% | 4.5% | 0.6% |
| Hayneville Rd Comm Ctr | 4,159 | 3,201 | 34.1% | 11.5% | 48.6% | 2.7% | $53k | 16.7% | 23.2% | 9.0% | 35.2% | 28.6% | 6.6% |
| Highland Gardens Comm Ctr | 3,726 | 2,347 | 18.6% | 8.8% | 68.9% | 0.7% | $40k | 6.9% | 31.6% | 7.1% | 33.1% | 42.4% | 8.9% |
| Houston Hills Comm Ctr | 4,600 | 3,324 | 15.1% | 18.3% | 60.5% | 0.7% | $25k | 18.4% | 23.5% | 11.6% | 20.9% | 40.0% | 6.7% |
| Hunter Station Comm Ctr | 848 | 699 | 31.5% | 10.3% | 55.3% | 0.0% | $40k | 0.9% | 19.2% | 11.6% | 46.3% | 56.9% | 9.1% |
| King Hill Comm Ctr | 2,968 | 2,285 | 40.4% | 16.4% | 34.7% | 0.6% | $44k | 21.6% | 20.7% | 22.0% | 50.0% | 24.1% | 7.1% |
| Lagoon Park Fire Station | 6,369 | 5,008 | 48.9% | 13.4% | 33.5% | 0.7% | $55k | 32.3% | 22.9% | 20.6% | 66.0% | 16.4% | 7.2% |
| Landmark Church of Christ | 11,953 | 9,230 | 32.8% | 5.5% | 51.8% | 7.4% | $90k | 60.0% | 19.5% | 14.1% | 63.2% | 8.8% | 2.6% |
| Lapine Bapt Church | 594 | 505 | 76.1% | 0.0% | 22.8% | 0.0% | $49k | 21.0% | 16.7% | 24.3% | 85.7% | 16.6% | 0.0% |
| McIntyre Comm Ctr | 3,281 | 2,644 | 2.4% | 1.6% | 93.2% | 0.0% | $38k | 12.0% | 23.9% | 18.9% | 40.6% | 35.5% | 2.0% |
| Montgomery Museum of Fine Arts | 7,024 | 5,752 | 25.2% | 5.1% | 66.7% | 1.1% | $73k | 40.4% | 26.9% | 16.6% | 44.8% | 11.2% | 5.6% |
| Newton Comm Ctr | 778 | 644 | 24.3% | 3.6% | 70.8% | 0.0% | $54k | 25.8% | 17.7% | 10.6% | 25.4% | 28.0% | 2.3% |
| Peter Crump Elem School | 4,484 | 3,261 | 1.2% | 0.0% | 95.2% | 0.0% | $64k | 24.5% | 13.7% | 17.7% | 63.4% | 30.4% | 0.0% |
| Pine Level Fire Station | 1,038 | 819 | 55.9% | 9.2% | 25.3% | 0.0% | $65k | 18.5% | 26.2% | 26.4% | 73.0% | 26.3% | 1.6% |
| Pintlala VFD | 2,312 | 1,881 | 62.4% | 7.1% | 30.1% | 0.1% | $74k | 26.6% | 15.7% | 26.2% | 85.7% | 13.6% | 1.4% |
| Ramer Library | 702 | 615 | 68.4% | 0.0% | 30.5% | 0.0% | $43k | 17.3% | 12.6% | 30.0% | 79.2% | 18.9% | 0.0% |
| Rufus Lewis Library | 1,351 | 1,074 | 0.3% | 0.0% | 94.2% | 0.0% | $23k | 16.9% | 11.3% | 24.6% | 71.7% | 44.4% | 0.0% |
| Sheridan Heights Comm Ctr | 4,948 | 3,524 | 9.5% | 0.7% | 85.7% | 0.4% | $42k | 13.6% | 21.6% | 15.9% | 52.0% | 26.6% | 0.5% |
| Snowdoun Women's Club | 942 | 898 | 40.9% | 3.2% | 54.8% | 1.1% | $59k | 23.1% | 6.7% | 24.1% | 94.1% | 5.5% | 0.2% |
| Southlawn Elem School | 2,513 | 2,009 | 6.5% | 6.2% | 85.9% | 0.2% | $37k | 13.4% | 11.8% | 19.9% | 70.7% | 30.7% | 3.6% |
| St James Bapt Church | 993 | 934 | 10.3% | 0.5% | 88.8% | 0.0% | $28k | 27.7% | 10.1% | 27.7% | 60.5% | 33.0% | 0.1% |
| St James UM Church | 13,474 | 9,701 | 48.7% | 2.5% | 24.9% | 19.1% | $115k | 64.7% | 12.9% | 17.8% | 71.7% | 6.0% | 1.0% |
| St Paul AME Church | 6,148 | 4,813 | 37.3% | 1.9% | 55.1% | 2.2% | $80k | 42.9% | 18.6% | 16.6% | 66.7% | 13.1% | 1.9% |
| Trenholm State (Patterson Campus) | 4,827 | 3,379 | 3.6% | 0.2% | 94.0% | 0.0% | $44k | 17.6% | 36.0% | 7.7% | 19.9% | 25.6% | 0.2% |
| Union Academy Bapt Church | 550 | 440 | 35.8% | 0.7% | 57.0% | 0.0% | $119k | 25.1% | 14.6% | 16.0% | 81.0% | 14.5% | 0.7% |
| Union Chapel AME Church | 2,285 | 1,768 | 18.2% | 4.4% | 75.6% | 0.6% | $77k | 28.9% | 16.9% | 13.0% | 85.4% | 5.8% | 4.5% |
| Vaughn Park Church of Christ | 6,849 | 5,576 | 39.2% | 1.6% | 56.3% | 1.7% | $69k | 49.4% | 20.5% | 19.8% | 60.0% | 13.7% | 2.4% |
| Wares Ferry Rd Elem School | 3,989 | 2,653 | 9.9% | 2.0% | 84.9% | 2.5% | $67k | 33.5% | 20.4% | 7.9% | 77.3% | 6.9% | 2.1% |
| Whitfield UM Church | 4,604 | 3,750 | 15.2% | 0.1% | 82.2% | 2.2% | $57k | 30.8% | 35.5% | 20.0% | 41.4% | 23.2% | 0.0% |
| Woodland UM Church | 8,502 | 5,879 | 51.1% | 4.1% | 29.8% | 11.4% | $127k | 59.0% | 14.1% | 13.6% | 89.7% | 3.7% | 0.5% |
Houston: 27 precincts
| Precinct | Population | Voting-age pop. | % White non-Hisp. | % Hispanic | % Black | % Asian | Median income* | % Bachelor's+ | % 18-29 (of adults) | % 65+ | % Homeowners | % Below poverty | % Spanish at home (adults) |
|---|---|---|---|---|---|---|---|---|---|---|---|---|---|
| Andrew Belle Comm Ctr | 2,029 | 1,483 | 34.3% | 1.6% | 60.4% | 0.7% | $33k | 14.7% | 20.6% | 17.4% | 42.7% | 39.3% | 2.4% |
| Ashford Depot | 2,989 | 2,368 | 78.8% | 2.1% | 15.3% | 0.3% | $58k | 15.6% | 20.2% | 20.0% | 75.3% | 14.3% | 0.3% |
| Bay Springs VFD | 2,355 | 1,689 | 87.1% | 2.7% | 7.7% | 0.6% | $101k | 40.2% | 8.3% | 16.2% | 88.1% | 5.0% | 2.2% |
| Cottonwood City Hall | 3,232 | 2,645 | 80.2% | 6.1% | 9.3% | 0.1% | $46k | 9.3% | 14.8% | 24.1% | 75.4% | 21.7% | 4.8% |
| Cowarts City Hall | 2,991 | 2,398 | 76.6% | 3.1% | 13.1% | 0.2% | $57k | 13.3% | 19.1% | 23.5% | 72.5% | 17.5% | 0.4% |
| Dothan 1st Assembly | 6,898 | 5,275 | 76.9% | 4.2% | 14.7% | 2.1% | $89k | 48.7% | 13.5% | 18.0% | 65.5% | 3.3% | 2.9% |
| Dothan Civic Ctr | 5,730 | 4,381 | 52.3% | 3.2% | 40.8% | 0.8% | $64k | 34.6% | 18.2% | 18.9% | 61.8% | 20.2% | 2.2% |
| Doug Tew Comm Ctr | 8,839 | 6,714 | 47.4% | 5.9% | 41.7% | 0.6% | $46k | 20.7% | 21.3% | 16.1% | 52.8% | 22.4% | 4.3% |
| Enterprise Church | 2,613 | 2,040 | 83.9% | 3.5% | 8.9% | 0.0% | $55k | 14.7% | 16.1% | 19.8% | 74.9% | 16.6% | 2.4% |
| Farm Center | 7,891 | 6,233 | 58.7% | 5.5% | 31.2% | 2.2% | $57k | 22.3% | 18.6% | 17.5% | 58.8% | 14.4% | 4.3% |
| Gordon City Hall | 401 | 353 | 72.2% | 0.3% | 25.3% | 0.0% | $57k | 7.9% | 11.1% | 24.0% | 78.3% | 15.5% | 0.0% |
| Hodgesville VFD | 2,533 | 2,037 | 82.4% | 5.6% | 9.0% | 0.7% | $65k | 17.7% | 14.3% | 21.5% | 75.3% | 14.0% | 2.9% |
| Kinsey Sr Ctr | 2,665 | 2,117 | 66.0% | 4.1% | 25.1% | 1.3% | $64k | 20.1% | 26.2% | 19.2% | 80.6% | 10.4% | 2.6% |
| Madrid Sr Ctr | 2,440 | 1,815 | 81.2% | 4.9% | 5.5% | 0.0% | $73k | 17.1% | 14.8% | 15.5% | 75.2% | 14.6% | 1.2% |
| Mt Gilead Church | 6,065 | 4,695 | 74.6% | 8.8% | 11.4% | 1.9% | $79k | 29.9% | 17.5% | 20.3% | 69.2% | 8.4% | 4.0% |
| Pansey VFD | 875 | 747 | 77.5% | 0.4% | 18.7% | 0.0% | $56k | 10.6% | 12.7% | 23.7% | 80.2% | 13.8% | 0.4% |
| Rehobeth Complex | 3,562 | 2,623 | 85.3% | 6.2% | 3.8% | 0.2% | $79k | 19.0% | 13.8% | 18.7% | 80.1% | 12.6% | 4.7% |
| Rossie Purcell Library | 1,560 | 1,164 | 81.1% | 1.5% | 15.4% | 0.0% | $61k | 6.8% | 15.1% | 20.8% | 77.0% | 9.3% | 0.7% |
| St Johns Pk | 1,002 | 847 | 60.4% | 2.8% | 30.4% | 0.0% | $52k | 8.3% | 11.4% | 25.6% | 83.1% | 16.6% | 4.2% |
| Taylor City Hall | 6,157 | 4,474 | 79.2% | 7.0% | 9.0% | 0.5% | $66k | 15.6% | 17.0% | 15.6% | 71.5% | 17.7% | 5.1% |
| Vaughn Blumberg Ctr | 7,213 | 5,588 | 52.8% | 4.1% | 35.3% | 1.7% | $68k | 28.4% | 22.2% | 16.1% | 59.5% | 18.3% | 3.9% |
| Walton Park | 6,232 | 4,719 | 18.6% | 3.6% | 74.3% | 0.1% | $34k | 12.0% | 21.2% | 17.5% | 43.1% | 40.3% | 2.5% |
| Water & Electric | 4,516 | 3,560 | 71.4% | 5.5% | 17.0% | 2.1% | $73k | 25.7% | 17.6% | 21.7% | 71.3% | 13.5% | 3.7% |
| Webb City Hall | 2,068 | 1,714 | 80.0% | 1.3% | 16.5% | 0.9% | $55k | 19.2% | 21.2% | 20.3% | 79.7% | 11.0% | 0.6% |
| Westgate Park | 6,949 | 5,420 | 72.5% | 4.0% | 16.5% | 2.6% | $94k | 44.1% | 17.0% | 20.8% | 63.5% | 8.0% | 2.7% |
| Wicksburg VFD | 2,917 | 2,214 | 86.7% | 2.1% | 4.2% | 1.1% | $79k | 23.6% | 17.8% | 16.9% | 86.0% | 6.0% | 0.9% |
| Wiregrass Park | 8,179 | 6,144 | 28.4% | 5.6% | 62.2% | 0.5% | $32k | 7.6% | 20.4% | 17.9% | 32.5% | 38.2% | 4.1% |
Russell: 16 precincts
| Precinct | Population | Voting-age pop. | % White non-Hisp. | % Hispanic | % Black | % Asian | Median income* | % Bachelor's+ | % 18-29 (of adults) | % 65+ | % Homeowners | % Below poverty | % Spanish at home (adults) |
|---|---|---|---|---|---|---|---|---|---|---|---|---|---|
| Austin Sumbry Park | 2,355 | 1,712 | 50.4% | 3.8% | 40.2% | 0.0% | $56k | 14.8% | 14.5% | 14.8% | 73.7% | 19.3% | 2.7% |
| CVCC | 2,366 | 1,736 | 33.9% | 9.8% | 50.6% | 0.0% | $50k | 12.0% | 13.0% | 8.3% | 79.0% | 13.8% | 6.3% |
| Central Activities Ctr | 640 | 499 | 69.9% | 3.7% | 20.1% | 0.1% | $53k | 16.6% | 29.3% | 12.4% | 67.8% | 28.7% | 2.4% |
| Claude Parkman Bdg | 2,377 | 1,771 | 9.5% | 10.6% | 78.5% | 0.0% | $24k | 6.9% | 18.3% | 10.1% | 54.7% | 43.2% | 5.2% |
| Cottonton Fire St | 2,179 | 1,831 | 52.9% | 3.2% | 39.1% | 0.3% | $49k | 12.5% | 21.4% | 27.0% | 79.8% | 9.8% | 0.4% |
| Dixie VFD | 638 | 543 | 66.1% | 5.2% | 27.9% | 0.0% | $61k | 14.5% | 1.3% | 43.4% | 87.7% | 7.8% | 0.4% |
| Fire Dept Hurtsboro | 1,270 | 1,105 | 30.2% | 0.0% | 69.1% | 0.0% | $40k | 22.8% | 20.4% | 27.7% | 75.9% | 17.9% | 1.9% |
| Fort Mitchell Comm Ctr | 6,820 | 4,687 | 37.4% | 18.8% | 39.8% | 0.0% | $71k | 28.0% | 22.6% | 7.1% | 87.1% | 12.2% | 6.7% |
| Golden Acres Bapt | 3,717 | 3,033 | 75.5% | 2.7% | 18.3% | 0.1% | $68k | 15.5% | 12.6% | 20.7% | 83.6% | 11.7% | 0.6% |
| Hatchechubbee Fire Dept | 470 | 409 | 36.4% | 0.0% | 61.7% | 0.0% | $44k | 21.0% | 15.0% | 30.0% | 76.6% | 15.0% | 3.1% |
| Ladonia Fire Dept | 6,518 | 4,917 | 64.6% | 2.6% | 28.2% | 0.1% | $61k | 15.8% | 18.8% | 16.0% | 72.7% | 22.1% | 2.1% |
| Old Seale Courthouse | 1,452 | 1,191 | 61.4% | 0.9% | 32.7% | 0.2% | $58k | 15.4% | 20.4% | 21.6% | 79.0% | 7.4% | 0.8% |
| Pittsview Fire Dept | 909 | 804 | 47.2% | 1.2% | 46.6% | 0.0% | $53k | 16.8% | 14.6% | 30.8% | 83.9% | 10.3% | 3.2% |
| Roy Martin Ctr | 9,971 | 7,305 | 52.7% | 5.4% | 35.1% | 1.9% | $51k | 23.5% | 19.1% | 17.4% | 42.9% | 32.1% | 2.8% |
| Russell Co Courthouse | 11,473 | 8,880 | 36.9% | 3.5% | 52.3% | 0.9% | $48k | 16.7% | 22.4% | 12.8% | 41.0% | 23.3% | 2.1% |
| Spencer Rec Ctr | 6,675 | 4,894 | 17.3% | 6.0% | 73.9% | 0.0% | $48k | 16.9% | 24.5% | 12.3% | 52.4% | 29.4% | 5.2% |
Coffee: 30 precincts
| Precinct | Population | Voting-age pop. | % White non-Hisp. | % Hispanic | % Black | % Asian | Median income* | % Bachelor's+ | % 18-29 (of adults) | % 65+ | % Homeowners | % Below poverty | % Spanish at home (adults) |
|---|---|---|---|---|---|---|---|---|---|---|---|---|---|
| Basin | 994 | 801 | 70.4% | 1.8% | 21.9% | 0.0% | $53k | 8.4% | 11.6% | 24.7% | 88.7% | 11.0% | 2.2% |
| Bluff Springs | 367 | 270 | 83.6% | 2.7% | 7.1% | 0.0% | $56k | 14.7% | 13.8% | 14.3% | 74.0% | 16.7% | 0.2% |
| Chestnut Grove | 249 | 201 | 91.2% | 0.2% | 2.0% | 0.1% | $61k | 13.5% | 15.5% | 25.5% | 88.7% | 11.5% | 0.2% |
| Cool Springs | 3,715 | 2,993 | 66.8% | 8.9% | 15.8% | 3.5% | $74k | 19.2% | 25.7% | 16.4% | 64.7% | 14.3% | 4.1% |
| Damascus Sr. Ctr. | 1,443 | 1,132 | 76.0% | 5.5% | 11.1% | 0.5% | $64k | 19.2% | 13.3% | 18.2% | 83.2% | 12.9% | 2.3% |
| Eanon | 1,246 | 937 | 75.4% | 13.1% | 5.8% | 0.9% | $70k | 26.4% | 13.6% | 22.2% | 82.5% | 18.5% | 3.6% |
| Elba National Grd. | 1,512 | 1,155 | 66.0% | 0.7% | 22.3% | 1.6% | $41k | 18.1% | 14.1% | 23.9% | 78.8% | 30.3% | 0.7% |
| Elba Rec. Ctr. | 1,627 | 1,279 | 50.7% | 2.4% | 36.1% | 1.2% | $53k | 8.8% | 13.2% | 20.7% | 73.7% | 23.7% | 2.7% |
| Elba Zion Christian Comm. Ctr. | 437 | 309 | 58.0% | 2.2% | 28.5% | 2.7% | $52k | 10.1% | 19.2% | 19.0% | 56.1% | 39.2% | 1.5% |
| Enterprise Rec. Ctr. | 7,979 | 5,663 | 69.6% | 16.1% | 9.9% | 0.3% | $67k | 28.1% | 18.3% | 15.0% | 68.0% | 16.1% | 7.6% |
| Enterprise State Comm. College | 2,272 | 1,735 | 46.8% | 9.5% | 35.2% | 0.2% | $54k | 20.4% | 22.7% | 18.3% | 56.0% | 29.2% | 8.6% |
| Frisco | 828 | 636 | 84.1% | 0.4% | 8.4% | 0.4% | $68k | 13.7% | 10.7% | 24.2% | 88.5% | 15.5% | 1.3% |
| Goodman | 865 | 643 | 89.8% | 3.1% | 4.0% | 0.0% | $68k | 20.4% | 13.6% | 18.8% | 87.1% | 12.3% | 3.8% |
| Heritage UMC | 6,228 | 4,925 | 61.0% | 16.5% | 15.4% | 2.0% | $92k | 24.7% | 26.2% | 11.9% | 65.7% | 12.6% | 13.0% |
| Holley's Store | 423 | 315 | 89.9% | 3.0% | 4.0% | 0.0% | $68k | 20.3% | 13.6% | 18.9% | 87.2% | 12.3% | 3.8% |
| Ino Sr. Ctr. | 631 | 470 | 89.8% | 3.0% | 4.0% | 0.0% | $68k | 20.3% | 13.6% | 18.9% | 87.1% | 12.3% | 3.8% |
| Johns Chapel AME | 4,825 | 3,577 | 40.1% | 16.7% | 34.6% | 1.2% | $54k | 14.6% | 23.8% | 15.7% | 44.6% | 26.3% | 11.9% |
| Kinston City Hall | 1,140 | 979 | 92.9% | 2.5% | 0.1% | 2.0% | $47k | 12.0% | 17.0% | 23.9% | 79.6% | 15.2% | 1.7% |
| Lee Community | 370 | 284 | 74.0% | 5.5% | 13.2% | 0.1% | $49k | 20.2% | 20.9% | 17.5% | 58.9% | 16.9% | 0.1% |
| Mt. Pleasant Sr. Ctr. | 4,239 | 3,141 | 71.1% | 8.7% | 12.4% | 0.3% | $73k | 24.5% | 13.8% | 15.6% | 77.7% | 20.9% | 5.4% |
| New Brockton Farm Ctr | 1,266 | 961 | 74.3% | 11.7% | 6.2% | 1.1% | $75k | 27.5% | 13.9% | 19.1% | 86.0% | 14.0% | 2.7% |
| New Brocton Sr. Ctr. | 736 | 574 | 74.9% | 5.6% | 9.4% | 0.9% | $67k | 21.3% | 14.0% | 17.9% | 86.9% | 13.0% | 1.4% |
| Newbia | 433 | 320 | 81.4% | 3.3% | 8.5% | 0.0% | $54k | 15.7% | 15.5% | 14.8% | 70.3% | 16.7% | 0.1% |
| Pine Level Sr. Ctr. | 1,338 | 1,123 | 77.8% | 1.0% | 15.8% | 0.6% | $48k | 20.9% | 8.3% | 28.7% | 84.3% | 18.5% | 0.3% |
| Pleasant Ridge | 2,414 | 1,777 | 67.9% | 8.2% | 18.0% | 0.7% | $74k | 23.9% | 16.0% | 16.7% | 85.5% | 15.1% | 1.0% |
| Unassigned | 705 | 527 | 73.1% | 16.5% | 5.1% | 1.0% | $71k | 29.9% | 14.4% | 21.6% | 80.9% | 19.3% | 4.3% |
| Victoria BC | 592 | 489 | 93.3% | 0.1% | 0.1% | 0.0% | $60k | 13.6% | 17.2% | 27.6% | 89.9% | 9.8% | 0.0% |
| Wise Mill | 547 | 423 | 71.6% | 2.4% | 12.5% | 0.7% | $41k | 15.2% | 19.9% | 19.3% | 77.3% | 23.7% | 0.0% |
| YMCA | 6,236 | 4,609 | 70.7% | 7.6% | 13.3% | 2.6% | $105k | 34.5% | 19.2% | 15.2% | 77.7% | 7.0% | 4.8% |
| Zion Chapel Sr. Ctr. | 568 | 413 | 87.0% | 1.8% | 5.0% | 0.0% | $58k | 13.3% | 11.2% | 13.7% | 79.9% | 16.7% | 0.2% |
Dale: 19 precincts
| Precinct | Population | Voting-age pop. | % White non-Hisp. | % Hispanic | % Black | % Asian | Median income* | % Bachelor's+ | % 18-29 (of adults) | % 65+ | % Homeowners | % Below poverty | % Spanish at home (adults) |
|---|---|---|---|---|---|---|---|---|---|---|---|---|---|
| Arguta Comm Ctr | 506 | 374 | 81.3% | 10.2% | 3.9% | 0.0% | $73k | 18.1% | 12.4% | 21.2% | 92.6% | 12.3% | 5.0% |
| Ariton City Hall | 1,305 | 980 | 72.9% | 13.2% | 9.5% | 0.0% | $58k | 21.6% | 18.5% | 15.0% | 88.0% | 19.4% | 8.1% |
| Bertha Church | 357 | 248 | 92.5% | 0.7% | 0.3% | 0.0% | $62k | 8.3% | 20.9% | 16.7% | 84.9% | 1.1% | 0.2% |
| Clayhatchee Comm | 1,255 | 1,112 | 81.4% | 3.6% | 6.0% | 0.9% | $56k | 14.8% | 12.4% | 26.6% | 74.0% | 4.0% | 0.1% |
| Clopton Comm | 465 | 323 | 92.4% | 0.8% | 0.2% | 0.0% | $62k | 8.0% | 20.9% | 16.9% | 86.0% | 0.5% | 0.2% |
| Daleville Cultural | 7,554 | 5,791 | 54.1% | 9.2% | 24.9% | 3.1% | $52k | 25.4% | 25.9% | 12.9% | 43.6% | 16.5% | 4.5% |
| Echo Fire | 2,211 | 1,655 | 90.0% | 2.5% | 4.1% | 0.6% | $68k | 18.0% | 16.5% | 16.7% | 76.0% | 13.1% | 2.0% |
| Ewell FD | 2,233 | 1,803 | 86.6% | 2.6% | 8.8% | 0.7% | $51k | 19.9% | 14.9% | 20.5% | 77.3% | 14.5% | 2.1% |
| Grimes Comm Ctr | 3,464 | 2,502 | 47.9% | 7.3% | 43.0% | 0.0% | $43k | 6.9% | 24.5% | 13.7% | 43.3% | 29.5% | 7.2% |
| Level Plains | 4,976 | 3,917 | 68.9% | 13.4% | 9.1% | 1.2% | $75k | 17.7% | 18.8% | 17.3% | 75.4% | 11.4% | 2.9% |
| Marley Mill | 2,720 | 2,354 | 70.1% | 2.5% | 23.4% | 1.3% | $53k | 28.0% | 16.0% | 33.4% | 81.5% | 10.9% | 0.3% |
| Midland City | 1,241 | 1,028 | 67.7% | 2.0% | 22.3% | 0.0% | $42k | 19.1% | 24.0% | 23.2% | 46.2% | 18.8% | 1.1% |
| Newton Town Hall | 2,429 | 1,817 | 84.0% | 2.2% | 9.6% | 0.0% | $57k | 23.8% | 16.8% | 18.2% | 70.4% | 11.2% | 0.8% |
| Ozark Civic Ctr | 11,788 | 8,926 | 53.3% | 5.9% | 34.8% | 0.6% | $50k | 16.0% | 17.6% | 20.0% | 60.7% | 31.6% | 4.6% |
| Pinckard Town Hall | 2,353 | 1,925 | 77.1% | 3.3% | 15.2% | 0.0% | $61k | 28.6% | 18.0% | 22.4% | 65.7% | 13.2% | 1.3% |
| Rocky Head | 1,102 | 829 | 73.6% | 16.7% | 4.5% | 0.0% | $67k | 21.6% | 9.2% | 20.5% | 95.7% | 15.7% | 8.0% |
| Rocky Head Ft Rucker | 2,455 | 1,643 | 69.1% | 16.7% | 2.1% | 6.1% | $77k | 47.6% | 49.3% | 1.5% | 2.0% | 7.0% | 4.6% |
| Skipperville Church | 1,020 | 741 | 87.1% | 5.4% | 3.1% | 0.0% | $79k | 15.0% | 15.3% | 21.2% | 88.4% | 9.9% | 2.9% |
| Sylvan Grove | 827 | 573 | 84.2% | 0.1% | 15.7% | 0.0% | $73k | 12.7% | 16.6% | 21.5% | 63.1% | 35.2% | 0.2% |
Elmore: 13 precincts
| Precinct | Population | Voting-age pop. | % White non-Hisp. | % Hispanic | % Black | % Asian | Median income* | % Bachelor's+ | % 18-29 (of adults) | % 65+ | % Homeowners | % Below poverty | % Spanish at home (adults) |
|---|---|---|---|---|---|---|---|---|---|---|---|---|---|
| Blue Ridge Church | 1,452 | 1,234 | 90.6% | 4.0% | 2.1% | 1.2% | $122k | 56.0% | 23.8% | 26.8% | 92.7% | 5.9% | 3.1% |
| Coosada Town Hall | 1,853 | 1,349 | 65.5% | 3.4% | 26.9% | 0.3% | $72k | 30.5% | 17.9% | 20.9% | 85.5% | 19.8% | 2.5% |
| Crenshaw Park | 1,750 | 1,311 | 72.3% | 1.0% | 22.0% | 0.0% | $91k | 13.8% | 18.5% | 9.1% | 72.5% | 18.9% | 0.2% |
| Fain Sr Ctr | 4,614 | 3,372 | 64.2% | 0.2% | 33.0% | 0.0% | $64k | 23.7% | 16.3% | 16.1% | 65.2% | 13.1% | 0.1% |
| Friendship Comm Ctr | 1,198 | 1,023 | 70.8% | 1.0% | 26.9% | 0.0% | $95k | 15.3% | 31.3% | 21.8% | 66.4% | 6.4% | 0.2% |
| God's Congreg Church | 52 | 34 | 63.2% | 0.8% | 35.9% | 0.1% | $84k | 7.4% | 17.5% | 9.8% | 59.9% | 32.5% | 0.1% |
| Mulder Church | 8,772 | 6,733 | 78.4% | 4.3% | 16.1% | 0.0% | $122k | 34.8% | 16.6% | 15.7% | 92.7% | 2.7% | 1.5% |
| New Home Church | 3,637 | 2,666 | 71.9% | 5.7% | 18.5% | 0.3% | $63k | 14.0% | 26.5% | 13.3% | 61.8% | 21.7% | 2.8% |
| Rock Springs | 1,502 | 1,240 | 87.1% | 2.7% | 7.6% | 0.0% | $71k | 21.6% | 27.8% | 25.5% | 85.6% | 9.5% | 0.6% |
| Rushenville Church (part) | 1,568 | 1,242 | 86.5% | 1.7% | 9.0% | 0.0% | $73k | 21.9% | 12.0% | 24.2% | 81.8% | 9.0% | 0.3% |
| Tallaweka Church | 4,135 | 3,120 | 69.4% | 1.3% | 28.3% | 0.3% | $82k | 16.6% | 18.3% | 17.3% | 63.1% | 16.5% | 0.4% |
| Wallsboro Comm Ctr | 2,584 | 1,993 | 57.6% | 6.8% | 33.8% | 0.0% | $68k | 9.9% | 25.0% | 15.5% | 64.4% | 4.0% | 4.2% |
| Wetumpka Civic Ctr | 5,274 | 4,216 | 65.1% | 5.2% | 25.7% | 1.3% | $71k | 27.0% | 13.4% | 19.4% | 82.2% | 18.0% | 1.9% |
Pike: 33 precincts
| Precinct | Population | Voting-age pop. | % White non-Hisp. | % Hispanic | % Black | % Asian | Median income* | % Bachelor's+ | % 18-29 (of adults) | % 65+ | % Homeowners | % Below poverty | % Spanish at home (adults) |
|---|---|---|---|---|---|---|---|---|---|---|---|---|---|
| Antioch Church | 793 | 698 | 70.1% | 2.1% | 22.7% | 0.0% | $73k | 32.8% | 16.1% | 34.0% | 84.5% | 16.4% | 2.8% |
| Banks Voting Ctr 1 | 261 | 205 | 71.1% | 0.0% | 21.9% | 2.6% | $51k | 13.1% | 24.8% | 21.4% | 88.1% | 11.5% | 0.0% |
| Banks Voting Ctr 2 | 816 | 609 | 38.6% | 0.0% | 55.7% | 0.3% | $54k | 23.2% | 33.6% | 13.7% | 63.0% | 19.9% | 0.0% |
| Brundidge-Haisten Bldg | 1,502 | 1,103 | 42.6% | 1.7% | 53.4% | 0.2% | $43k | 14.6% | 19.6% | 19.1% | 65.6% | 32.0% | 1.2% |
| China Grove Co Bldg | 469 | 406 | 53.2% | 0.8% | 40.3% | 0.0% | $74k | 17.7% | 15.1% | 17.9% | 98.9% | 12.5% | 1.0% |
| Dunns Voting Ctr 1 | 63 | 55 | 53.2% | 0.8% | 40.2% | 0.0% | $74k | 17.7% | 15.1% | 17.9% | 98.9% | 12.5% | 1.0% |
| Dunns Voting Ctr 2 | 517 | 382 | 23.5% | 0.2% | 69.5% | 0.1% | $55k | 21.0% | 38.8% | 8.4% | 52.9% | 19.9% | 0.3% |
| Ebenezer Voting Ctr 1 | 158 | 124 | 71.0% | 0.0% | 21.9% | 2.5% | $51k | 13.2% | 24.7% | 21.4% | 88.0% | 11.6% | 0.0% |
| Ebenezer Voting Ctr 2 | 361 | 292 | 73.7% | 0.0% | 23.0% | 0.7% | $57k | 22.0% | 17.8% | 23.6% | 87.5% | 15.9% | 0.0% |
| Enon Co Bldg | 551 | 431 | 70.7% | 0.1% | 22.1% | 2.6% | $50k | 13.0% | 24.8% | 21.4% | 87.9% | 11.7% | 0.1% |
| First Bapt Church | 2,351 | 1,886 | 58.3% | 0.6% | 38.3% | 0.2% | $73k | 46.6% | 22.8% | 20.4% | 74.0% | 8.6% | 0.6% |
| Galloway Rd Comm Ctr | 621 | 487 | 35.1% | 5.5% | 57.3% | 0.2% | $37k | 14.8% | 19.5% | 21.1% | 62.3% | 27.5% | 2.9% |
| Golden/Satelllite Bldg | 1,252 | 821 | 48.4% | 7.5% | 39.6% | 0.3% | $42k | 11.5% | 16.4% | 19.8% | 71.2% | 28.2% | 7.5% |
| Goshen Town Hall | 1,154 | 838 | 61.5% | 1.8% | 32.9% | 0.4% | $53k | 26.3% | 10.0% | 24.7% | 81.3% | 18.5% | 1.3% |
| Hamilton Cross Rds | 416 | 305 | 74.9% | 10.6% | 12.5% | 0.0% | $46k | 15.7% | 14.8% | 13.6% | 63.8% | 6.6% | 7.1% |
| Henderson Voting Ctr 1 | 277 | 205 | 90.2% | 0.3% | 7.3% | 0.1% | $67k | 12.9% | 16.5% | 16.3% | 84.6% | 23.6% | 0.2% |
| Henderson Voting Ctr 2 | 457 | 340 | 81.1% | 1.2% | 14.1% | 0.4% | $57k | 15.0% | 17.4% | 18.1% | 79.1% | 25.0% | 0.5% |
| Josie Co Bldg | 560 | 439 | 71.0% | 0.0% | 21.9% | 2.6% | $50k | 13.0% | 24.9% | 21.4% | 88.0% | 11.5% | 0.0% |
| Little Oak Co Bldg | 896 | 673 | 65.7% | 2.6% | 25.5% | 0.8% | $43k | 18.4% | 19.2% | 21.4% | 72.2% | 27.8% | 0.7% |
| Meeksville VFD | 1,048 | 846 | 36.7% | 21.0% | 35.3% | 0.0% | $54k | 7.1% | 26.9% | 13.9% | 50.5% | 20.7% | 5.0% |
| Oak Bowery Church | 310 | 273 | 70.9% | 1.4% | 22.6% | 0.0% | $73k | 33.2% | 15.8% | 34.3% | 85.3% | 16.3% | 2.6% |
| Pike Co Courthouse | 3,511 | 2,871 | 52.5% | 1.4% | 42.3% | 0.3% | $60k | 41.4% | 33.6% | 12.5% | 47.7% | 21.2% | 0.5% |
| Rural Home Co Bldg | 644 | 507 | 70.4% | 1.1% | 25.2% | 0.0% | $66k | 30.2% | 11.4% | 27.7% | 86.3% | 15.2% | 2.0% |
| Saco VFD | 79 | 65 | 66.8% | 0.3% | 28.7% | 0.4% | $62k | 20.3% | 16.7% | 21.7% | 91.1% | 14.7% | 0.4% |
| Saco Voting Ctr 2 | 99 | 84 | 60.3% | 0.6% | 34.3% | 0.2% | $68k | 19.0% | 15.9% | 19.9% | 94.6% | 13.6% | 0.7% |
| Springhill Hse Auth | 645 | 468 | 57.6% | 2.0% | 35.2% | 0.7% | $42k | 18.2% | 22.2% | 19.1% | 69.1% | 30.0% | 0.7% |
| Springhill VFD | 577 | 427 | 89.2% | 0.5% | 8.1% | 0.1% | $66k | 13.1% | 16.7% | 16.4% | 83.9% | 23.6% | 0.2% |
| Sweet Pilgram Church | 376 | 250 | 51.0% | 4.5% | 38.5% | 1.1% | $44k | 10.8% | 17.9% | 21.7% | 78.3% | 27.3% | 5.2% |
| Tarentum Comm Club | 1,095 | 854 | 58.9% | 8.8% | 30.6% | 0.3% | $42k | 15.4% | 25.1% | 15.5% | 65.7% | 16.2% | 4.8% |
| Tennille Meth Ch | 393 | 269 | 63.3% | 9.4% | 24.0% | 0.2% | $45k | 13.6% | 13.7% | 16.6% | 67.6% | 16.6% | 7.8% |
| Troy Adams Armory | 5,394 | 5,095 | 55.4% | 1.8% | 31.1% | 7.0% | $36k | 38.6% | 77.3% | 5.2% | 26.0% | 45.7% | 1.2% |
| Troy Public Library | 2,377 | 2,031 | 14.9% | 0.0% | 76.7% | 5.0% | $71k | 30.9% | 42.3% | 10.5% | 42.6% | 21.9% | 0.0% |
| Troy Rec Dept | 3,835 | 3,004 | 63.5% | 2.4% | 30.3% | 1.1% | $55k | 42.2% | 35.1% | 14.3% | 54.3% | 26.8% | 1.7% |
Geneva: 15 precincts
| Precinct | Population | Voting-age pop. | % White non-Hisp. | % Hispanic | % Black | % Asian | Median income* | % Bachelor's+ | % 18-29 (of adults) | % 65+ | % Homeowners | % Below poverty | % Spanish at home (adults) |
|---|---|---|---|---|---|---|---|---|---|---|---|---|---|
| Bellwood-Chancellor | 1,008 | 828 | 77.4% | 0.8% | 19.1% | 0.0% | $66k | 24.4% | 18.2% | 27.3% | 76.3% | 14.1% | 0.7% |
| Black-Kelley Cross Roads | 882 | 658 | 91.0% | 1.4% | 3.3% | 0.0% | $78k | 12.9% | 14.0% | 15.5% | 86.9% | 2.6% | 1.1% |
| Coffee Springs | 493 | 417 | 91.2% | 6.3% | 2.5% | 0.0% | $48k | 15.1% | 10.3% | 20.2% | 91.5% | 25.6% | 5.4% |
| Devco Comm Ctr | 1,130 | 807 | 94.1% | 0.4% | 5.6% | 0.0% | $57k | 4.9% | 3.9% | 17.7% | 93.8% | 24.2% | 0.0% |
| Fadette Comm Ctr | 1,784 | 1,292 | 84.8% | 3.2% | 6.1% | 0.0% | $65k | 7.8% | 8.6% | 17.9% | 86.6% | 11.4% | 1.4% |
| Geneva Courthouse | 3,835 | 3,103 | 75.6% | 3.9% | 12.5% | 4.2% | $53k | 17.2% | 15.2% | 23.5% | 73.5% | 20.6% | 1.9% |
| Gilmore Comm Ctr | 413 | 345 | 94.4% | 1.4% | 1.1% | 0.3% | $58k | 12.4% | 13.6% | 31.9% | 91.7% | 11.1% | 0.1% |
| Hacoda-Flat Creek | 645 | 534 | 92.1% | 3.8% | 0.9% | 0.3% | $58k | 12.1% | 14.2% | 31.2% | 91.1% | 11.0% | 1.5% |
| Hughes Comm Ctr | 2,825 | 2,187 | 78.4% | 2.7% | 8.8% | 0.0% | $52k | 15.3% | 19.4% | 21.0% | 76.5% | 20.5% | 2.8% |
| Hughes Voting House | 2,213 | 1,708 | 69.9% | 6.1% | 15.3% | 0.0% | $58k | 15.3% | 17.3% | 19.8% | 70.9% | 11.9% | 3.0% |
| Lowery-Revels Store | 1,007 | 784 | 73.2% | 21.9% | 0.4% | 0.2% | $58k | 8.9% | 19.0% | 24.9% | 84.4% | 11.1% | 13.0% |
| Lytle Comm Ctr | 1,435 | 1,146 | 83.5% | 2.9% | 11.6% | 0.0% | $50k | 15.3% | 14.1% | 15.3% | 77.1% | 20.4% | 2.1% |
| Malvery Comm Ctr | 3,787 | 2,904 | 86.0% | 5.4% | 3.8% | 0.0% | $56k | 15.0% | 18.0% | 16.4% | 81.2% | 23.4% | 0.5% |
| Piney Grove-Samson | 2,937 | 2,350 | 74.8% | 13.3% | 7.0% | 0.1% | $46k | 7.8% | 15.3% | 20.4% | 67.6% | 25.9% | 7.4% |
| Tate-Slocomb | 2,652 | 2,043 | 80.2% | 3.1% | 10.4% | 0.0% | $46k | 10.8% | 21.5% | 18.6% | 77.5% | 23.1% | 2.4% |
Barbour: 13 precincts
| Precinct | Population | Voting-age pop. | % White non-Hisp. | % Hispanic | % Black | % Asian | Median income* | % Bachelor's+ | % 18-29 (of adults) | % 65+ | % Homeowners | % Below poverty | % Spanish at home (adults) |
|---|---|---|---|---|---|---|---|---|---|---|---|---|---|
| Baker Hill Town Hall | 1,861 | 1,426 | 65.4% | 0.3% | 31.4% | 1.4% | $62k | 11.4% | 14.7% | 25.6% | 84.5% | 24.1% | 1.7% |
| Bevill Ctr | 1,041 | 904 | 61.6% | 0.6% | 37.0% | 0.3% | $62k | 14.5% | 24.1% | 25.2% | 91.5% | 15.5% | 1.5% |
| Blue Springs City Hall | 493 | 405 | 85.3% | 0.1% | 8.1% | 5.5% | $106k | 10.5% | 4.6% | 33.3% | 94.2% | 9.4% | 0.0% |
| Clayton Courthouse | 2,264 | 1,721 | 37.5% | 0.1% | 59.9% | 0.1% | $45k | 10.1% | 13.7% | 24.7% | 68.0% | 24.5% | 2.0% |
| Clio City Hall | 1,262 | 1,085 | 38.3% | 12.9% | 45.3% | 0.2% | $43k | 5.2% | 15.4% | 15.6% | 67.1% | 27.0% | 6.4% |
| Eufaula Comm Ctr | 238 | 180 | 20.8% | 0.5% | 71.6% | 1.5% | $57k | 6.7% | 17.3% | 18.3% | 83.7% | 15.1% | 2.3% |
| Green's Cross VFD | 518 | 475 | 47.0% | 1.8% | 47.1% | 0.1% | $47k | 5.0% | 12.7% | 19.8% | 59.9% | 10.6% | 1.2% |
| Louisville City Hall | 891 | 706 | 52.5% | 5.9% | 32.7% | 0.3% | $55k | 11.8% | 21.6% | 19.4% | 79.8% | 12.6% | 0.1% |
| McCoo/Eufaula WB/Fellowship BC/Sanford | 9,846 | 7,353 | 41.1% | 8.6% | 46.6% | 0.3% | $46k | 14.7% | 24.2% | 19.7% | 57.4% | 21.3% | 7.4% |
| Mt. Andrew Comm Ctr. | 1,330 | 1,282 | 46.5% | 2.0% | 49.0% | 0.0% | $28k | 2.7% | 11.4% | 11.4% | 61.7% | 15.2% | 2.1% |
| Springhill VFD | 1,857 | 1,455 | 30.4% | 1.4% | 62.0% | 1.3% | $56k | 12.2% | 14.4% | 22.2% | 81.6% | 15.0% | 3.0% |
| Sutton/Elamville VFD | 2,425 | 2,093 | 34.0% | 16.1% | 47.5% | 0.0% | $38k | 4.2% | 15.2% | 13.2% | 64.5% | 35.3% | 8.3% |
| Texasville Comm Ctr | 668 | 490 | 57.1% | 1.3% | 36.4% | 3.5% | $72k | 9.9% | 8.3% | 25.7% | 85.2% | 27.3% | 0.2% |
Macon: 14 precincts
| Precinct | Population | Voting-age pop. | % White non-Hisp. | % Hispanic | % Black | % Asian | Median income* | % Bachelor's+ | % 18-29 (of adults) | % 65+ | % Homeowners | % Below poverty | % Spanish at home (adults) |
|---|---|---|---|---|---|---|---|---|---|---|---|---|---|
| Brownville VFD | 687 | 590 | 25.6% | 4.0% | 68.7% | 0.0% | $36k | 11.5% | 5.3% | 27.7% | 87.8% | 19.3% | 2.2% |
| Chisholm Comm Ctr | 439 | 384 | 32.4% | 4.7% | 57.9% | 0.2% | $41k | 14.2% | 8.9% | 27.2% | 82.0% | 19.5% | 1.7% |
| Cotton Valley Rec Ctr | 703 | 625 | 3.9% | 0.0% | 92.4% | 0.0% | $51k | 11.5% | 43.1% | 15.0% | 86.7% | 6.1% | 0.0% |
| District 4 Comm Ctr | 687 | 573 | 47.2% | 0.2% | 49.4% | 0.0% | $55k | 11.7% | 12.1% | 24.6% | 77.5% | 20.6% | 1.7% |
| District 4 Rec Ctr | 1,165 | 1,026 | 22.6% | 1.2% | 72.0% | 0.1% | $69k | 33.5% | 55.8% | 16.9% | 57.5% | 18.6% | 1.2% |
| Franklin Town Hall | 1,922 | 1,674 | 16.6% | 0.2% | 77.1% | 0.0% | $64k | 27.9% | 17.1% | 33.6% | 69.5% | 16.9% | 1.1% |
| Margaret Murray Wash Hall | 2,238 | 2,095 | 34.0% | 2.2% | 62.2% | 0.2% | $51k | 31.8% | 92.3% | 1.8% | 5.5% | 43.3% | 1.8% |
| National Guard Armory | 1,876 | 1,622 | 13.3% | 2.3% | 80.9% | 0.8% | $50k | 32.9% | 41.5% | 18.4% | 46.0% | 22.8% | 1.6% |
| Notasulga Town Hall | 1,414 | 1,191 | 31.8% | 2.7% | 62.1% | 0.0% | $45k | 10.6% | 18.5% | 21.6% | 76.3% | 42.1% | 0.5% |
| Prairie Farms Center | 1,180 | 1,061 | 19.8% | 9.2% | 68.5% | 0.5% | $48k | 14.1% | 10.5% | 42.7% | 87.0% | 14.3% | 6.3% |
| Sojourner Comm Ctr | 2,688 | 2,000 | 2.5% | 0.5% | 93.7% | 0.0% | $32k | 17.8% | 35.8% | 15.6% | 40.7% | 35.0% | 0.2% |
| Tuskegee Municipal Complex | 2,691 | 2,190 | 2.5% | 1.6% | 91.6% | 0.8% | $43k | 30.4% | 21.9% | 22.8% | 51.4% | 25.7% | 2.4% |
| Volunteer Fire Station | 1,012 | 824 | 16.6% | 4.6% | 76.6% | 0.9% | $48k | 16.6% | 25.4% | 23.1% | 68.5% | 10.8% | 0.0% |
| Warrior Dist 2 Rec Ctr | 668 | 539 | 9.7% | 1.8% | 85.2% | 0.0% | $34k | 16.4% | 10.1% | 22.5% | 82.1% | 29.2% | 0.0% |
Butler: 22 precincts
| Precinct | Population | Voting-age pop. | % White non-Hisp. | % Hispanic | % Black | % Asian | Median income* | % Bachelor's+ | % 18-29 (of adults) | % 65+ | % Homeowners | % Below poverty | % Spanish at home (adults) |
|---|---|---|---|---|---|---|---|---|---|---|---|---|---|
| BOILING | 218 | 191 | 84.9% | 0.0% | 13.0% | 0.0% | $41k | 8.6% | 10.1% | 24.6% | 82.7% | 23.3% | 0.0% |
| BUTLER CO HEALTH DEPT | 2,072 | 1,502 | 49.7% | 2.8% | 45.5% | 0.6% | $58k | 19.1% | 18.7% | 18.5% | 61.9% | 24.6% | 3.5% |
| CENTER HILL | 882 | 671 | 70.3% | 1.5% | 24.6% | 0.0% | $48k | 13.2% | 11.6% | 31.7% | 84.3% | 13.0% | 1.4% |
| CENTRAL VFD | 666 | 537 | 51.2% | 2.6% | 45.1% | 0.0% | $57k | 17.2% | 20.9% | 26.7% | 95.3% | 24.7% | 0.0% |
| CHAPMAN POST OFFICE | 402 | 354 | 84.9% | 0.1% | 13.0% | 0.0% | $41k | 9.1% | 9.9% | 25.0% | 82.7% | 22.8% | 0.0% |
| DUNBAR COMM CTR | 2,359 | 1,741 | 18.6% | 3.1% | 77.7% | 0.0% | $36k | 10.5% | 18.0% | 13.0% | 49.0% | 30.6% | 3.9% |
| FOREST HOME | 265 | 236 | 70.3% | 0.0% | 28.3% | 0.0% | $53k | 5.1% | 17.3% | 17.6% | 91.2% | 10.7% | 0.0% |
| FRIENDSHIP SCHOOL HOUSE | 206 | 182 | 67.9% | 5.8% | 19.2% | 0.0% | $55k | 21.9% | 4.3% | 42.4% | 89.4% | 2.8% | 10.3% |
| GARLAND | 791 | 643 | 72.9% | 0.8% | 25.5% | 0.0% | $42k | 13.7% | 14.7% | 27.3% | 75.9% | 13.3% | 0.0% |
| GREENVILLE POLICE DEPT | 3,598 | 2,753 | 39.4% | 1.9% | 50.9% | 6.6% | $48k | 19.8% | 16.2% | 19.3% | 50.8% | 29.9% | 1.7% |
| HARRISON'S | 442 | 367 | 64.6% | 0.1% | 31.5% | 0.0% | $61k | 13.6% | 17.0% | 28.5% | 80.5% | 8.2% | 0.0% |
| INDUSTRY SCHOOL HOUSE | 438 | 316 | 77.5% | 0.3% | 18.2% | 0.0% | $45k | 9.9% | 9.5% | 31.6% | 79.9% | 10.7% | 0.0% |
| MANNINGHAM | 434 | 356 | 60.8% | 0.0% | 38.5% | 0.3% | $61k | 10.9% | 16.9% | 23.6% | 88.9% | 5.3% | 0.0% |
| MCKENZIE CITY HALL | 263 | 195 | 76.8% | 0.4% | 19.5% | 0.0% | $44k | 10.6% | 10.6% | 30.8% | 79.2% | 11.2% | 0.0% |
| MCLAIN'S | 845 | 673 | 63.4% | 0.5% | 34.7% | 0.0% | $49k | 7.3% | 12.8% | 23.1% | 74.2% | 22.4% | 1.0% |
| MIDWAY | 753 | 607 | 51.3% | 2.6% | 45.0% | 0.0% | $57k | 17.2% | 20.9% | 26.7% | 95.3% | 24.7% | 0.0% |
| MONTEREY SCHOOL HOUSE | 114 | 91 | 58.0% | 0.0% | 42.0% | 0.0% | $64k | 12.4% | 17.0% | 25.5% | 88.6% | 3.5% | 0.0% |
| PROVIDENCE | 669 | 550 | 86.0% | 0.4% | 8.4% | 0.0% | $42k | 13.7% | 17.8% | 26.7% | 77.4% | 17.6% | 2.2% |
| ROCKY CREEK | 637 | 513 | 82.0% | 0.0% | 13.6% | 0.0% | $48k | 8.0% | 19.1% | 21.9% | 78.7% | 20.2% | 1.9% |
| SEARCY VFD | 1,001 | 816 | 29.9% | 4.3% | 62.5% | 0.0% | $44k | 8.7% | 22.8% | 22.2% | 43.8% | 28.1% | 3.6% |
| SR MULTI-PURPOSE CTR | 1,608 | 1,229 | 34.0% | 0.1% | 65.4% | 0.0% | $25k | 6.4% | 17.6% | 19.5% | 55.0% | 21.5% | 0.2% |
| STEINER'S STORE | 256 | 218 | 87.6% | 0.0% | 11.0% | 0.0% | $57k | 16.1% | 14.8% | 34.0% | 88.2% | 2.8% | 0.0% |
Henry: 13 precincts
| Precinct | Population | Voting-age pop. | % White non-Hisp. | % Hispanic | % Black | % Asian | Median income* | % Bachelor's+ | % 18-29 (of adults) | % 65+ | % Homeowners | % Below poverty | % Spanish at home (adults) |
|---|---|---|---|---|---|---|---|---|---|---|---|---|---|
| Abbevile Armory | 3,408 | 2,738 | 41.1% | 3.2% | 53.3% | 0.0% | $43k | 16.5% | 13.3% | 31.6% | 69.7% | 25.2% | 1.8% |
| Capps Post Office | 909 | 658 | 49.6% | 5.8% | 38.4% | 0.9% | $54k | 15.0% | 24.4% | 16.8% | 85.9% | 34.4% | 5.9% |
| Douglas Crossroads | 954 | 767 | 96.5% | 0.3% | 3.1% | 0.0% | $69k | 19.8% | 26.9% | 21.2% | 84.3% | 18.9% | 0.0% |
| Edwin Clubhouse | 563 | 440 | 40.3% | 9.0% | 44.1% | 0.0% | $58k | 26.4% | 15.0% | 22.5% | 88.5% | 30.2% | 7.5% |
| Haleburg Hall | 420 | 340 | 92.8% | 0.9% | 5.5% | 0.0% | $60k | 16.5% | 21.1% | 25.3% | 90.3% | 15.8% | 0.1% |
| Headland Armory | 5,954 | 4,454 | 83.9% | 1.3% | 11.9% | 0.0% | $82k | 31.6% | 14.0% | 19.3% | 81.7% | 8.3% | 0.8% |
| Judson Com. | 1,700 | 1,507 | 80.6% | 2.2% | 13.3% | 0.0% | $41k | 13.6% | 4.4% | 25.7% | 65.2% | 24.3% | 1.2% |
| Lawrenceville | 453 | 412 | 53.4% | 7.8% | 33.9% | 0.0% | $62k | 36.1% | 6.3% | 32.7% | 94.4% | 12.2% | 4.7% |
| Newville Vote Hse | 1,365 | 1,095 | 77.9% | 1.0% | 18.1% | 1.1% | $62k | 20.1% | 17.7% | 19.3% | 86.0% | 15.2% | 0.3% |
| Shorterville House | 483 | 422 | 56.1% | 0.1% | 43.7% | 0.0% | $52k | 7.1% | 19.6% | 29.5% | 79.8% | 35.7% | 0.0% |
| Tumbleton Vote Hse | 537 | 428 | 90.1% | 0.5% | 7.8% | 0.7% | $71k | 26.1% | 16.6% | 20.6% | 92.2% | 8.5% | 0.0% |
| Union Voting House | 640 | 542 | 69.7% | 1.2% | 28.0% | 0.0% | $53k | 11.6% | 13.4% | 31.2% | 90.5% | 20.6% | 0.1% |
| Wills Cross Roads | 449 | 392 | 55.7% | 0.3% | 43.7% | 0.0% | $52k | 7.1% | 19.2% | 29.3% | 79.5% | 35.4% | 0.1% |
Crenshaw: 18 precincts
| Precinct | Population | Voting-age pop. | % White non-Hisp. | % Hispanic | % Black | % Asian | Median income* | % Bachelor's+ | % 18-29 (of adults) | % 65+ | % Homeowners | % Below poverty | % Spanish at home (adults) |
|---|---|---|---|---|---|---|---|---|---|---|---|---|---|
| Brantley Comm Ctr | 541 | 409 | 73.3% | 1.4% | 21.1% | 1.3% | $32k | 30.2% | 19.6% | 20.0% | 67.1% | 22.7% | 4.2% |
| Bush's Grocery | 581 | 431 | 61.2% | 1.8% | 28.0% | 0.0% | $40k | 18.8% | 15.1% | 20.4% | 57.0% | 16.6% | 0.6% |
| Chapel Hill Comm Ctr | 683 | 512 | 85.7% | 0.0% | 12.5% | 0.0% | $46k | 14.7% | 17.1% | 25.2% | 91.1% | 15.6% | 0.0% |
| County Courthouse | 570 | 474 | 66.6% | 3.4% | 26.6% | 0.4% | $47k | 17.2% | 12.8% | 22.8% | 55.2% | 21.0% | 4.3% |
| Danielsville School | 819 | 612 | 86.5% | 5.2% | 1.6% | 0.0% | $61k | 25.2% | 32.0% | 16.0% | 94.6% | 16.1% | 0.8% |
| Dozier City Hall | 151 | 112 | 62.2% | 1.7% | 27.1% | 0.0% | $40k | 19.2% | 15.1% | 20.4% | 58.0% | 16.5% | 0.6% |
| Glenwood City Hall | 735 | 585 | 62.1% | 6.6% | 27.0% | 0.0% | $51k | 20.3% | 22.6% | 11.2% | 48.6% | 26.6% | 11.0% |
| Harbin Farm Ctr | 624 | 481 | 64.8% | 1.2% | 30.7% | 1.5% | $62k | 15.0% | 4.0% | 28.4% | 66.4% | 20.1% | 1.0% |
| Highland Home VFD | 1,061 | 802 | 73.4% | 4.1% | 17.7% | 0.0% | $59k | 23.7% | 31.0% | 14.4% | 90.3% | 18.8% | 0.4% |
| Honoraville VFD | 1,507 | 1,131 | 75.1% | 2.1% | 20.1% | 0.0% | $52k | 17.3% | 21.6% | 19.9% | 87.9% | 16.1% | 0.5% |
| Lillery Store | 831 | 711 | 61.5% | 0.4% | 35.0% | 0.0% | $59k | 21.8% | 10.7% | 23.6% | 70.6% | 9.6% | 0.1% |
| Panola Comm Ctr | 591 | 436 | 85.9% | 1.6% | 10.5% | 0.0% | $57k | 16.2% | 27.3% | 13.7% | 92.7% | 14.6% | 0.2% |
| Patsburg Depot Bldg | 630 | 477 | 55.4% | 3.1% | 38.3% | 0.2% | $59k | 7.2% | 6.4% | 17.8% | 78.2% | 8.1% | 2.0% |
| Petrey Comm Ctr | 1,177 | 931 | 49.6% | 2.1% | 42.9% | 0.2% | $51k | 13.5% | 16.1% | 15.9% | 86.9% | 18.3% | 0.0% |
| Pleasant Home School | 722 | 543 | 66.5% | 1.3% | 24.0% | 0.0% | $45k | 17.6% | 12.3% | 21.1% | 57.9% | 17.4% | 0.4% |
| Rutledge Comm Ctr | 319 | 238 | 85.3% | 0.1% | 8.2% | 0.0% | $57k | 12.6% | 5.8% | 23.0% | 62.1% | 21.1% | 0.1% |
| Vidette Comm Ctr | 859 | 717 | 70.5% | 1.3% | 24.7% | 1.1% | $35k | 13.9% | 4.8% | 33.0% | 56.2% | 22.5% | 0.0% |
| Weeds Store | 870 | 649 | 76.9% | 0.0% | 19.1% | 1.6% | $27k | 33.6% | 19.0% | 22.2% | 72.5% | 22.0% | 2.5% |
Bullock: 15 precincts
| Precinct | Population | Voting-age pop. | % White non-Hisp. | % Hispanic | % Black | % Asian | Median income* | % Bachelor's+ | % 18-29 (of adults) | % 65+ | % Homeowners | % Below poverty | % Spanish at home (adults) |
|---|---|---|---|---|---|---|---|---|---|---|---|---|---|
| Aberfoil | 261 | 207 | 54.9% | 0.2% | 44.1% | 0.0% | $52k | 11.3% | 20.9% | 14.5% | 75.6% | 25.2% | 0.1% |
| Corinth | 229 | 177 | 39.4% | 0.0% | 60.6% | 0.0% | 7.1% | 20.6% | 15.5% | 55.7% | 40.8% | 0.0% | |
| Cornerstone | 450 | 407 | 32.9% | 6.8% | 55.9% | 1.4% | $37k | 7.6% | 14.0% | 30.1% | 76.4% | 18.9% | 4.7% |
| Fitzpatrick | 265 | 252 | 38.7% | 0.1% | 56.2% | 0.0% | $48k | 6.3% | 13.6% | 36.1% | 82.2% | 14.2% | 0.0% |
| Guerryton | 484 | 404 | 12.9% | 0.5% | 83.3% | 0.0% | $45k | 9.5% | 28.6% | 18.7% | 73.9% | 23.5% | 0.1% |
| Indian Creek | 393 | 306 | 15.3% | 4.3% | 79.1% | 0.0% | $38k | 8.0% | 22.7% | 20.7% | 66.5% | 28.0% | 2.0% |
| Inverness | 163 | 131 | 59.0% | 0.0% | 39.9% | 0.0% | $53k | 12.2% | 21.1% | 14.2% | 80.1% | 21.7% | 0.0% |
| Midway | 597 | 497 | 12.7% | 0.4% | 83.7% | 0.0% | $45k | 9.8% | 29.1% | 19.0% | 74.1% | 23.1% | 0.0% |
| Peachburg | 1,378 | 1,215 | 21.6% | 5.1% | 68.1% | 0.0% | $18k | 3.1% | 11.2% | 11.3% | 63.8% | 47.8% | 2.8% |
| Perote | 449 | 348 | 38.2% | 0.0% | 61.7% | 0.0% | $45k | 7.2% | 21.1% | 15.7% | 56.5% | 39.9% | 0.0% |
| Post Oak | 389 | 320 | 72.8% | 0.0% | 25.2% | 0.0% | $53k | 15.5% | 21.3% | 13.3% | 96.6% | 8.0% | 0.0% |
| Sardis | 131 | 109 | 50.2% | 7.8% | 39.3% | 1.6% | $37k | 13.0% | 18.3% | 16.9% | 82.2% | 16.2% | 5.9% |
| Thompson | 406 | 340 | 20.2% | 18.0% | 58.1% | 3.7% | $20k | 9.5% | 14.3% | 21.9% | 66.2% | 27.2% | 13.5% |
| Three Notch | 231 | 191 | 12.2% | 0.9% | 83.8% | 0.0% | $44k | 9.6% | 28.7% | 19.3% | 73.7% | 23.3% | 0.2% |
| Union Springs Armory | 4,341 | 3,177 | 10.0% | 9.2% | 76.7% | 0.4% | $28k | 8.6% | 19.1% | 19.3% | 58.6% | 41.5% | 7.2% |
Lowndes: 12 precincts
| Precinct | Population | Voting-age pop. | % White non-Hisp. | % Hispanic | % Black | % Asian | Median income* | % Bachelor's+ | % 18-29 (of adults) | % 65+ | % Homeowners | % Below poverty | % Spanish at home (adults) |
|---|---|---|---|---|---|---|---|---|---|---|---|---|---|
| Bethel Church | 1,197 | 1,004 | 6.1% | 0.0% | 91.9% | 0.0% | $32k | 6.5% | 21.6% | 20.5% | 72.8% | 32.4% | 5.0% |
| Burkville VFD | 413 | 346 | 58.8% | 0.1% | 41.1% | 0.0% | $66k | 39.3% | 16.6% | 31.3% | 96.8% | 9.4% | 0.0% |
| Fort Deposit Armory | 761 | 580 | 28.4% | 0.0% | 69.0% | 0.0% | $31k | 16.2% | 24.5% | 22.4% | 79.2% | 36.6% | 0.0% |
| Hayneville Courthouse | 497 | 410 | 45.6% | 0.4% | 53.5% | 0.0% | $56k | 21.9% | 12.2% | 25.7% | 86.9% | 15.6% | 0.3% |
| Lily Baptist Church | 1,420 | 1,112 | 34.2% | 0.9% | 64.2% | 0.0% | $41k | 13.6% | 11.6% | 17.5% | 73.8% | 21.2% | 0.3% |
| Lowndes City Dev Office | 351 | 277 | 52.0% | 0.2% | 47.8% | 0.0% | $37k | 16.0% | 12.3% | 21.2% | 95.6% | 12.1% | 0.0% |
| Lowndesboro CME Ch | 493 | 440 | 58.8% | 0.3% | 40.9% | 0.0% | $63k | 20.0% | 7.9% | 32.5% | 96.0% | 7.9% | 0.0% |
| Mosses Town Hall | 1,267 | 870 | 1.0% | 0.0% | 97.2% | 0.0% | $28k | 5.7% | 25.6% | 17.3% | 63.5% | 45.2% | 4.7% |
| New Hope Church | 824 | 603 | 0.6% | 0.0% | 99.4% | 0.0% | $20k | 7.2% | 20.7% | 16.6% | 61.8% | 50.4% | 0.0% |
| New Salem Church | 612 | 489 | 12.4% | 0.0% | 85.3% | 0.0% | $47k | 13.4% | 8.9% | 17.2% | 64.5% | 35.2% | 0.0% |
| Sandy Ridge Comm Ctr | 1,140 | 892 | 45.4% | 0.0% | 51.8% | 0.0% | $38k | 19.2% | 22.2% | 24.1% | 90.8% | 24.2% | 0.0% |
| White Hall Town Hall | 898 | 684 | 12.2% | 0.1% | 86.9% | 0.0% | $45k | 15.4% | 18.6% | 15.3% | 77.8% | 33.1% | 1.8% |
Covington: 3 precincts
| Precinct | Population | Voting-age pop. | % White non-Hisp. | % Hispanic | % Black | % Asian | Median income* | % Bachelor's+ | % 18-29 (of adults) | % 65+ | % Homeowners | % Below poverty | % Spanish at home (adults) |
|---|---|---|---|---|---|---|---|---|---|---|---|---|---|
| Opp Sr Center (part) | 2,354 | 1,816 | 78.9% | 1.1% | 15.8% | 0.0% | $44k | 10.4% | 16.6% | 23.0% | 71.8% | 25.5% | 0.4% |
| Rose Hill Comm Ctr | 912 | 676 | 93.2% | 0.0% | 1.3% | 0.0% | $78k | 25.8% | 10.3% | 20.6% | 95.1% | 7.6% | 0.0% |
| Union Grove FD | 951 | 839 | 88.9% | 0.0% | 5.6% | 0.0% | $38k | 6.9% | 24.1% | 19.3% | 75.0% | 17.5% | 1.0% |
*Median income is approximate (see note above). ACS 2020-2024 5-year.
Nonpartisan voter information. GOTV Polling does not endorse any candidate.