FIELDING NOW:IA U.S. SENATE; GUBERNATORIAL; IA-01 · IA-02 · IA-03 · IA-04 & MOREVIEW REAL TIME RESULTS
Races / Iowa / IA-01

Paid for and Authorized by Results PAC

Fielding closed

Sponsored by: Results PAC

Iowa U.S. House (IA-01) - Midterms - GOTV Poll

245 respondents for IA-01 · MOE ±6.3 pts · Fielding since October 30, 2026 · Text-to-web · Weighted to 2024 recalled vote · Updated Nov 3, 2026, 2:32 AM PT · Release as of November 4, 2026, 9:12 AM PT · Pollster: GOTV Polling · General election: Tuesday, November 3, 2026

Prompt for AI to Analyze Poll

Select the text below and paste it into your AI assistant, or open it as a text file.

Post on X
Copy Link

District map: past elections, early vote and census data

Choose a layer, then select a precinct to see past results and census data for that precinct. GOTV poll results are published as statewide and district totals only.

R+30 or moreR+15-30R+5-15R+0-5D+0-5D+5-15D+15-30D+30 or moreno dataMargin = (Kamala D. Harris and Tim Walz minus Donald J. Trump and JD Vance) / all votes, by precinct.
R+30 or moreR+15-30R+5-15R+0-5D+0-5D+5-15D+15-30D+30 or moreno dataMargin = (Deidre DeJear and Eric Van Lancker minus Kim Reynolds and Adam Gregg) / all votes, by precinct.
R+30 or moreR+15-30R+5-15R+0-5D+0-5D+5-15D+15-30D+30 or moreno dataMargin = (Joseph R. Biden and Kamala D. Harris minus Donald J. Trump and Michael R. Pence) / all votes, by precinct.
<5%5-15%15-30%30-50%50-70%70%+no data
<2%2-5%5-10%10-20%20-40%40%+no data
<$40k$40-60k$60-80k$80-100k$100-140k$140k+no data
<15%15-25%25-35%35-50%50-65%65%+no data
<10%10-15%15-20%20-25%25-30%30%+no data
<5%5-15%15-30%30-50%50-70%70%+no data
KE2A | 24P R+14.9 | 22 R+9.0 | Hisp 0.4% Blk 2.5% Inc $36kKE4 | 24P R+25.1 | 22 R+24.7 | Hisp 8.6% Blk 1.7% Inc $58kKE1 | 24P R+16.9 | 22 R+14.6 | Hisp 2.6% Blk 3.9% Inc $60kKE3 | 24P R+15.8 | 22 R+5.5 | Hisp 5.7% Blk 1.8% Inc $51kKE5 | 24P R+27.9 | 22 R+23.5 | Hisp 0.3% Blk 3.6% Inc $58kKE6 | 24P R+14.1 | 22 R+8.7 | Hisp 0.0% Blk 9.2% Inc $44kKE7 | 24P R+20.4 | 22 R+25.6 | Hisp 9.7% Blk 2.1% Inc $63kEAST MONTROSE | Hisp 0.3% Blk 0.9% Inc $61kFM5/Madison Twp/JF Twp | Hisp 6.2% Blk 2.2% Inc $32kDES MOINES JACKSON | Hisp 2.2% Blk 0.1% Inc $88kJEFFERSON WEST MONTROSE | Hisp 4.5% Blk 3.6% Inc $53kCEDAR CHARLESTON HARRISON VAN BUREN | Hisp 2.2% Blk 0.5% Inc $82kMARION FRANKLIN | 24P R+42.9 | Hisp 0.2% Blk 1.3% Inc $76kPrecinct 8 | 24P R+47.7 | 22 R+48.9 | Hisp 2.5% Blk 0.4% Inc $80kPrecinct 3 | 24P R+45.3 | 22 R+50.2 | Hisp 6.8% Blk 1.2% Inc $64kPrecinct 7-MP4 | 24P R+25.4 | 22 R+35.7 | Hisp 7.4% Blk 9.8% Inc $92kPrecinct 6-MP3 | 24P R+19.6 | 22 R+25.7 | Hisp 6.6% Blk 2.4% Inc $46kPrecinct 4-MP1 | 24P R+26.4 | 22 R+31.1 | Hisp 8.0% Blk 3.7% Inc $59kPrecinct 5-MP2 | 24P R+22.0 | 22 R+24.3 | Hisp 9.9% Blk 4.5% Inc $63kFM 4A | 24P R+14.2 | 22 R+7.7 | Hisp 5.1% Blk 0.8% Inc $47kFM 2 | 24P R+15.9 | 22 R+7.1 | Hisp 5.2% Blk 1.4% Inc $50kFM 3 | 24P R+4.3 | 22 D+2.1 | Hisp 5.2% Blk 0.9% Inc $54kFM4B | 24P R+16.8 | 22 R+20.9 | Hisp 2.6% Blk 0.0% Inc $50kFM 1 | 24P R+6.4 | 22 R+4.1 | Hisp 2.5% Blk 7.4% Inc $68kWASHINGTON | 22 R+39.3 | Hisp 2.2% Blk 4.0% Inc $89kWEST POINT | Hisp 0.2% Blk 1.0% Inc $82kGREEN BAY DENMARK PLEASANT RIDGE | Hisp 2.6% Blk 0.0% Inc $90kConcordia Twp | 24P R+17.0 | 22 R+25.9 | Hisp 0.0% Blk 0.8% Inc $85kUnion Twp | 24P R+33.3 | 22 R+35.2 | 20P R+27.5 | Hisp 0.1% Blk 3.9% Inc $73kPCT 8 | 24P R+0.6 | 22 R+6.2 | Hisp 9.3% Blk 1.9% Inc $66kPCT 7 | 24P R+5.2 | 22 R+0.8 | 20P D+5.0 | Hisp 5.8% Blk 9.6% Inc $56kPCT 4 | 24P R+3.3 | 22 R+13.4 | 20P D+13.1 | Hisp 1.5% Blk 10.0% Inc $74kPCT 6 | 24P D+11.2 | 22 D+16.3 | Hisp 2.1% Blk 12.6% Inc $55kPCT 5 | 24P D+5.8 | 22 D+6.3 | Hisp 3.6% Blk 14.7% Inc $57kPCT 3 | 24P D+1.1 | 22 R+2.6 | Hisp 3.0% Blk 8.8% Inc $34kWest Burlington Town | Hisp 1.9% Blk 3.7% Inc $57kPCT 2 | 24P D+6.0 | 22 D+4.3 | Hisp 11.6% Blk 0.3% Inc $62kPCT 1 | 24P R+9.2 | 22 R+16.6 | Hisp 1.2% Blk 1.0% Inc $65kDanville Town / Danville Twp | Hisp 1.4% Blk 0.3% Inc $96kFlint River Twp / Middletown | Hisp 1.2% Blk 0.9% Inc $64kTama Twp | 24P R+40.0 | 22 R+48.5 | Hisp 1.3% Blk 0.6% Inc $83kPrecinct 9 | 24P R+33.8 | 22 R+35.2 | Hisp 3.4% Blk 2.0% Inc $68kBenton / Huron / Jackson Twps | Hisp 3.5% Blk 0.2% Inc $95kMediapolis Town / Franklin & Yellow Spri | Hisp 2.9% Blk 0.8% Inc $80kPleasant Grove / Washington Twps | Hisp 1.7% Blk 0.0% Inc $104kMorningsun Marshall | 24P R+55.0 | 22 R+52.4 | 20P R+48.4 | Hisp 1.5% Blk 0.0% Inc $71kSoutheast Louisa | 24P R+44.9 | 22 R+49.1 | 20P R+38.8 | Hisp 5.6% Blk 0.3% Inc $76kGrandview Port Louisa | 24P R+44.4 | 22 R+49.6 | 20P R+37.6 | Hisp 5.9% Blk 0.1% Inc $79kColumbus Jct City | Hisp 40.1% Blk 4.3% Inc $64kWest Louisa | 24P R+40.5 | 22 R+54.2 | 20P R+33.5 | Hisp 31.8% Blk 1.6% Inc $87kFruitland 1 | 24P R+49.8 | 22 R+44.9 | Hisp 10.8% Blk 0.0% Inc $88kSeventy Six/Cedar | Hisp 13.0% Blk 0.0% Inc $94kOrono | 24P R+32.9 | 22 R+44.6 | Hisp 13.0% Blk 0.0% Inc $86kMuscatine 8 | 24P R+24.7 | Hisp 17.8% Blk 4.4% Inc $58kMuscatine 7 | 24P R+11.1 | Hisp 28.9% Blk 1.8% Inc $54kMuscatine 4 | 24P D+15.5 | Hisp 25.2% Blk 8.1% Inc $44kMuscatine 3 | 24P R+0.6 | Hisp 22.9% Blk 2.9% Inc $84kMuscatine 2 | 24P R+8.3 | Hisp 18.0% Blk 1.8% Inc $58kMuscatine 10 | 24P R+8.3 | Hisp 25.5% Blk 0.3% Inc $61kPrecinct 2 | 24P R+38.2 | 22 R+52.6 | Hisp 4.5% Blk 0.3% Inc $62kPrecinct 1 | 24P R+47.2 | 22 R+49.3 | Hisp 2.9% Blk 1.0% Inc $79kAinsworth | 24P R+42.9 | 22 R+49.4 | Hisp 10.0% Blk 0.2% Inc $94kWard 2 | 24P R+27.5 | 22 R+32.4 | Hisp 11.3% Blk 1.4% Inc $70kRiverside | 24P R+10.1 | 22 R+14.5 | Hisp 5.7% Blk 0.6% Inc $97kFR/LN/LT | 24P R+6.9 | 22 R+12.6 | 20P R+6.8 | Hisp 5.4% Blk 0.2% Inc $94kHS/LB/PV | 24P D+10.0 | 22 D+3.9 | 20P D+7.3 | Hisp 2.6% Blk 1.9% Inc $84kSN | 24P R+25.2 | 22 R+32.0 | 20P R+22.3 | Hisp 0.0% Blk 2.4% Inc $80kIC.10/ELSW | 24P D+40.1 | 22 D+42.7 | 20P D+47.5 | Hisp 13.6% Blk 17.3% Inc $63kWL | 24P D+28.5 | 22 D+27.6 | 20P D+37.3 | Hisp 17.6% Blk 6.4% Inc $55kMuscatine 5 | 24P R+3.3 | Hisp 30.8% Blk 3.7% Inc $49kMuscatine 1 | 24P R+4.6 | Hisp 10.7% Blk 10.2% Inc $55kBloomington/FRUITLAND 2 | 24P R+23.2 | Hisp 5.8% Blk 1.0% Inc $93kMuscatine 6 | 24P R+4.9 | Hisp 6.9% Blk 2.1% Inc $90kMuscatine 9 | 24P R+6.6 | Hisp 19.4% Blk 1.7% Inc $55kLAKE | 24P R+41.5 | 22 R+44.8 | Hisp 10.8% Blk 0.0% Inc $73kPike | 24P R+36.9 | 22 R+47.2 | Hisp 12.0% Blk 0.0% Inc $60kSweetland | 24P R+34.5 | 22 R+37.5 | Hisp 14.4% Blk 0.5% Inc $82kFulton/Montpelier | Hisp 3.0% Blk 0.0% Inc $104kMOSCOW | 24P R+49.9 | 22 R+58.8 | Hisp 3.8% Blk 0.5% Inc $97kBuffalo City | 24P R+30.4 | 22 R+37.0 | Hisp 4.2% Blk 0.2% Inc $108kBuffalo Twp | 24P R+37.7 | 22 R+45.0 | Hisp 5.9% Blk 0.3% Inc $112kDavenport City D14 | 24P R+8.9 | 22 R+3.2 | Hisp 13.0% Blk 2.5% Inc $57kDavenport City D33 | 24P D+27.3 | 22 D+30.3 | Hisp 10.6% Blk 15.1% Inc $36kDavenport City D13 | 24P R+9.2 | 22 R+18.7 | Hisp 14.4% Blk 8.3% Inc $84kDavenport City D34 | 24P D+35.3 | 22 D+44.3 | Hisp 20.9% Blk 23.8% Inc $43kDavenport City D31 | 24P D+5.0 | 22 D+5.6 | Hisp 16.6% Blk 10.6% Inc $59kDavenport City D12 | 24P D+3.5 | 22 D+3.8 | Hisp 7.6% Blk 13.8% Inc $61kDavenport City D32 | 24P D+29.5 | 22 D+26.3 | Hisp 17.3% Blk 16.1% Inc $32kDavenport City D54 | 24P D+30.9 | 22 D+26.7 | Hisp 8.5% Blk 14.5% Inc $101kBettendorf City B12 | 24P R+2.7 | 22 R+10.3 | Hisp 5.6% Blk 6.2% Inc $76kBettendorf City B11 | 24P D+0.9 | 22 R+6.5 | Hisp 4.8% Blk 4.8% Inc $74kDavenport City D41 | 24P D+3.3 | 22 D+0.1 | Hisp 8.9% Blk 9.0% Inc $70kBettendorf City B32 | 24P R+2.3 | 22 R+9.9 | Hisp 2.7% Blk 2.6% Inc $82kRiverdale | 24P R+26.7 | 22 R+28.7 | Hisp 0.7% Blk 1.3% Inc $154kBettendorf City B13 | 24P D+3.5 | 22 D+6.3 | Hisp 3.7% Blk 0.4% Inc $72kDavenport City D44 | 24P D+12.0 | 22 D+13.1 | Hisp 8.6% Blk 16.9% Inc $62kBettendorf City B31 | 24P D+3.7 | 22 R+5.7 | Hisp 1.7% Blk 5.9% Inc $91kDavenport City D52 | 24P D+32.0 | 22 D+29.8 | Hisp 6.8% Blk 14.8% Inc $58kDavenport City D42 | 24P D+6.4 | 22 D+3.1 | Hisp 9.9% Blk 9.6% Inc $64kSouthwest Pct | 24P R+61.8 | 22 R+65.7 | Hisp 1.8% Blk 0.0% Inc $64kDes Moines Liberty | 24P R+58.7 | 22 R+72.8 | 20P R+54.9 | Hisp 1.5% Blk 0.5% Inc $76kEast Pct | 24P R+49.3 | 22 R+52.6 | Hisp 1.4% Blk 0.9% Inc $65kCentral Pct | 24P R+46.9 | 22 R+46.7 | Hisp 2.0% Blk 0.5% Inc $56kNorth Pct | 24P R+64.5 | 22 R+67.7 | Hisp 2.0% Blk 0.3% Inc $58kCenter Cedar Round Prairie | 24P R+11.1 | 22 R+7.3 | Hisp 4.2% Blk 1.3% Inc $65kFairfield 5 | 22 R+9.4 | Hisp 5.7% Blk 2.3% Inc $67kFairfield 4 | Hisp 8.6% Blk 6.4% Inc $46kFairfield 1 | Hisp 2.1% Blk 2.6% Inc $60kFairfield 3 | 22 D+1.3 | Hisp 9.5% Blk 4.0% Inc $41kFairfield 2 | 22 D+60.4 | Hisp 4.8% Blk 6.9% Inc $34kBuchanan | 24P R+35.0 | 22 R+33.7 | 20P R+27.1 | Hisp 4.1% Blk 3.4% Inc $56kLocust Grove | 24P R+55.1 | 22 R+53.2 | 20P R+45.2 | Hisp 0.2% Blk 0.3% Inc $62kBlackhawk Polk | 24P R+54.6 | 22 R+60.9 | 20P R+49.0 | Hisp 0.0% Blk 0.1% Inc $57kJA-RL | 24P R+59.1 | 22 R+60.8 | Hisp 3.0% Blk 0.0% Inc $72kBN-SR | 24P R+58.9 | 22 R+59.8 | Hisp 1.2% Blk 0.0% Inc $71kEL-WL-WN | 24P R+61.1 | 22 R+65.7 | Hisp 3.2% Blk 0.9% Inc $58kSG3 | 24P R+34.7 | 22 R+57.2 | Hisp 0.0% Blk 0.2% Inc $51kSG4 | 24P R+39.7 | 22 R+36.1 | Hisp 0.0% Blk 0.8% Inc $69kLockridge | 24P R+57.9 | 22 R+71.9 | Hisp 1.0% Blk 0.0% Inc $73kWalnut Penn | 24P R+48.1 | 22 R+58.0 | Hisp 0.2% Blk 0.0% Inc $62kWard 3 | 24P R+17.2 | 22 R+22.2 | Hisp 4.9% Blk 1.2% Inc $66kBrighton | 24P R+47.8 | 22 R+59.0 | Hisp 1.9% Blk 0.6% Inc $82kWard 4 | 24P R+13.5 | 22 R+25.4 | Hisp 16.2% Blk 1.2% Inc $55kLF-CC | 24P R+47.7 | 22 R+52.2 | Hisp 2.1% Blk 0.0% Inc $70kWard 1 | 24P R+17.4 | 22 R+28.7 | Hisp 17.4% Blk 1.1% Inc $59kWellman | 24P R+36.5 | 22 R+39.1 | Hisp 2.9% Blk 0.3% Inc $66kRichmond | 24P R+38.6 | 22 R+47.4 | Hisp 3.6% Blk 2.5% Inc $102kKalona | 24P R+17.0 | 22 R+23.3 | Hisp 3.0% Blk 1.1% Inc $88kSG2 | 24P R+45.4 | 22 R+38.6 | Hisp 0.0% Blk 0.2% Inc $51kSG1 | 24P R+42.3 | 22 R+46.3 | Hisp 0.0% Blk 0.9% Inc $70kSG-PL-VB | 24P R+60.7 | 22 R+71.5 | Hisp 0.5% Blk 0.4% Inc $64kAD-PR-WS | 24P R+52.1 | 22 R+53.3 | Hisp 3.3% Blk 0.3% Inc $59kER-LB | 24P R+41.9 | 22 R+46.9 | Hisp 7.4% Blk 0.4% Inc $66kEnglish 2 | 24P R+27.2 | 22 R+34.9 | 20P R+22.1 | Hisp 11.9% Blk 0.1% Inc $50kDayton English 1 | 24P R+36.3 | 22 R+47.5 | 20P R+41.2 | Hisp 1.9% Blk 1.4% Inc $80kHartford 2 Lincoln | 24P R+46.7 | 22 R+54.9 | 20P R+47.1 | Hisp 0.5% Blk 0.4% Inc $76kHartford 1 Sumner | 24P R+51.9 | 22 R+60.1 | 20P R+51.2 | Hisp 0.9% Blk 0.1% Inc $71kFillmore Greene | 24P R+34.2 | 22 R+36.5 | 20P R+24.6 | Hisp 6.5% Blk 0.3% Inc $79kWS | 24P R+20.7 | 22 R+30.1 | 20P R+16.7 | Hisp 0.0% Blk 2.2% Inc $83kUN | 24P D+9.5 | 22 R+1.3 | 20P D+13.4 | Hisp 6.0% Blk 2.5% Inc $134kHD | 24P R+3.1 | 22 R+17.7 | 20P R+1.9 | Hisp 0.0% Blk 10.9% Inc $92kPilot Troy York | 24P R+44.2 | 22 R+54.9 | 20P R+44.0 | Hisp 6.8% Blk 0.2% Inc $65kWilliamsburg City | 24P R+14.9 | 22 R+20.3 | 20P R+8.8 | Hisp 7.9% Blk 0.0% Inc $57kTF.01/CC | 24P D+13.7 | 22 D+16.0 | 20P D+22.1 | Hisp 2.9% Blk 3.4% Inc $108kTF.02 | 24P D+15.2 | 22 D+16.2 | Hisp 5.8% Blk 4.6% Inc $120kOX | 24P R+6.3 | 22 R+9.0 | 20P D+2.0 | Hisp 2.8% Blk 9.5% Inc $71kMD | Hisp 6.1% Blk 1.9% Inc $122kCV.05 | 24P D+54.4 | 22 D+57.4 | 20P D+57.8 | Hisp 9.6% Blk 31.8% Inc $57kCV.02 | 24P D+39.7 | 22 D+37.4 | 20P D+42.6 | Hisp 4.7% Blk 1.5% Inc $123kCV.07 | 24P D+47.7 | 22 D+44.6 | Hisp 3.7% Blk 13.4% Inc $104kCV.03 | 24P D+38.1 | 22 D+39.7 | 20P D+42.7 | Hisp 3.1% Blk 8.7% Inc $83kCV.06 | 24P D+45.2 | 22 D+39.6 | Hisp 5.3% Blk 1.1% Inc $167kNP | 24P D+18.3 | 22 D+12.9 | 20P D+20.4 | Hisp 0.5% Blk 0.6% Inc $167kNL.04 | 24P D+39.2 | 22 D+43.2 | 20P D+41.0 | Hisp 7.3% Blk 6.0% Inc $98kNL.07/MD.85 | 24P D+29.5 | 22 D+28.2 | Hisp 4.4% Blk 4.7% Inc $113kNL.02 | 24P D+28.1 | 22 D+26.4 | Hisp 2.9% Blk 3.0% Inc $161kLenox Iowa | 24P R+14.2 | 22 R+23.4 | 20P R+15.8 | Hisp 0.5% Blk 0.0% Inc $98kHilton Washington | 24P R+32.4 | 22 R+46.2 | 20P R+27.4 | Hisp 0.7% Blk 0.5% Inc $74kJW/MN/SW | 24P R+7.4 | 22 R+11.2 | 20P D+0.3 | Hisp 3.2% Blk 1.3% Inc $122kDavenport City D43 | 24P D+11.3 | 22 D+7.9 | Hisp 7.9% Blk 7.4% Inc $80kDavenport City D53 | 24P D+18.8 | 22 D+16.0 | Hisp 5.7% Blk 13.6% Inc $62kDavenport City D11 | 24P R+0.2 | 22 R+2.8 | Hisp 10.3% Blk 10.4% Inc $84kDavenport City D64 | 24P D+16.2 | 22 D+8.9 | Hisp 4.2% Blk 0.0% Inc $106kBlue Grass | 24P R+33.9 | 22 R+41.0 | Hisp 5.1% Blk 0.5% Inc $99kBettendorf City B21 | 24P R+2.2 | 22 R+8.3 | Hisp 10.0% Blk 4.2% Inc $79kDavenport City D51 | 24P D+17.1 | 22 D+20.7 | Hisp 6.4% Blk 2.2% Inc $76kBettendorf City B23 | 24P D+6.9 | 22 R+8.4 | Hisp 6.1% Blk 2.6% Inc $52kDavenport City D24 | 24P D+3.7 | 22 D+1.1 | Hisp 2.1% Blk 14.7% Inc $66kDavenport City D72 | 24P D+11.7 | 22 D+11.8 | Hisp 14.6% Blk 2.5% Inc $65kBettendorf City B51 | 24P R+12.0 | 22 R+22.3 | Hisp 5.2% Blk 1.1% Inc $143kBettendorf City B33 | 24P D+3.7 | 22 R+7.4 | Hisp 4.6% Blk 4.8% Inc $112kBettendorf City B22 | 24P R+8.8 | 22 R+16.4 | Hisp 10.3% Blk 1.1% Inc $106kDavenport City D63 | 24P D+8.3 | 22 D+2.3 | Hisp 7.4% Blk 9.6% Inc $83kDavenport City D74 | 24P D+14.6 | 22 D+13.0 | Hisp 6.3% Blk 12.8% Inc $52kDavenport City D62 | 24P R+0.9 | 22 R+14.8 | Hisp 10.0% Blk 8.5% Inc $81kBettendorf City B41 | 24P D+2.1 | 22 R+6.9 | Hisp 7.4% Blk 1.8% Inc $109kDavenport City D23 | 24P D+1.7 | 22 R+5.9 | Hisp 2.9% Blk 21.5% Inc $59kDavenport City D71 | 24P D+8.5 | 22 D+1.3 | Hisp 8.1% Blk 2.9% Inc $86kDavenport City D73 | 24P D+8.9 | 22 D+4.1 | Hisp 8.8% Blk 6.9% Inc $75kBettendorf City B43 | 24P R+7.9 | 22 R+17.8 | Hisp 1.4% Blk 0.5% Inc $134kDavenport City D22 | 24P R+9.5 | 22 R+14.7 | Hisp 6.7% Blk 10.5% Inc $78kPleasant Valley Twp | 24P R+33.2 | 22 R+43.8 | Hisp 0.9% Blk 1.8% Inc $170kBettendorf City B52 | 24P R+20.9 | 22 R+31.4 | Hisp 3.6% Blk 0.1% Inc $184kBettendorf City B42 | 24P R+6.8 | 22 R+20.0 | Hisp 8.7% Blk 1.1% Inc $155kDavenport City D82 | 24P R+0.2 | 22 R+10.1 | Hisp 11.3% Blk 11.9% Inc $76kDavenport City D83 | 24P D+5.8 | 22 R+0.9 | Hisp 1.0% Blk 14.6% Inc $105kDavenport City D61 | 24P R+8.0 | 22 R+20.8 | Hisp 1.8% Blk 8.3% Inc $110kDavenport City D84 | 24P D+2.7 | 22 R+10.8 | Hisp 5.0% Blk 9.0% Inc $79kDavenport City D21 | 24P D+0.7 | 22 R+5.5 | Hisp 10.5% Blk 13.1% Inc $83kLeClaire City 2 | Hisp 5.7% Blk 1.2% Inc $114kBettendorf City B53 | 24P R+5.5 | 22 R+17.5 | Hisp 4.9% Blk 0.3% Inc $148kLeClaire City 1 | Hisp 1.4% Blk 0.2% Inc $98kDavenport City D81 | 24P R+5.0 | 22 D+0.4 | Hisp 9.0% Blk 8.8% Inc $74kLeClaire Twp | 24P R+22.4 | 22 R+30.5 | Hisp 0.2% Blk 0.1% Inc $88kWalcott | 24P R+33.6 | 22 R+43.5 | Hisp 2.5% Blk 2.1% Inc $79kEldridge City 2 | Hisp 7.2% Blk 1.1% Inc $95kHickory Grove Twp | 24P R+45.6 | 22 R+52.1 | Hisp 4.0% Blk 0.2% Inc $92kLincoln Sheridan | 24P R+42.2 | 22 R+54.9 | Hisp 8.3% Blk 0.7% Inc $100kEldridge City 1 | Hisp 4.5% Blk 0.5% Inc $110kIC.15/ELSE | 24P D+45.1 | 22 D+50.4 | Hisp 22.0% Blk 24.1% Inc $63kIC.12 | 24P D+53.6 | 22 D+53.2 | Hisp 20.1% Blk 13.0% Inc $59kIC.27 | 24P D+52.0 | 22 D+50.3 | Hisp 16.2% Blk 25.6% Inc $77kIC.13 | 24P D+48.9 | 22 D+64.3 | 20P D+61.2 | Hisp 9.9% Blk 16.8% Inc $39kIC.06 | 24P D+61.4 | 22 D+58.1 | 20P D+58.0 | Hisp 3.9% Blk 16.9% Inc $83kIC.14 | 24P D+70.9 | 22 D+71.4 | Hisp 13.7% Blk 5.3% Inc $54kIC.09 | 24P D+59.4 | 22 D+59.4 | Hisp 6.5% Blk 15.9% Inc $68kIC.08 | 24P D+49.2 | 22 D+46.2 | 20P D+49.3 | Hisp 3.3% Blk 5.6% Inc $116kIC.02 | 24P D+56.3 | 22 D+57.3 | Hisp 2.6% Blk 29.6% Inc $83kIC.16/SC.90 | 24P D+55.8 | 22 D+55.3 | Hisp 7.0% Blk 4.1% Inc $85kGoshen | 24P R+22.0 | 22 R+33.0 | Hisp 42.0% Blk 0.3% Inc $91kWapsie | 24P R+18.0 | 22 R+23.0 | Hisp 40.7% Blk 0.0% Inc $90kWILTON TWP | Hisp 7.7% Blk 1.6% Inc $83kWest Liberty 2 | 24P D+30.2 | 22 D+32.6 | Hisp 48.4% Blk 0.0% Inc $70kWEST LIBERTY 1 | 24P D+30.7 | 22 D+21.2 | Hisp 43.4% Blk 0.0% Inc $64kWilton City | 24P R+25.1 | 22 R+31.6 | Hisp 2.8% Blk 3.1% Inc $82kFarmington Sugar Creek | 24P R+38.5 | 22 R+47.6 | 20P R+33.1 | Hisp 5.5% Blk 0.4% Inc $91kSC/WB/IC ANX | 24P D+25.6 | 22 D+18.8 | 20P D+32.6 | Hisp 24.5% Blk 2.2% Inc $80kWest Branch 1 | 24P D+18.2 | 22 D+20.3 | Hisp 3.6% Blk 0.4% Inc $85kGower Springdale | 24P D+0.8 | 22 R+5.4 | 20P D+7.9 | Hisp 2.3% Blk 0.2% Inc $83kIC.26 | 24P D+53.5 | 22 D+48.3 | Hisp 5.6% Blk 21.5% Inc $82kIC.18 | 24P D+75.4 | 22 D+82.5 | Hisp 4.6% Blk 5.2% Inc $55kIC.11 | 24P D+31.0 | 22 D+61.1 | Hisp 6.9% Blk 1.8% Inc $24kUH | 24P D+59.6 | 22 D+63.6 | 20P D+64.5 | Hisp 4.1% Blk 1.3% Inc $79kIC.19 | 24P D+31.5 | 22 D+65.4 | Hisp 3.2% Blk 5.3% Inc $24kIC.20 | 24P D+46.1 | 22 D+72.7 | Hisp 4.9% Blk 4.4% Inc $32kIC.17 | 24P D+72.4 | 22 D+69.8 | Hisp 3.5% Blk 4.2% Inc $92kIC.25 | 24P D+62.7 | 22 D+75.7 | Hisp 9.2% Blk 2.3% Inc $45kIC.03 | 24P D+20.3 | 22 D+53.2 | 20P D+45.1 | Hisp 7.6% Blk 3.3% Inc $65kIC.01 | 24P D+57.3 | 22 D+53.7 | Hisp 4.7% Blk 0.4% Inc $95kIC.24 | 24P D+48.6 | 22 D+44.7 | Hisp 12.3% Blk 2.2% Inc $103kIC.05 | 24P D+34.6 | 22 D+61.9 | Hisp 6.4% Blk 1.8% Inc $23kIC.07 | 24P D+51.5 | 22 D+50.8 | 20P D+59.2 | Hisp 13.6% Blk 3.3% Inc $63kIC.21 | 24P D+49.6 | 22 D+76.7 | 20P D+68.4 | Hisp 4.0% Blk 3.9% Inc $45kIC.04 | 24P D+68.3 | 22 D+69.8 | 20P D+69.0 | Hisp 5.9% Blk 3.7% Inc $66kCV.01 | 24P D+45.8 | 22 D+60.9 | Hisp 5.2% Blk 12.9% Inc $40kIC.23 | 24P D+60.3 | 22 D+60.0 | 20P D+62.4 | Hisp 5.8% Blk 1.0% Inc $122kCV.04 | 24P D+55.4 | 22 D+55.7 | Hisp 5.1% Blk 14.4% Inc $53kCV.08 | 24P D+55.6 | 22 D+62.9 | Hisp 8.5% Blk 29.3% Inc $70kIC.22/ELN | 24P D+63.1 | 22 D+60.2 | Hisp 4.4% Blk 11.2% Inc $76kPrinceton Twp | 24P R+30.7 | 22 R+36.5 | Hisp 0.5% Blk 0.0% Inc $104kPark View | 24P R+22.2 | 22 R+22.4 | Hisp 5.5% Blk 0.0% Inc $108kAllens Grove Twp | 24P R+43.3 | Hisp 4.3% Blk 0.0% Inc $95kWinfield Twp | 24P R+29.8 | 22 R+37.6 | Hisp 12.4% Blk 0.1% Inc $121kLiberty Twp | 24P R+44.6 | 22 R+55.8 | Hisp 0.8% Blk 2.4% Inc $91kMcCausland | 24P R+43.0 | 22 R+46.0 | Hisp 2.9% Blk 0.1% Inc $96kCamanche Township | 24P R+36.0 | 22 R+21.6 | Hisp 3.8% Blk 3.1% Inc $76kEden Twp Low Moor | 24P R+42.6 | 22 R+50.7 | Hisp 0.3% Blk 0.1% Inc $94kCamanche 1 | 24P R+17.4 | 22 R+14.5 | 20P R+10.8 | Hisp 0.0% Blk 1.1% Inc $96kCamanche 2 | 24P R+22.3 | 22 R+24.3 | 20P R+11.5 | Hisp 3.4% Blk 0.0% Inc $76kCass Center Iowa Rochester | 24P R+32.2 | 22 R+39.7 | 20P R+30.8 | Hisp 2.6% Blk 0.6% Inc $78kInland | 24P R+57.7 | 22 R+67.8 | 20P R+52.7 | Hisp 1.5% Blk 0.0% Inc $86kGR | 24P D+18.4 | 22 D+9.5 | 20P D+27.3 | Hisp 1.7% Blk 0.0% Inc $107kTipton 1 | 24P R+14.3 | 22 R+23.9 | 20P R+4.6 | Hisp 8.7% Blk 2.0% Inc $58kTipton 3 | 24P R+5.4 | 22 R+20.5 | 20P R+4.0 | Hisp 1.0% Blk 0.1% Inc $68kTipton 2 | 24P R+3.3 | 22 R+7.7 | 20P R+2.5 | Hisp 1.9% Blk 0.4% Inc $50kCE | 24P R+13.5 | 22 R+17.0 | 20P R+4.2 | Hisp 1.7% Blk 0.0% Inc $112kLiberty Spring Rock Toronto Wheatland | 24P R+48.1 | Hisp 3.3% Blk 0.3% Inc $62kMassillon Springfield | 24P R+44.7 | 22 R+51.5 | 20P R+35.0 | Hisp 2.5% Blk 0.0% Inc $73kDayton Fairfield | 24P R+40.3 | 22 R+44.2 | 20P R+34.2 | Hisp 1.3% Blk 0.6% Inc $64kNL.08 | 24P D+31.3 | 22 D+35.7 | Hisp 20.5% Blk 5.2% Inc $64kPN/CV ANX | 24P D+34.2 | 22 D+28.8 | Hisp 3.0% Blk 3.3% Inc $143kNL.05 | 24P D+39.9 | 22 D+40.3 | Hisp 3.1% Blk 1.3% Inc $109kNL.06 | 24P D+27.9 | 22 D+30.5 | Hisp 4.8% Blk 4.9% Inc $97kNL.03 | 24P D+24.9 | 22 D+25.1 | Hisp 2.4% Blk 5.2% Inc $137kNL.01 | 24P D+28.0 | 22 D+23.5 | Hisp 7.7% Blk 0.4% Inc $133kSO | 20P D+5.1 | Hisp 1.6% Blk 0.0% Inc $115kBG/SO ANX | 24P R+5.3 | 22 R+9.0 | Hisp 1.1% Blk 0.2% Inc $136kJE/SH | 24P R+6.3 | 22 R+15.4 | 20P R+7.2 | Hisp 2.7% Blk 0.2% Inc $119kMarengo City | 24P R+19.8 | 22 R+28.0 | 20P R+20.7 | Hisp 0.2% Blk 0.9% Inc $57kHoney Creek Marengo | 24P R+48.4 | 22 R+62.9 | 20P R+44.0 | Hisp 0.2% Blk 0.8% Inc $62kOrange Grand Mound | 24P R+32.3 | 22 R+40.0 | 20P R+28.0 | Hisp 2.1% Blk 0.0% Inc $98kClinton W1p2 | 24P R+17.4 | 22 R+16.6 | Hisp 8.3% Blk 2.0% Inc $71kDewitt 1 | 24P R+13.8 | 22 R+17.9 | Hisp 1.2% Blk 0.1% Inc $80kDewitt 2 | 24P R+9.8 | 22 R+18.8 | Hisp 0.9% Blk 1.0% Inc $116kDewitt Twp | 24P R+38.3 | 22 R+50.7 | 20P R+40.1 | Hisp 2.0% Blk 0.8% Inc $108kClinton W1p1 | 24P R+1.0 | 22 D+0.6 | Hisp 1.5% Blk 3.2% Inc $57kClinton W2p2 | 24P R+7.8 | 22 R+11.8 | Hisp 0.6% Blk 2.3% Inc $90kOlive Grant Calamus | 24P R+48.3 | 22 R+54.2 | 20P R+47.4 | Hisp 3.6% Blk 0.0% Inc $81kClinton W2p1 | 24P D+12.1 | 22 D+17.1 | Hisp 1.7% Blk 17.5% Inc $42kClinton W3p2 | 24P D+0.3 | 22 R+3.8 | Hisp 5.0% Blk 7.7% Inc $55kClinton W3p1 | 24P D+1.7 | 22 D+1.4 | Hisp 6.8% Blk 6.3% Inc $55kClinton W4p2 | 24P R+10.2 | 22 R+11.9 | Hisp 6.3% Blk 3.0% Inc $54kClinton W4p1 | 24P R+13.4 | 22 R+15.3 | Hisp 6.6% Blk 0.3% Inc $74kWelton Washington Welton | 24P R+38.4 | 22 R+44.0 | 20P R+28.6 | Hisp 1.0% Blk 0.0% Inc $93kCenter Twp Deep Creek Goose Lake | 24P R+53.6 | 22 R+61.4 | 20P R+49.6 | Hisp 1.8% Blk 0.5% Inc $90kElk River Hampshire Andover | 24P R+36.9 | 22 R+36.2 | 20P R+30.9 | Hisp 2.4% Blk 0.3% Inc $91kBloomfield Brookfield Delmar | 24P R+37.2 | 22 R+44.1 | 20P R+29.6 | Hisp 2.6% Blk 1.8% Inc $80kWaterford Charlotte | 24P R+47.7 | 22 R+48.4 | 20P R+42.2 | Hisp 6.6% Blk 0.0% Inc $85kPct 13 | 24P R+13.9 | 22 R+24.3 | Hisp 0.2% Blk 1.3% Inc $73kPct 11 | 24P R+19.9 | 22 R+9.4 | Hisp 0.1% Blk 5.2% Inc $69kFremont Red Oak | 24P R+32.4 | 22 R+40.3 | 20P R+27.7 | Hisp 0.3% Blk 0.8% Inc $68kLinn Pioneer | 24P R+28.2 | 22 R+35.8 | 20P R+23.0 | Hisp 2.9% Blk 0.0% Inc $88kSharon Lost Nation | 24P R+45.5 | 22 R+38.5 | 20P R+38.1 | Hisp 8.7% Blk 0.3% Inc $59kOxford | 24P R+37.2 | 22 R+29.5 | Hisp 1.3% Blk 0.1% Inc $42kRome/Hale | 24P R+34.0 | 22 R+31.0 | Hisp 3.7% Blk 4.4% Inc $66kGreenfield | 24P R+26.5 | 22 R+35.6 | Hisp 3.0% Blk 0.3% Inc $93kPct 12 | 24P R+15.1 | 22 R+11.4 | Hisp 0.0% Blk 0.2% Inc $58kPct 10 | 24P R+13.9 | 22 R+17.4 | Hisp 1.0% Blk 0.3% Inc $63kPct 9 | 24P R+16.6 | 22 R+24.6 | Hisp 3.3% Blk 2.7% Inc $50kPct 6 | 24P R+36.9 | 22 R+43.7 | Hisp 0.8% Blk 2.2% Inc $67kPct 8 | 24P R+43.5 | 22 R+53.6 | Hisp 1.4% Blk 0.0% Inc $65kPct 7 | 24P R+53.3 | 22 R+60.3 | Hisp 1.3% Blk 1.8% Inc $75kPct 5 | 24P R+43.9 | 22 R+47.0 | Hisp 2.9% Blk 0.0% Inc $86kPct 4 | 24P R+42.5 | 22 R+47.5 | Hisp 0.3% Blk 0.0% Inc $78kPct 3 | 24P R+34.1 | 22 R+39.5 | Hisp 0.0% Blk 0.0% Inc $72kPct 1 | 24P R+24.0 | 22 R+30.0 | Hisp 4.2% Blk 0.0% Inc $80kWyoming | 24P R+46.0 | 22 R+48.8 | Hisp 3.2% Blk 0.1% Inc $71kAnamosa South/Jackson | 24P R+16.6 | 22 R+22.9 | Hisp 1.7% Blk 0.3% Inc $80kFairview | 22 R+31.1 | Hisp 1.0% Blk 3.3% Inc $85kScotch Grove/Madison/Clay | 24P R+48.3 | 22 R+54.5 | Hisp 7.3% Blk 0.5% Inc $80kAnamosa North/Cass | 24P R+20.3 | 22 R+21.0 | Hisp 1.3% Blk 8.5% Inc $60kCastle Grove/Lovell/Wayne | 24P R+31.5 | 22 R+38.9 | Hisp 2.2% Blk 0.8% Inc $84kMonticello 4 | 24P R+5.5 | 22 R+18.3 | Hisp 8.0% Blk 1.8% Inc $60kMonticello 1 | 24P R+24.3 | 22 R+37.9 | Hisp 0.1% Blk 0.1% Inc $100kMonticello 3 | 24P R+1.9 | 22 R+14.3 | Hisp 2.6% Blk 5.7% Inc $67kPct 2 | 24P R+39.5 | 22 R+49.0 | Hisp 2.6% Blk 0.0% Inc $126kMonticello 2 | 24P R+17.7 | 22 R+22.8 | Hisp 1.2% Blk 0.1% Inc $86kRichland/Washington | 24P R+43.0 | 22 R+50.3 | Hisp 3.9% Blk 0.0% Inc $93kHickory Grove | Hisp 1.2% Blk 2.0% Inc $87kVirginia | 24P R+52.1 | 22 R+55.4 | Hisp 0.7% Blk 0.0% Inc $86kJackson | 24P R+34.0 | 22 R+40.2 | 20P R+30.9 | Hisp 6.8% Blk 0.0% Inc $109kJefferson | 24P R+41.8 | 22 R+38.9 | 20P R+31.5 | Hisp 2.7% Blk 0.3% Inc $101kGreenfield 2 | 24P R+1.1 | 22 R+36.3 | Hisp 3.4% Blk 2.3% Inc $116kGreenfield 1 | 24P R+19.2 | 22 R+24.6 | Hisp 1.3% Blk 1.6% Inc $88kLinn | 24P R+30.8 | 22 R+34.1 | Hisp 5.5% Blk 0.3% Inc $107kNorwalk 4 | 24P R+9.3 | 22 R+11.9 | Hisp 2.2% Blk 0.0% Inc $96kNorwalk 3 | 24P R+4.5 | 22 R+7.5 | Hisp 2.1% Blk 0.1% Inc $113kCumming/WDM | 24P R+17.5 | 22 R+31.3 | Hisp 11.3% Blk 0.7% Inc $119kNorwalk 2 | 24P R+3.0 | 22 R+9.5 | Hisp 4.9% Blk 0.1% Inc $96kNorwalk 1 | 24P R+11.5 | 22 R+27.7 | Hisp 7.4% Blk 0.3% Inc $94kNorwalk 7 | 24P R+27.0 | 22 R+27.9 | Hisp 0.0% Blk 0.0% Inc $141kDes Moines 74 | 24P R+28.1 | 22 R+31.3 | Hisp 2.1% Blk 0.5% Inc $87kNorwalk 5 | 24P R+8.3 | 22 R+17.0 | Hisp 2.1% Blk 0.0% Inc $115kIA-19181-031 | 24P R+8.9 | 22 R+7.6 | Hisp 0.1% Blk 0.0% Inc $87kLiberty | 24P R+55.1 | 22 R+62.8 | 20P R+50.5 | Hisp 12.2% Blk 1.5% Inc $112kSquaw Creek | 24P R+53.9 | 22 R+54.9 | 20P R+44.7 | Hisp 5.1% Blk 0.0% Inc $106kOtter | 24P R+43.7 | 22 R+46.4 | 20P R+40.4 | Hisp 12.9% Blk 1.8% Inc $115kWhite Oak | 24P R+42.5 | 22 R+46.6 | 20P R+34.7 | Hisp 5.4% Blk 0.1% Inc $106kWhite Breast | 24P R+50.1 | 22 R+54.6 | 20P R+40.2 | Hisp 7.7% Blk 0.2% Inc $73kDallas | 24P R+33.6 | 22 R+32.9 | Hisp 3.7% Blk 0.0% Inc $73kWashington | 24P R+55.9 | 22 R+50.4 | Hisp 0.0% Blk 0.0% Inc $119kIndiana | 24P R+41.7 | 22 R+46.4 | Hisp 0.0% Blk 0.8% Inc $67kLiberty | 24P R+54.6 | 22 R+59.2 | Hisp 1.4% Blk 0.3% Inc $60kEDM / GF / JF / WDM | 24P R+66.0 | 22 R+74.3 | Hisp 0.7% Blk 0.2% Inc $71kCE / HA / WO | 24P R+64.4 | 22 R+68.9 | 20P R+61.0 | Hisp 5.5% Blk 0.6% Inc $77kOSKALOOSA 3RD WARD | Hisp 2.7% Blk 1.0% Inc $76kOSKALOOSA 2ND WARD | 20P R+34.4 | Hisp 4.3% Blk 0.7% Inc $55kBelmont | 24P R+62.0 | 22 R+69.5 | 20P R+58.4 | Hisp 1.3% Blk 1.5% Inc $95kFranklin | 24P R+58.8 | 22 R+63.0 | Hisp 0.0% Blk 0.0% Inc $93kKnoxville City Ward 1 | 24P R+25.1 | 22 R+29.9 | Hisp 0.4% Blk 0.2% Inc $55kKnoxville City Ward 2 | 24P R+24.6 | 22 R+20.8 | Hisp 1.0% Blk 0.2% Inc $66kKnoxville Twp | 24P R+40.6 | 22 R+43.7 | Hisp 2.3% Blk 0.6% Inc $64kKnoxville City Ward 4 | 24P R+16.8 | 22 R+27.0 | Hisp 1.2% Blk 0.7% Inc $79kKnoxville City Ward 3 | 24P R+21.4 | 22 R+18.6 | Hisp 2.4% Blk 0.1% Inc $96kUnion | 24P R+40.4 | 22 R+45.1 | 20P R+36.3 | Hisp 3.3% Blk 2.0% Inc $102kPleasantville | 24P R+36.5 | 22 R+36.5 | Hisp 1.3% Blk 1.9% Inc $78kUnion | 24P R+24.3 | 22 R+25.4 | Hisp 1.1% Blk 2.5% Inc $80kOSKALOOSA 1ST WARD | 24P R+37.0 | 22 R+35.9 | Hisp 5.2% Blk 4.6% Inc $59kOSKALOOSA 4TH WARD | Hisp 2.5% Blk 1.0% Inc $69kClay Township | 24P R+57.5 | 22 R+61.9 | Hisp 1.2% Blk 0.1% Inc $77kAD / LN / MN / SP | 24P R+58.4 | 22 R+65.1 | Hisp 1.5% Blk 1.1% Inc $69kBO / RL / ST | 24P R+71.4 | 22 R+78.6 | Hisp 0.0% Blk 0.3% Inc $88kPella City Ward 4 | 24P R+35.4 | 22 R+48.0 | Hisp 7.7% Blk 0.9% Inc $74kPella City Ward 1 | 24P R+34.2 | 22 R+47.0 | Hisp 2.2% Blk 0.2% Inc $78kLake Prairie | 24P R+58.0 | 22 R+70.8 | Hisp 2.2% Blk 0.2% Inc $95kPella City Ward 2 | 24P R+37.8 | 22 R+49.0 | Hisp 1.6% Blk 0.0% Inc $90kMD / PG / PR / UN | 24P R+66.5 | 22 R+65.8 | Hisp 0.0% Blk 0.0% Inc $80kIndianola 7 | 24P R+22.4 | 22 R+18.6 | Hisp 2.4% Blk 2.1% Inc $63kIndianola 5 | 24P R+11.0 | 22 R+13.9 | Hisp 1.0% Blk 0.9% Inc $56kLincoln 2 | 24P R+43.9 | 22 R+44.1 | Hisp 4.0% Blk 0.4% Inc $85kIndianola 8 | 24P R+15.5 | 22 R+23.3 | Hisp 0.5% Blk 0.4% Inc $69kIndianola 6 | 24P R+21.4 | 22 R+25.7 | Hisp 0.7% Blk 0.4% Inc $90kIndianola 2 | 24P R+9.2 | 22 R+5.4 | Hisp 3.3% Blk 1.4% Inc $83kIndianola 4 | 24P R+6.8 | 22 R+11.1 | Hisp 1.5% Blk 1.1% Inc $110kIndianola 1 | 24P R+9.4 | 22 R+19.9 | Hisp 2.9% Blk 0.0% Inc $89kIndianola 3 | 24P R+1.9 | 22 R+1.8 | Hisp 5.0% Blk 1.7% Inc $83kLincoln 1 | 24P R+26.3 | 22 R+39.7 | Hisp 2.5% Blk 0.3% Inc $96kLincoln 3 | 24P R+42.4 | Hisp 5.9% Blk 0.3% Inc $94kGreenfield 4 | 24P R+34.9 | Hisp 1.0% Blk 2.9% Inc $115kGreenfield 3 | 24P R+21.3 | Hisp 1.0% Blk 2.8% Inc $112kAllen 3 | 24P R+16.1 | 22 R+23.4 | 20P R+13.3 | Hisp 5.7% Blk 0.4% Inc $109kDes Moines 73 | 24P R+4.8 | 22 R+7.2 | Hisp 2.3% Blk 0.6% Inc $69kIA-19181-001 | 24P R+18.4 | 22 R+23.4 | 20P R+12.3 | Hisp 11.0% Blk 0.0% Inc $133kPalmyra | 24P R+48.1 | 22 R+54.7 | 20P R+37.9 | Hisp 3.6% Blk 1.7% Inc $100kOtley | 24P R+45.8 | 22 R+53.5 | Hisp 2.0% Blk 0.0% Inc $105kRichland | 24P R+38.6 | 22 R+40.8 | Hisp 5.1% Blk 0.2% Inc $91kDes Moines | 24P R+38.5 | Hisp 0.7% Blk 0.4% Inc $78kFairview | 24P R+36.4 | 22 R+41.1 | Hisp 1.1% Blk 0.1% Inc $81kPalo Alto | 24P R+43.8 | 22 R+51.1 | Hisp 4.3% Blk 9.8% Inc $108kPella City Ward 3 | 24P R+35.8 | 22 R+49.3 | Hisp 4.1% Blk 0.6% Inc $85kBuena Vista-Elk Creek | 24P R+58.3 | 22 R+62.8 | Hisp 1.1% Blk 1.4% Inc $92kLynngrove-Richland | 24P R+77.6 | 22 R+80.7 | Hisp 0.3% Blk 0.0% Inc $83kColfax 1 | 22 R+9.4 | Hisp 2.8% Blk 0.6% Inc $103kColfax 2 | 22 R+3.4 | Hisp 2.8% Blk 0.6% Inc $104kNewton 3-2 | 24P R+16.9 | 22 R+8.6 | 20P D+3.5 | Hisp 4.9% Blk 0.9% Inc $68kColfax 3 | 24P R+19.5 | 22 R+29.3 | Hisp 1.0% Blk 2.8% Inc $48kNewton 4-1 | 24P R+4.4 | 22 R+6.5 | 20P R+3.1 | Hisp 2.1% Blk 1.3% Inc $68kNewton 4-2 | 24P R+6.7 | 22 R+2.3 | 20P D+6.0 | Hisp 10.5% Blk 1.5% Inc $53kMound Prairie-Poweshiek-Washington | Hisp 0.9% Blk 0.8% Inc $86kNewton 3-1 | 24P R+10.9 | 22 R+4.4 | 20P D+0.6 | Hisp 12.1% Blk 0.4% Inc $48kNewton 1-2 | 24P D+0.3 | 22 R+5.4 | 20P R+3.6 | Hisp 7.7% Blk 0.9% Inc $59kNewton 2-1 | 24P R+13.8 | 22 R+13.3 | 20P R+1.7 | Hisp 4.8% Blk 1.7% Inc $48kNewton 1-1 | 24P R+6.1 | 22 R+10.8 | Hisp 1.9% Blk 5.9% Inc $53kNewton 2-2 | 24P R+9.5 | 22 R+15.8 | Hisp 3.4% Blk 0.0% Inc $76kMalaka-Newton-Sherman | 24P R+29.5 | 22 R+34.6 | Hisp 1.2% Blk 0.1% Inc $92kClear Creek-Independence | 24P R+34.7 | Hisp 0.2% Blk 0.0% Inc $89kMilton Precinct | 20P R+61.2Cantril Precinct | 20P R+57.4Keosauqua Precinct | 20P R+40.5Farmington Precinct | 20P R+53.5Bonaparte Precinct | 20P R+50.8Stockport Precinct | 20P R+63.0Brighton/Marion/Crawford | 20P R+46.9Washington ward 3 | 20P R+5.9Washington ward 4 | 20P R+15.6West Chester | 20P R+47.7Washington ward 1 | 20P R+11.3Washington ward 2 | 20P R+18.3Muscatine County Fruitland 1 Precinct | 20P R+37.0Jackson | 20P R+61.1Richland | 20P R+54.2Benton Steady Run | 20P R+56.4Indiana | 20P R+36.3East West Lancaster | 20P R+53.3Warren | 20P R+48.5Knoxville 3 | 20P R+14.5Clay | 20P R+52.4Knoxville 2 | 20P R+14.0Sigourney Precinct/Ward 3 | 20P R+25.6Ainsworth | 20P R+23.7Muscatine County Seventy-Six/ Cedar Prec | 20P R+21.1Muscatine County Orono Precinct | 20P R+23.7Muscatine 8 | 20P R+18.2Muscatine 7 | 20P R+3.0Muscatine 3 | 20P D+14.6Muscatine 5 | 20P D+5.7Muscatine 2 | 20P D+1.0Muscatine 9 | 20P D+6.9Muscatine 1 | 20P D+1.7Muscatine 4 | 20P D+15.5Muscatine County Fruitland 2/ Lake Preci | 20P R+20.0Muscatine 6 | 20P R+0.3Muscatine 10 | 20P D+1.4Muscatine County Bloomington Precinct | 20P R+23.4Muscatine County Pike Precinct | 20P R+27.2Wellman | 20P R+29.2Buffalo | 20P R+31.5Muscatine County Sweetland Precinct | 20P R+30.0Buffalo Township | 20P R+26.0Davenport 14 | 20P D+12.5Davenport 33 | 20P D+40.9Davenport 31 | 20P D+17.7Davenport 34 | 20P D+47.4Davenport 12 | 20P D+16.5Davenport 32 | 20P D+36.1Davenport 54 | 20P D+44.8Bettendorf ward 1 precinct 2 | 20P R+0.4Bettendorf ward 1 precinct 1 | 20P D+3.4Davenport 41 | 20P D+10.4Kalona | 20P R+13.2Riverside | 20P D+4.9Davenport 13 | 20P D+0.0Muscatine County Fulton/ Montpelier Prec | 20P R+36.6Blue Grass | 20P R+25.4Muscatine County Moscow/ Wilton Precinct | 20P R+41.1Muscatine County Goshen Precinct | 20P R+18.2West Liberty 2 | 20P D+45.9Muscatine County Wilton City Precinct | 20P R+14.4Bettendorf ward 3 precinct 1 | 20P D+4.6Riverdale | 20P R+11.3Davenport 44 | 20P D+35.6Davenport 64 | 20P D+22.7Davenport 52 | 20P D+28.8Davenport 53 | 20P D+24.7Davenport 42 | 20P D+11.8Davenport 43 | 20P D+17.1Bettendorf ward 3 precinct 2 | 20P D+6.6Davenport 24 | 20P D+15.3Bettendorf ward 2 precinct 1 | 20P D+12.7Davenport 51 | 20P D+28.0Bettendorf ward 5 precinct 1 | 20P R+1.6Davenport 72 | 20P D+19.5Davenport 63 | 20P D+20.2Bettendorf ward 2 precinct 2 | 20P R+1.3Davenport 11 | 20P D+8.1Davenport 23 | 20P R+2.9Bettendorf ward 4 precinct 2 | 20P D+8.7Davenport 74 | 20P D+30.5Bettendorf ward 2 precinct 3 | 20P R+8.8Davenport 22 | 20P D+15.1Davenport 62 | 20P R+4.9Davenport 71 | 20P D+14.2Davenport 73 | 20P D+18.1Pleasant Valley | 20P R+29.6Bettendorf ward 4 precinct 1 | 20P R+4.4Davenport 82 | 20P D+4.2Davenport83 | 20P D+15.2Le Claire 2 | 20P R+15.7Douds Precinct | 20P R+58.4Birmingham Precinct | 20P R+59.0Dallas | 20P R+24.9Washington | 20P R+42.3Liberty | 20P R+47.0Knoxville 1 | 20P R+23.3Sigourney Precinct/Ward 4 | 20P R+25.8Knoxville 4\ | 20P R+12.3Knoxville | 20P R+36.4Sigourney Precinct/Ward 2 | 20P R+35.2Lafayette Clear Creek | 20P R+39.8Sigourney Precinct/Ward 1 | 20P R+30.8Sigourney Plank VanBuren | 20P R+59.2Pleasantville | 20P R+29.4What Cheer Washington | 20P R+40.7Pella 4 | 20P R+28.5Pella 1 | 20P R+35.2Lake Prairie | 20P R+54.9Pella 2 | 20P R+36.2Pella 3 | 20P R+40.2Otley | 20P R+44.0Prairie | 20P R+56.7Adams | 20P R+47.9English River Liberty | 20P R+34.7Bettendorf ward 5 precinct 2 | 20P R+5.4Davenport 21 | 20P D+5.6Davenport 84 | 20P D+4.8Davenport 61 | 20P R+2.4LeClaire 1 | 20P R+10.6Davenport81 | 20P D+8.2Le Claire | 20P R+25.8Eldridge 2 | 20P R+19.6Eldridge 1 | 20P R+12.3Parkview | 20P R+18.7Long Grove | 20P R+12.3Princeton | 20P R+24.5Winfield | 20P R+32.4McCausland | 20P R+34.8Walcott | 20P R+23.7Hickory Grove | 20P R+40.1Donahue | 20P R+25.4Allen's Grove | 20P R+36.5Liberty | 20P R+35.9Oxford | 20P R+29.1Rome/Hale | 20P R+24.1Greenfield | 20P R+23.1Wyoming | 20P R+38.2Anamosa South/Jackson | 20P R+4.7Fairview | 20P R+23.9Scotch Grove/Madison/Clay | 20P R+40.6Anamosa North/Cass | 20P R+15.4Castle Grove/Lovell/Wayne | 20P R+31.4Monticello 4 | 20P R+5.3Monticello 1 | 20P R+19.9Monticello 3 | 20P R+11.0Monticello 2 | 20P R+14.6Richland/Washington | 20P R+36.9

Choose a layer above. Hover a precinct for its values.

Past results: certified precinct results from the state election office (Iowa Secretary of State, Election Night Reporting), on current precinct shapes. Census: U.S. Census Bureau American Community Survey, ACS 2020-2024 5-year.

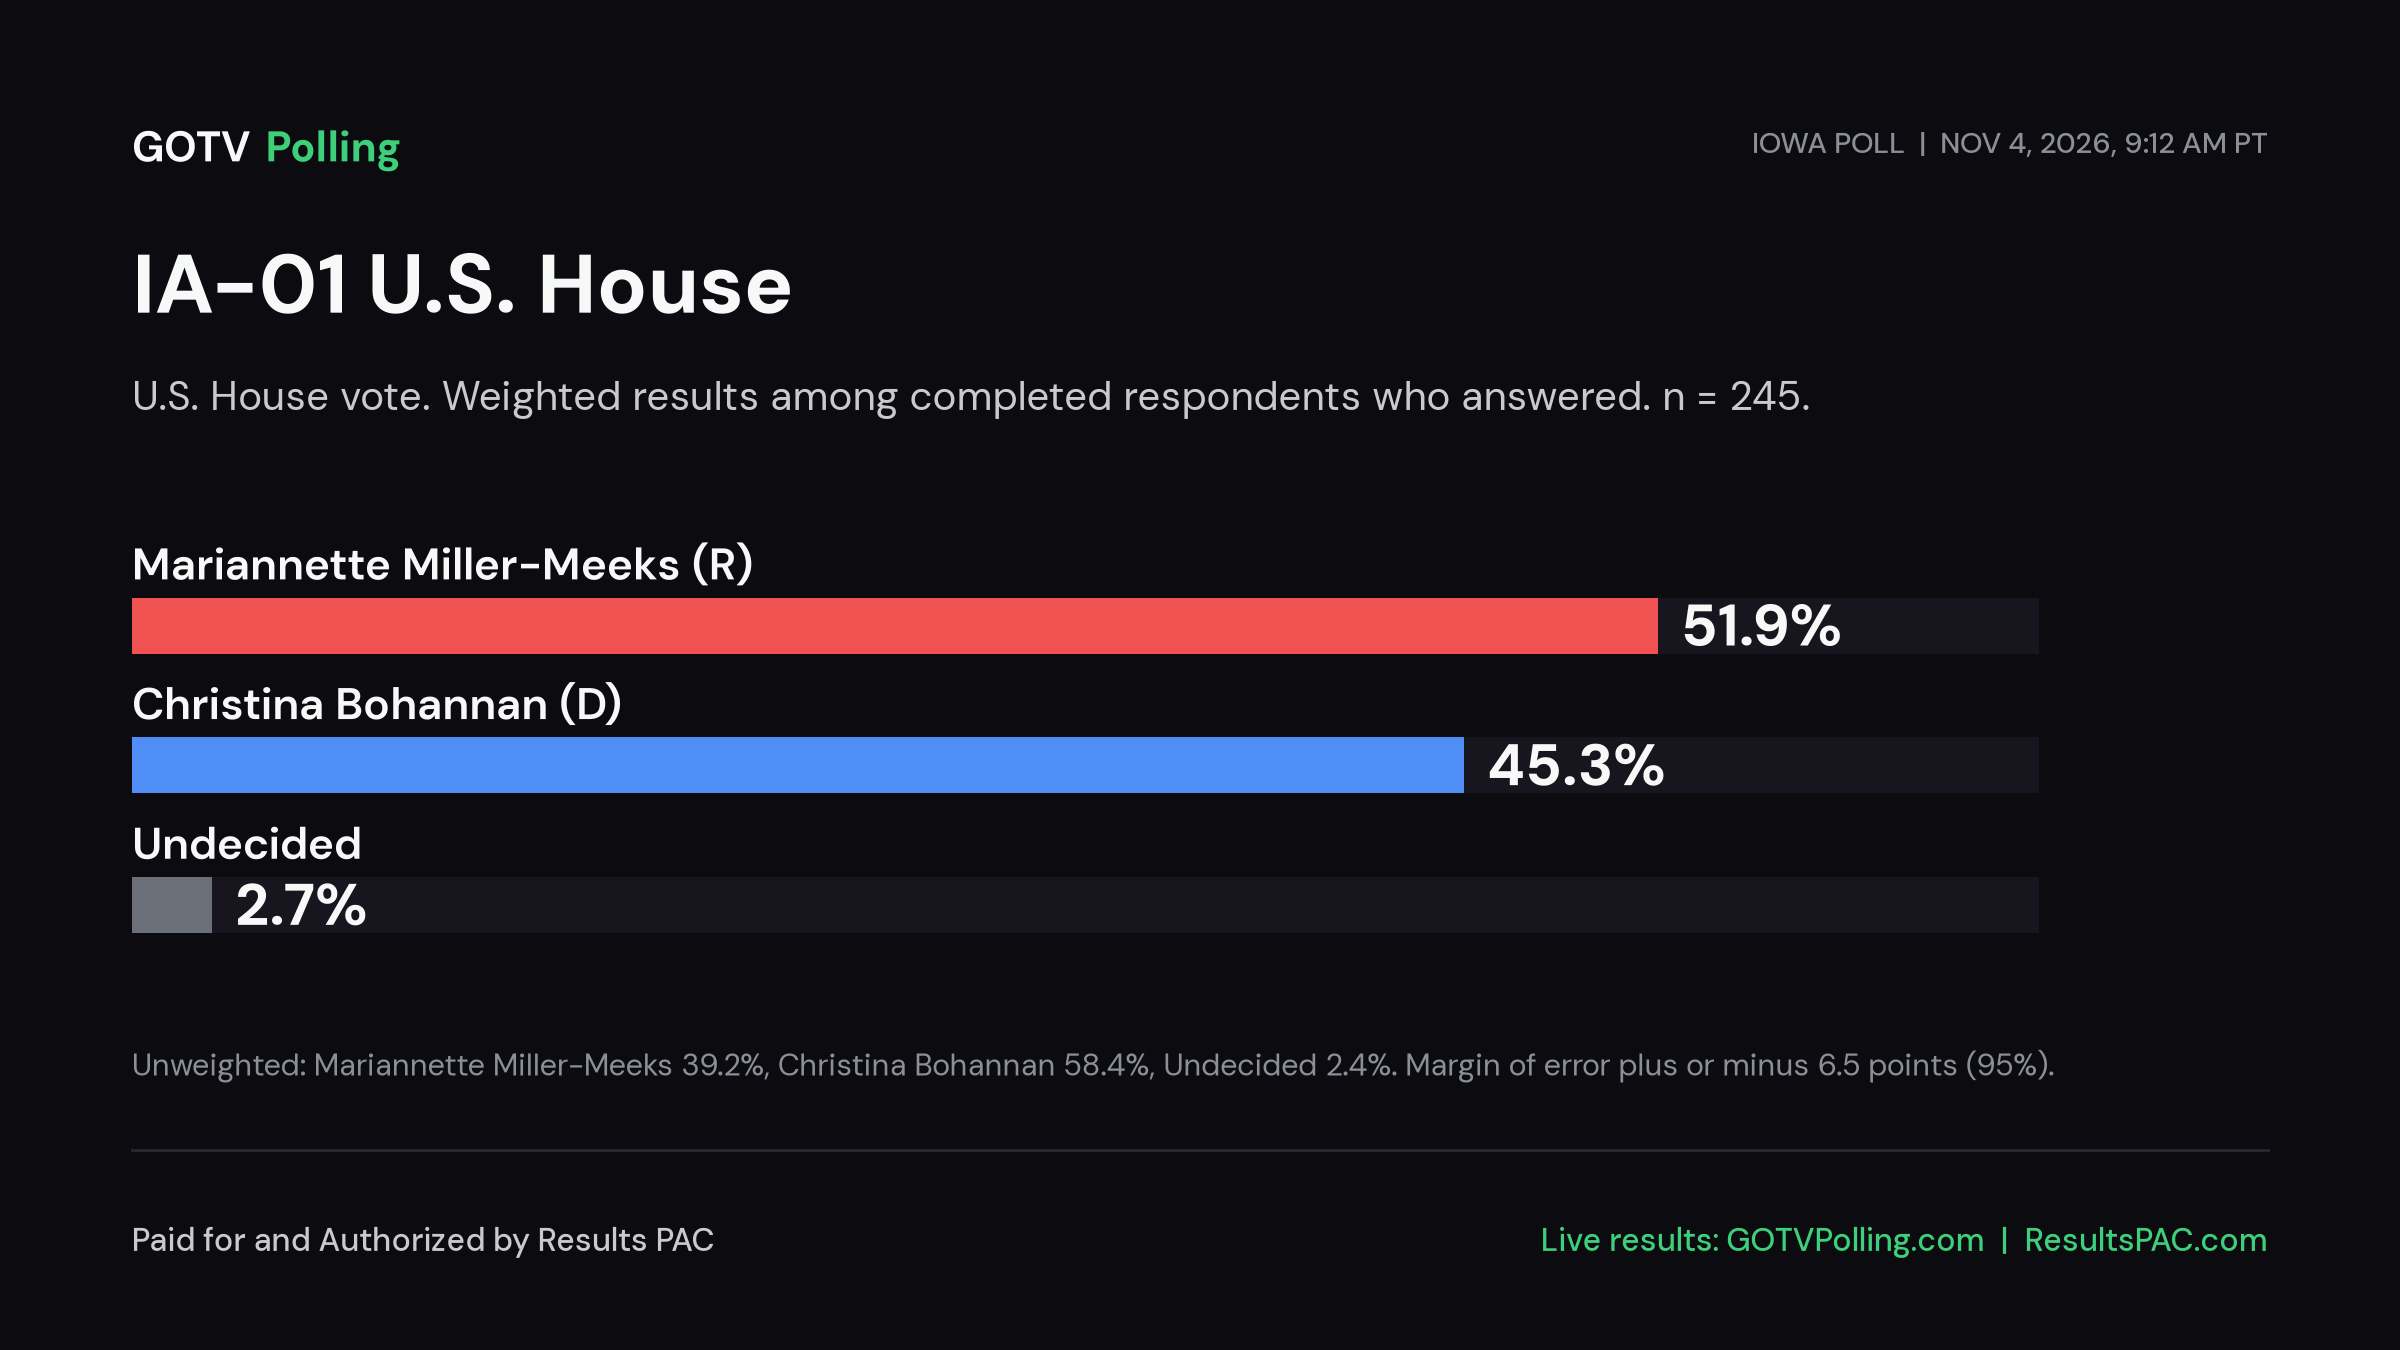
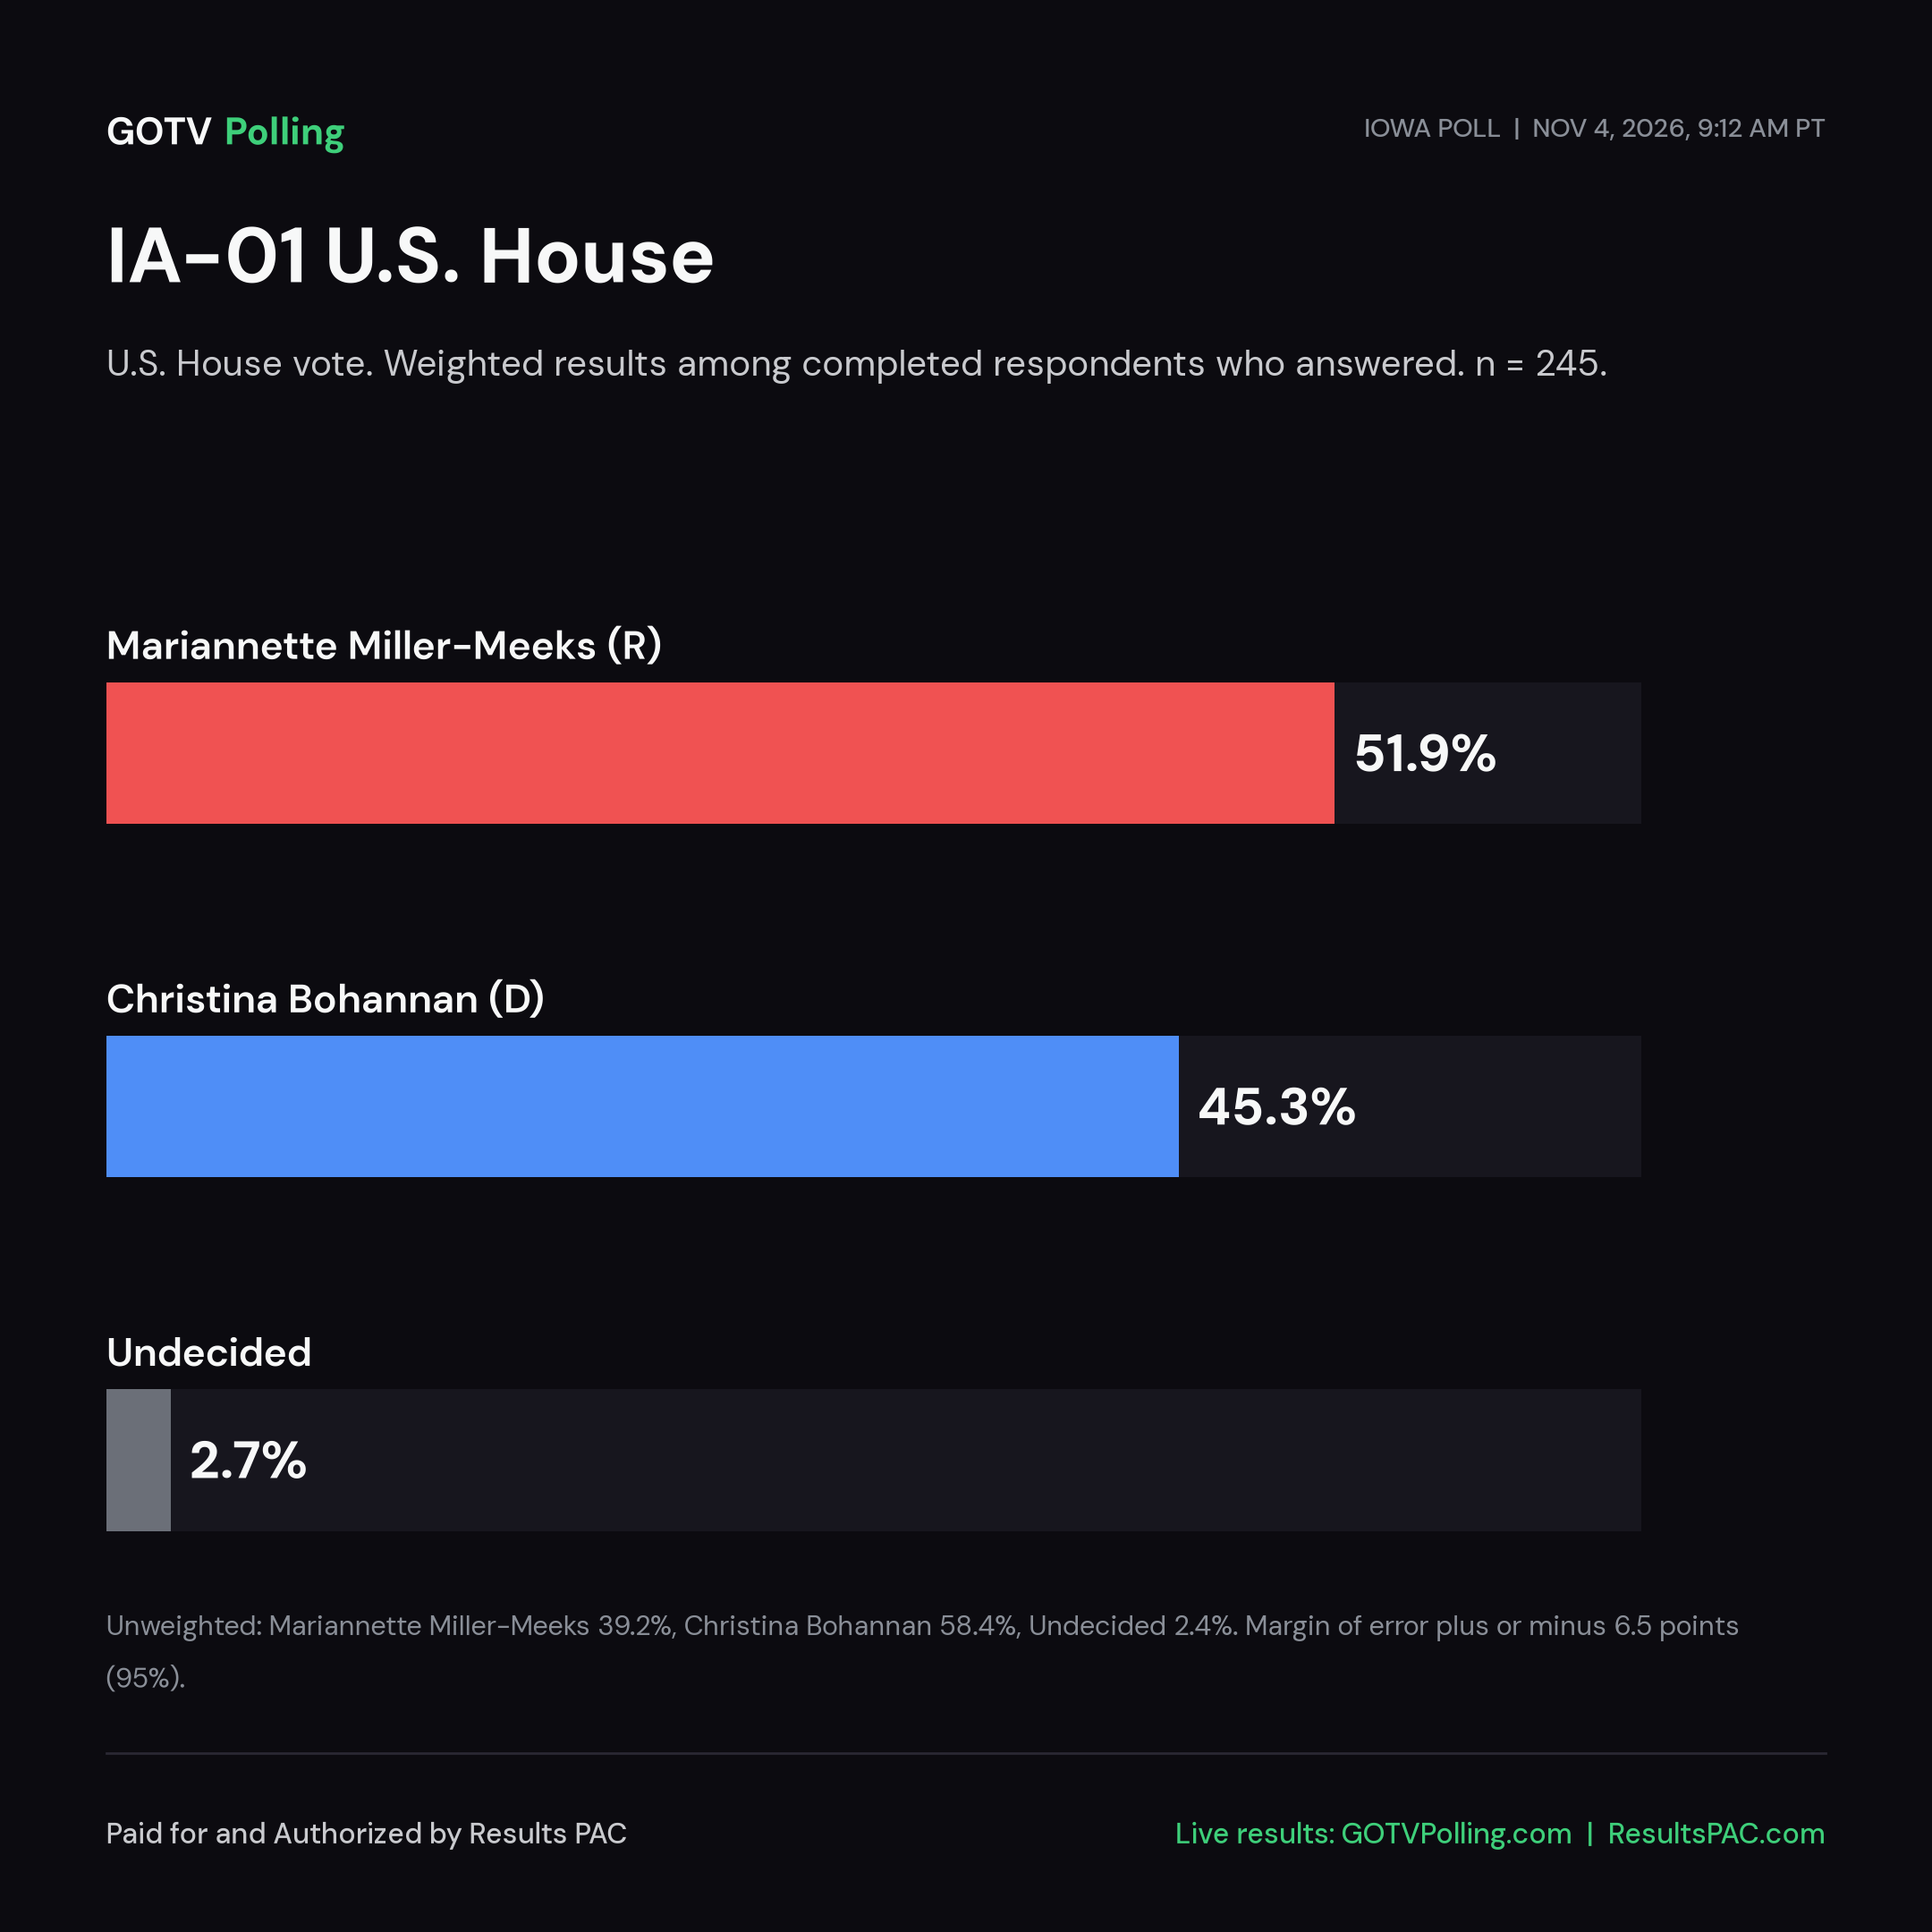
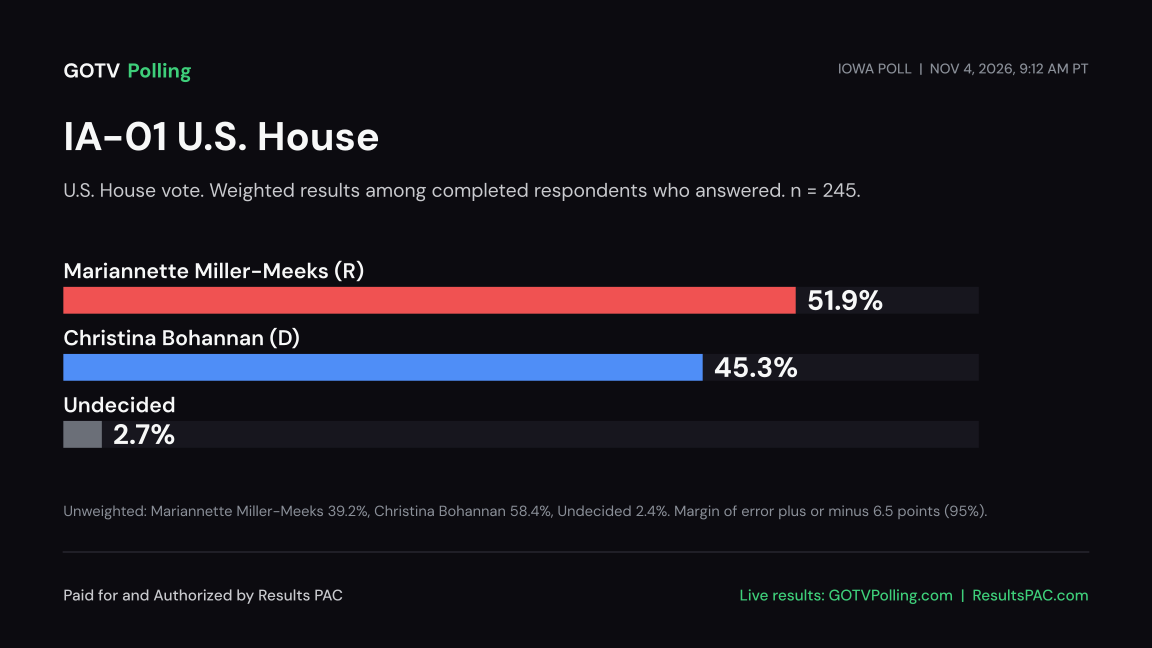
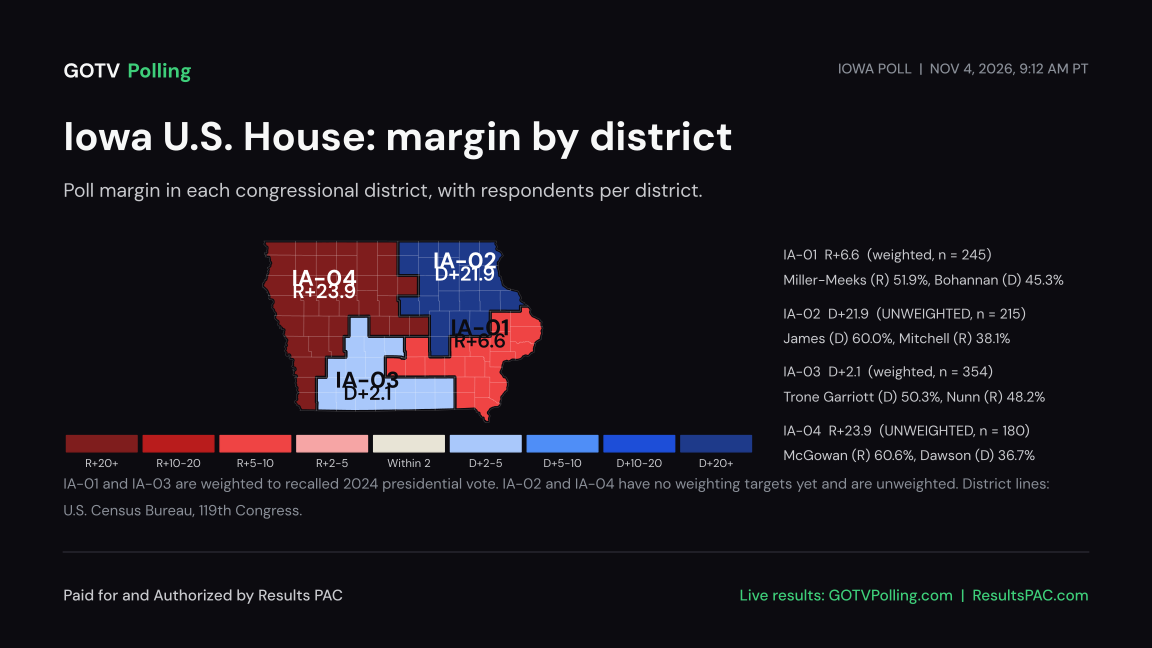
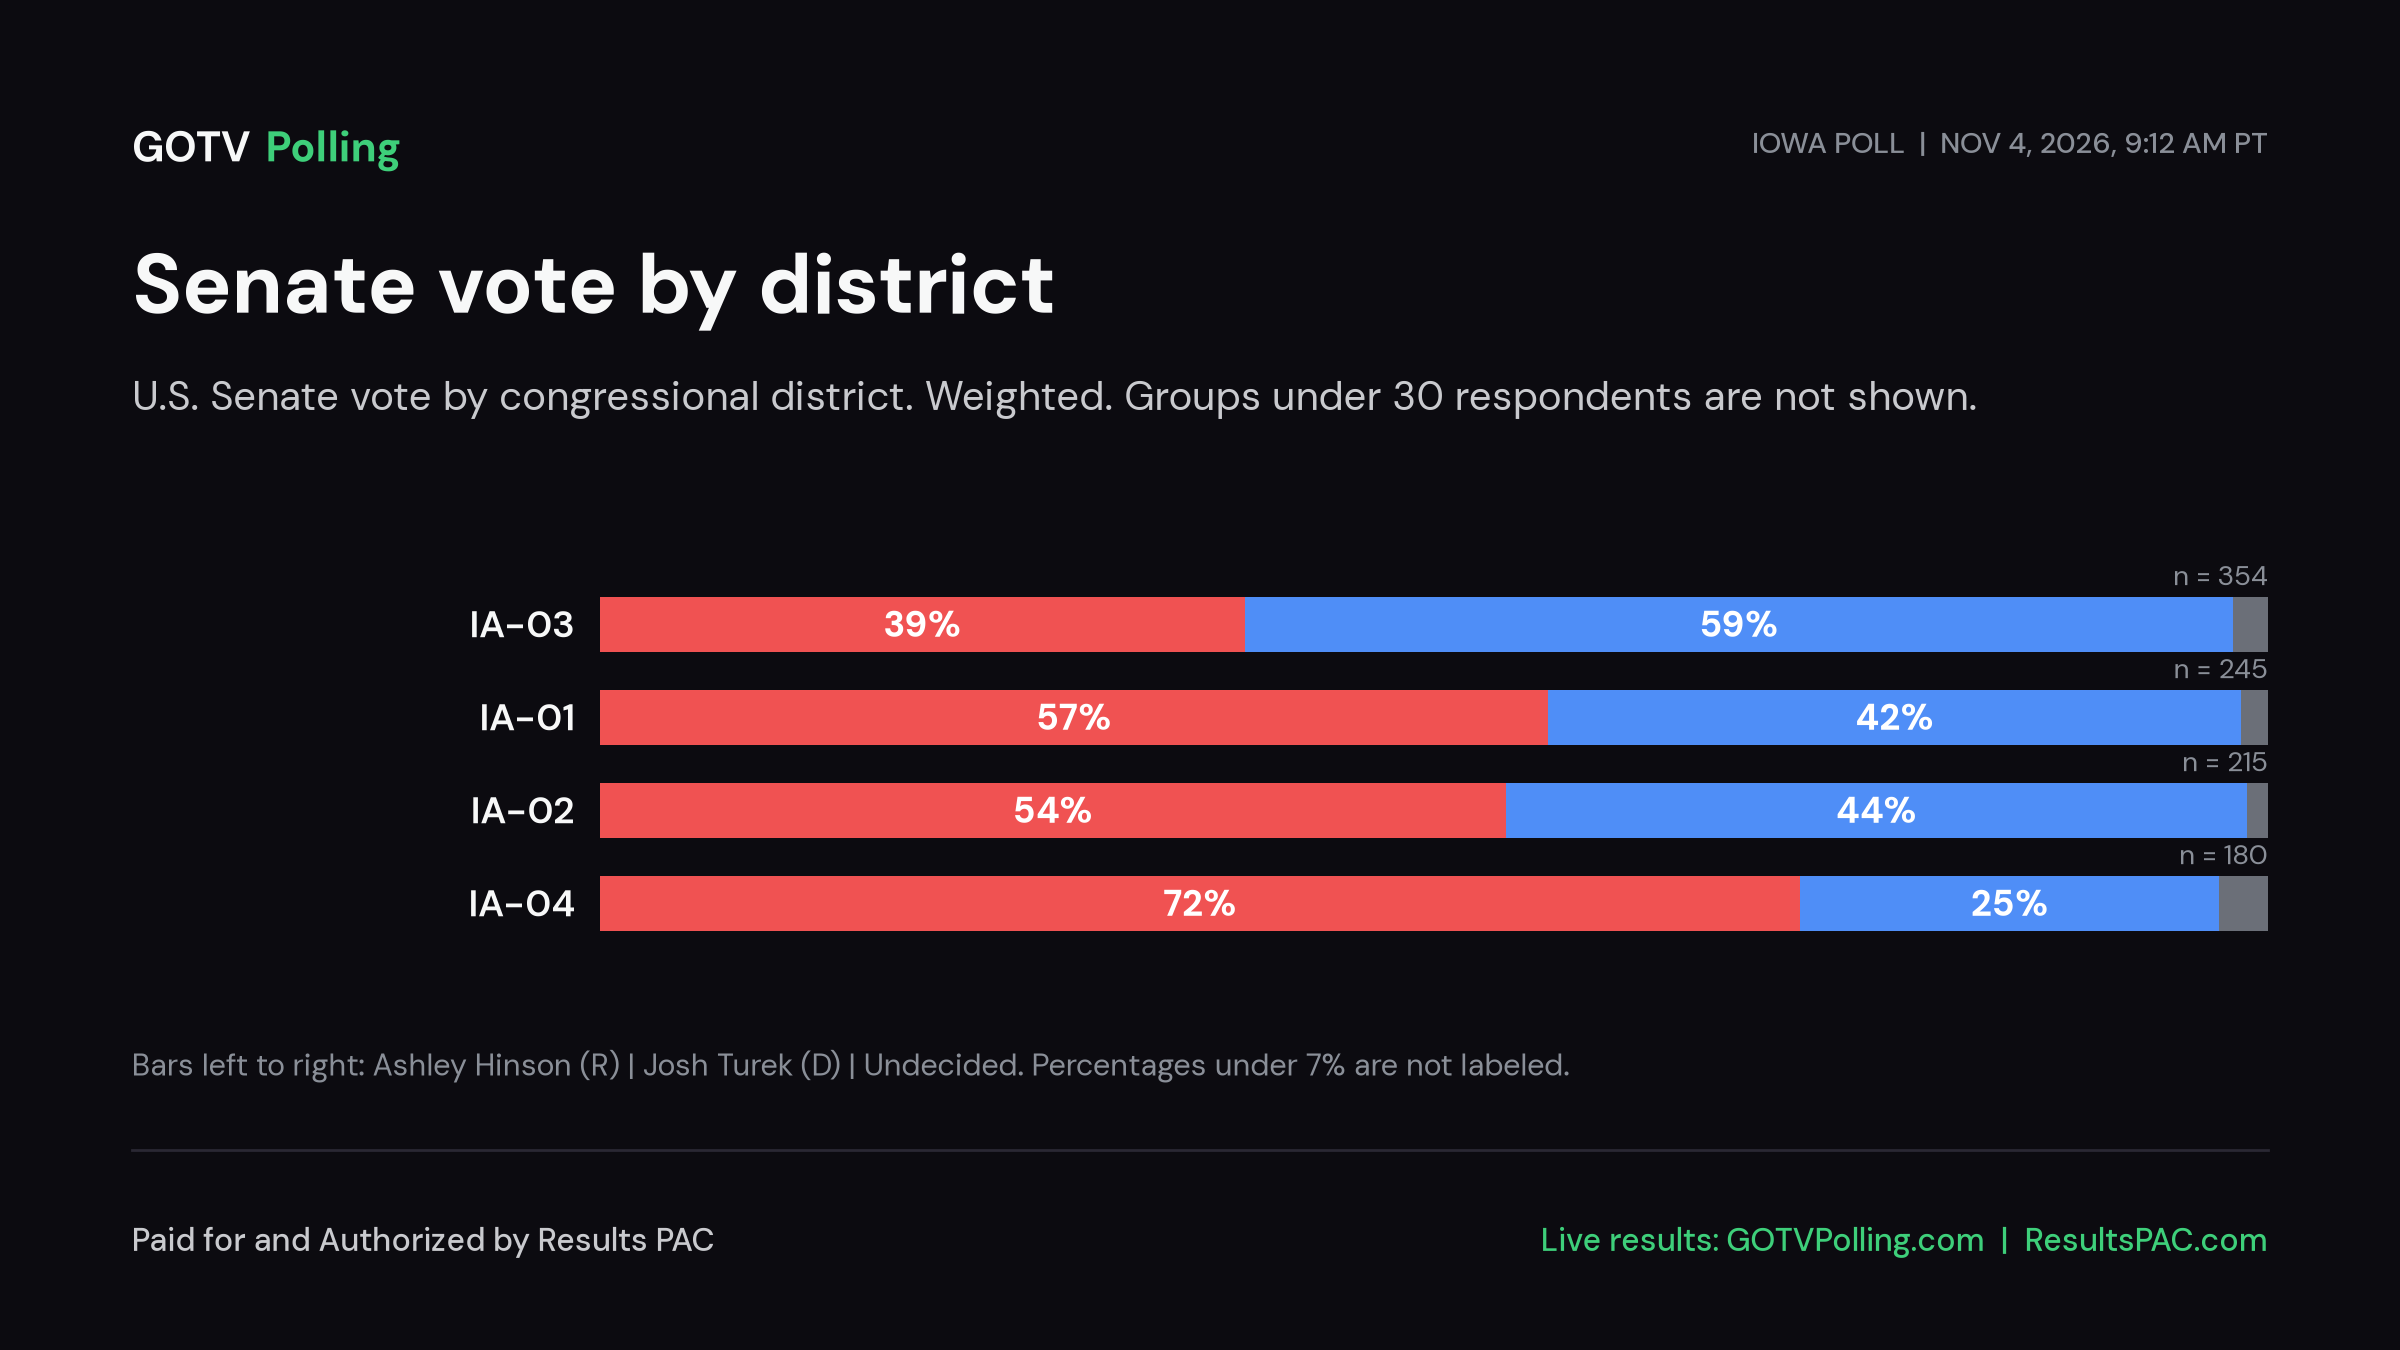
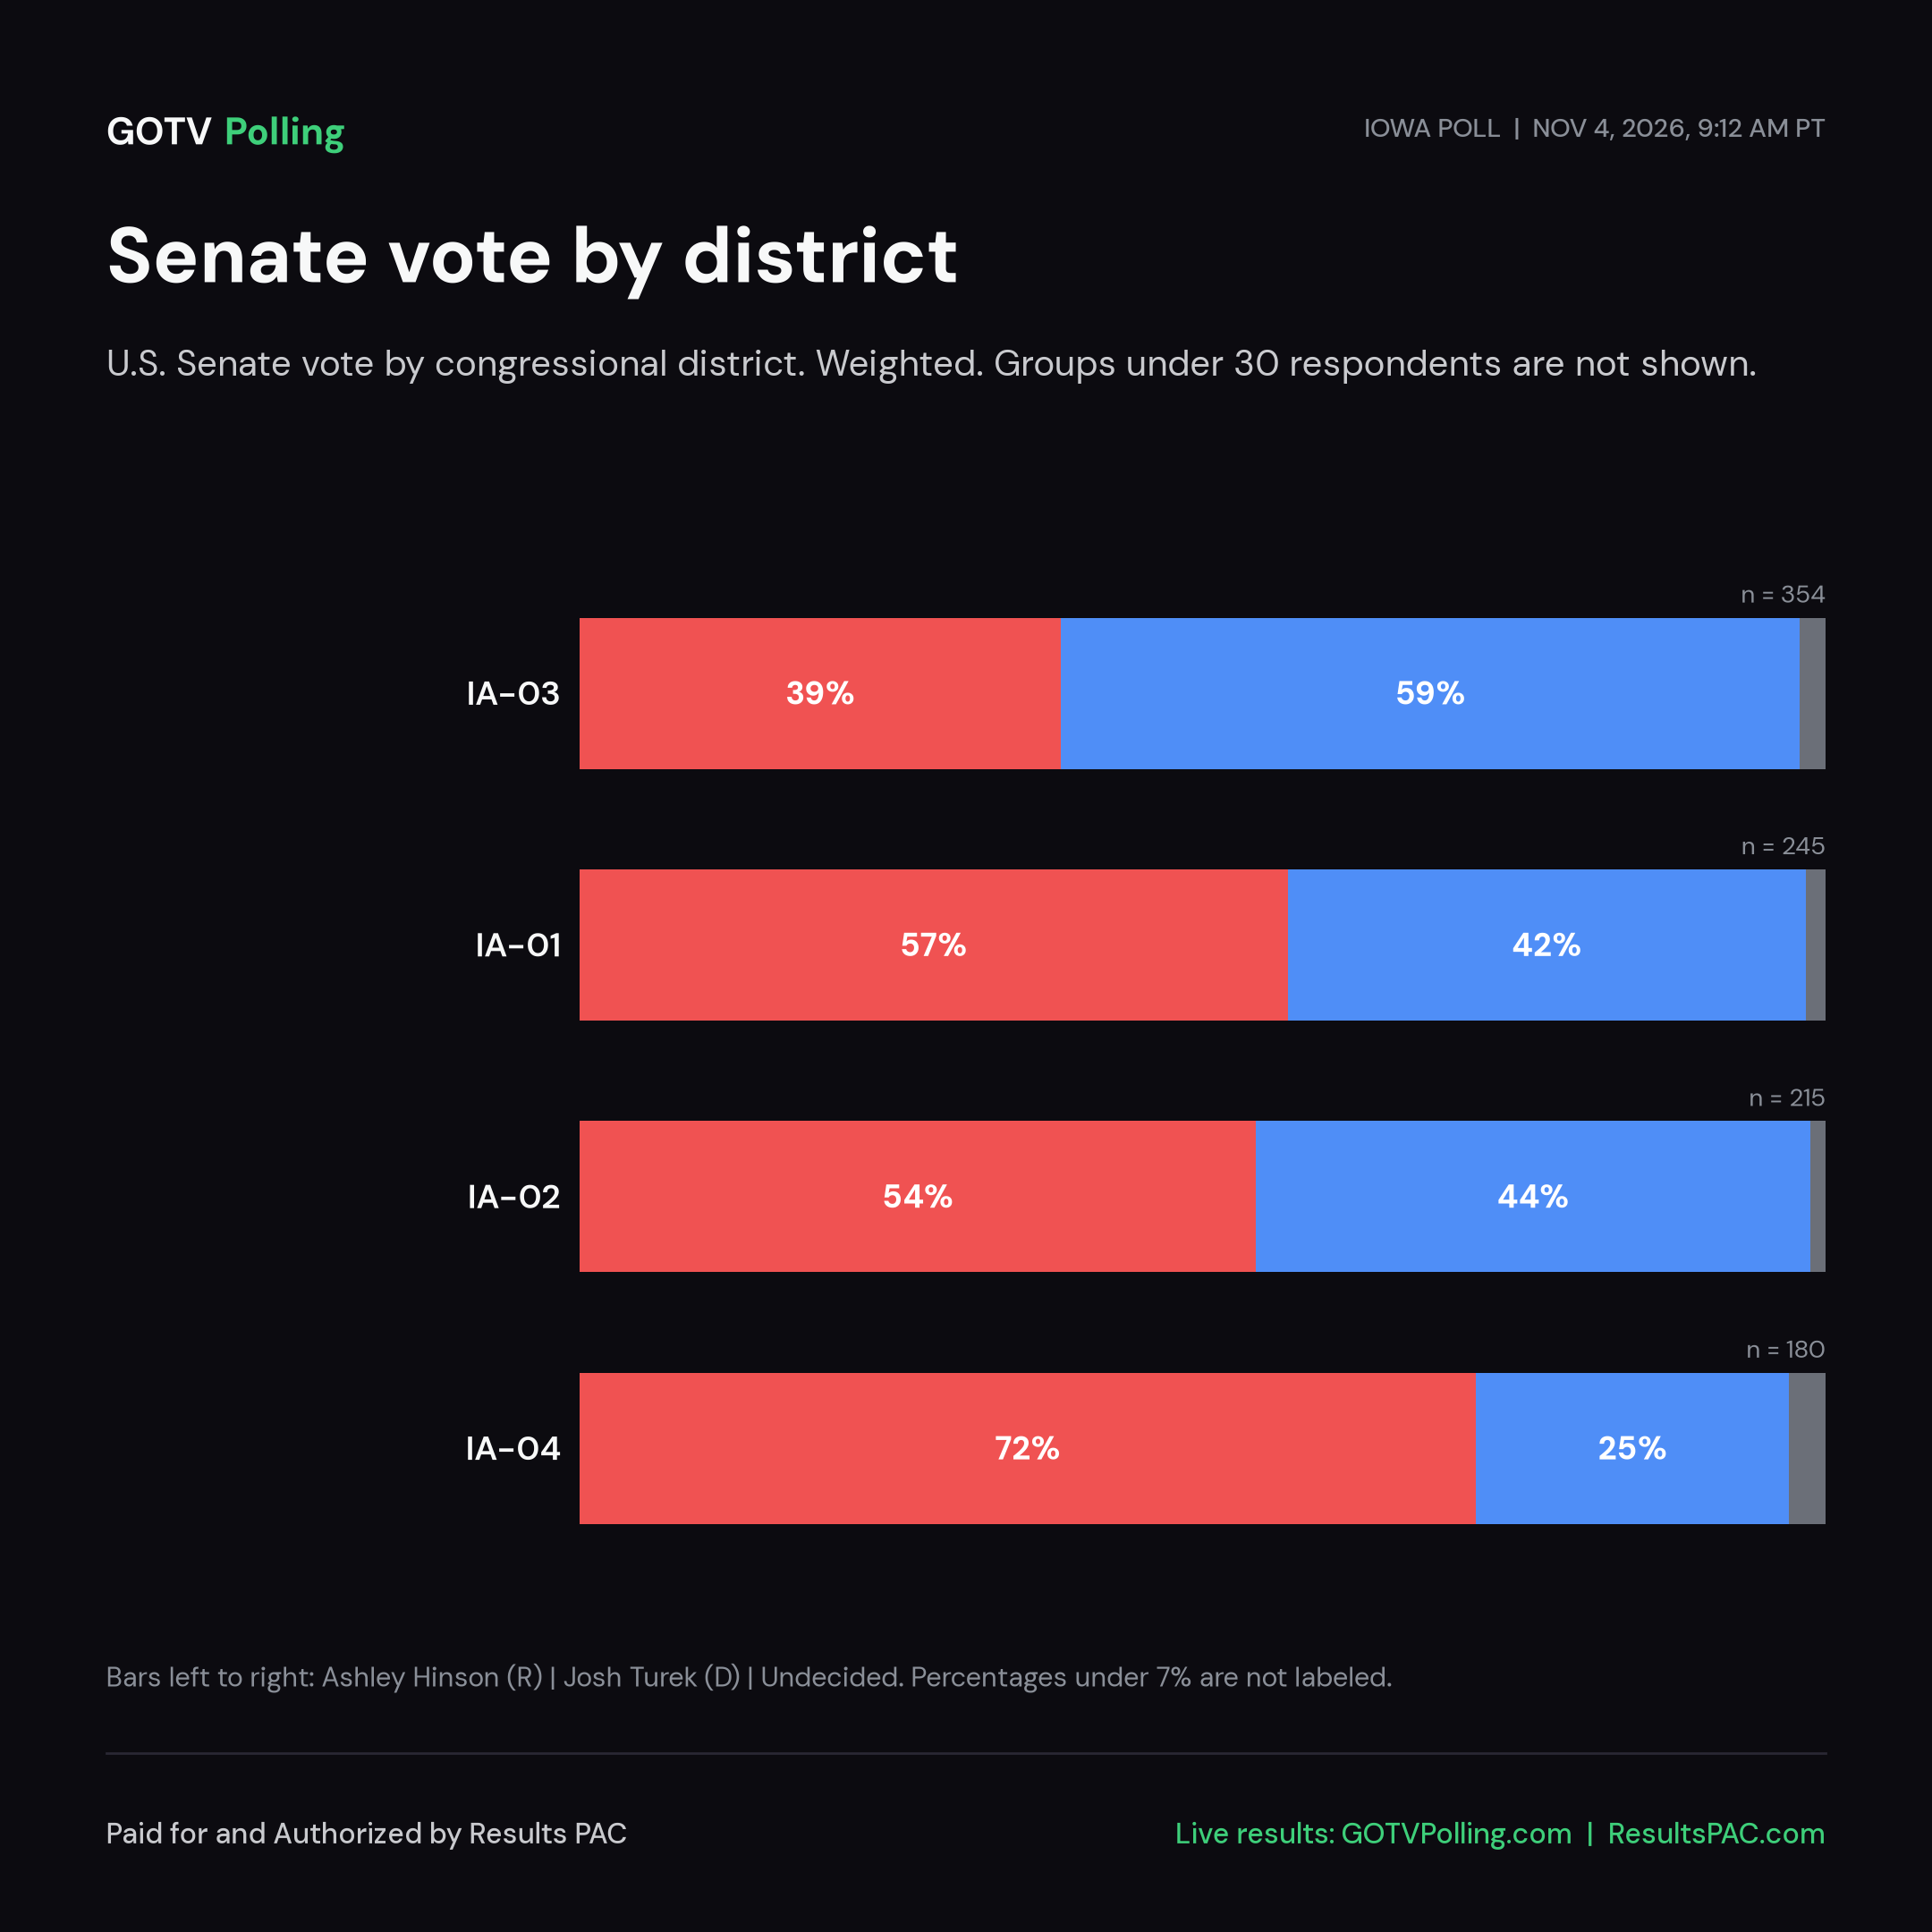
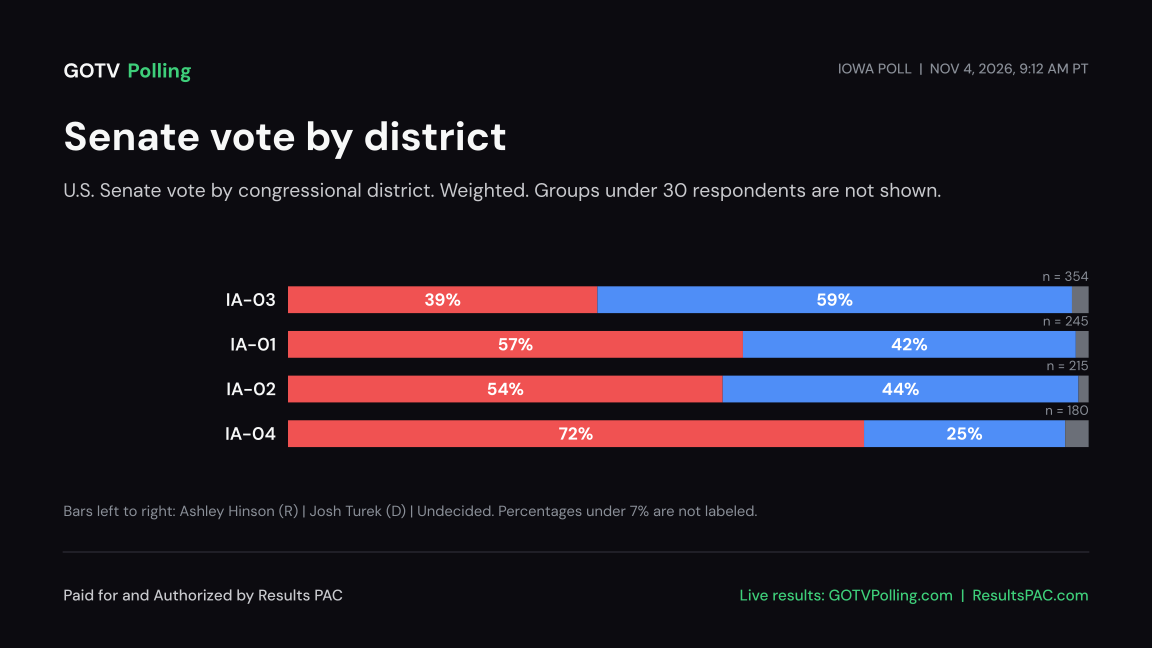
Top Line Poll Results LiveIA-01 U.S. House: Mariannette Miller-Meeks 51.9%, Christina Bohannan 45.3% (Miller-Meeks +6.6), n = 245245 respondents · MOE ±6.3 pts · weightedExpand to see more

U.S. House (IA-01) #IA01

RMariannette Miller-Meeks51.9%
DChristina Bohannan45.3%

n = 245, weighted. Undecided 2.7%

Methodology LiveIA-01: 245 respondents · MOE ±6.3 ptsFielding since October 30, 2026 · data as of Nov 3, 2026, 6:59 PM PTExpand to see more
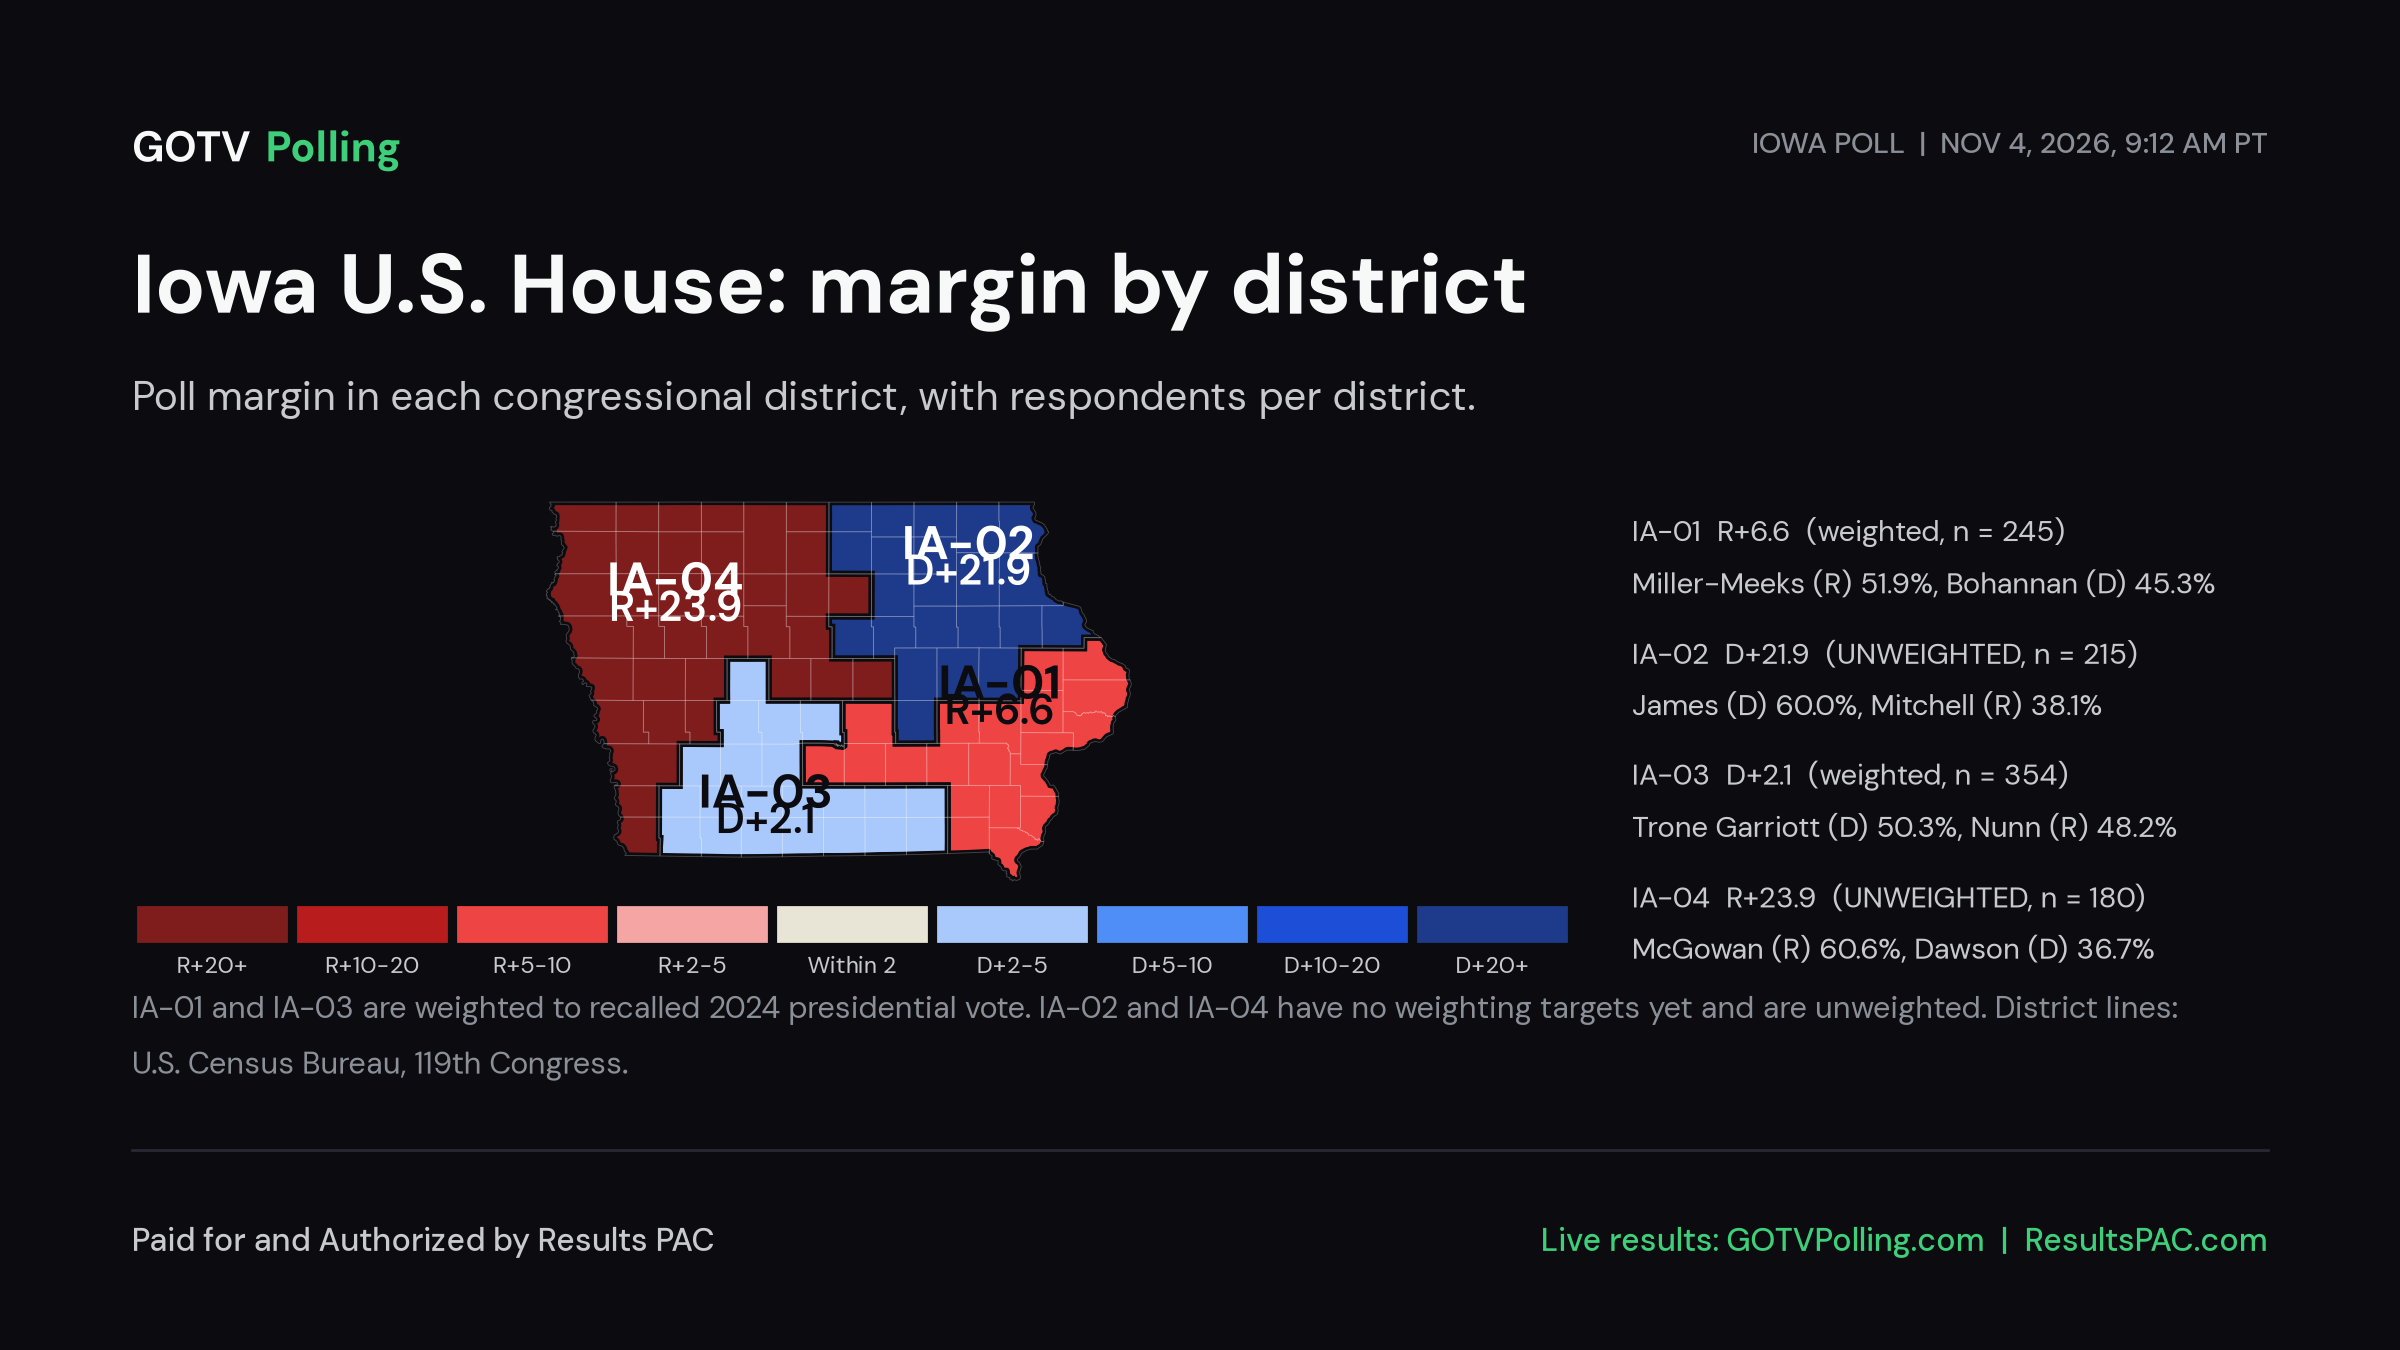
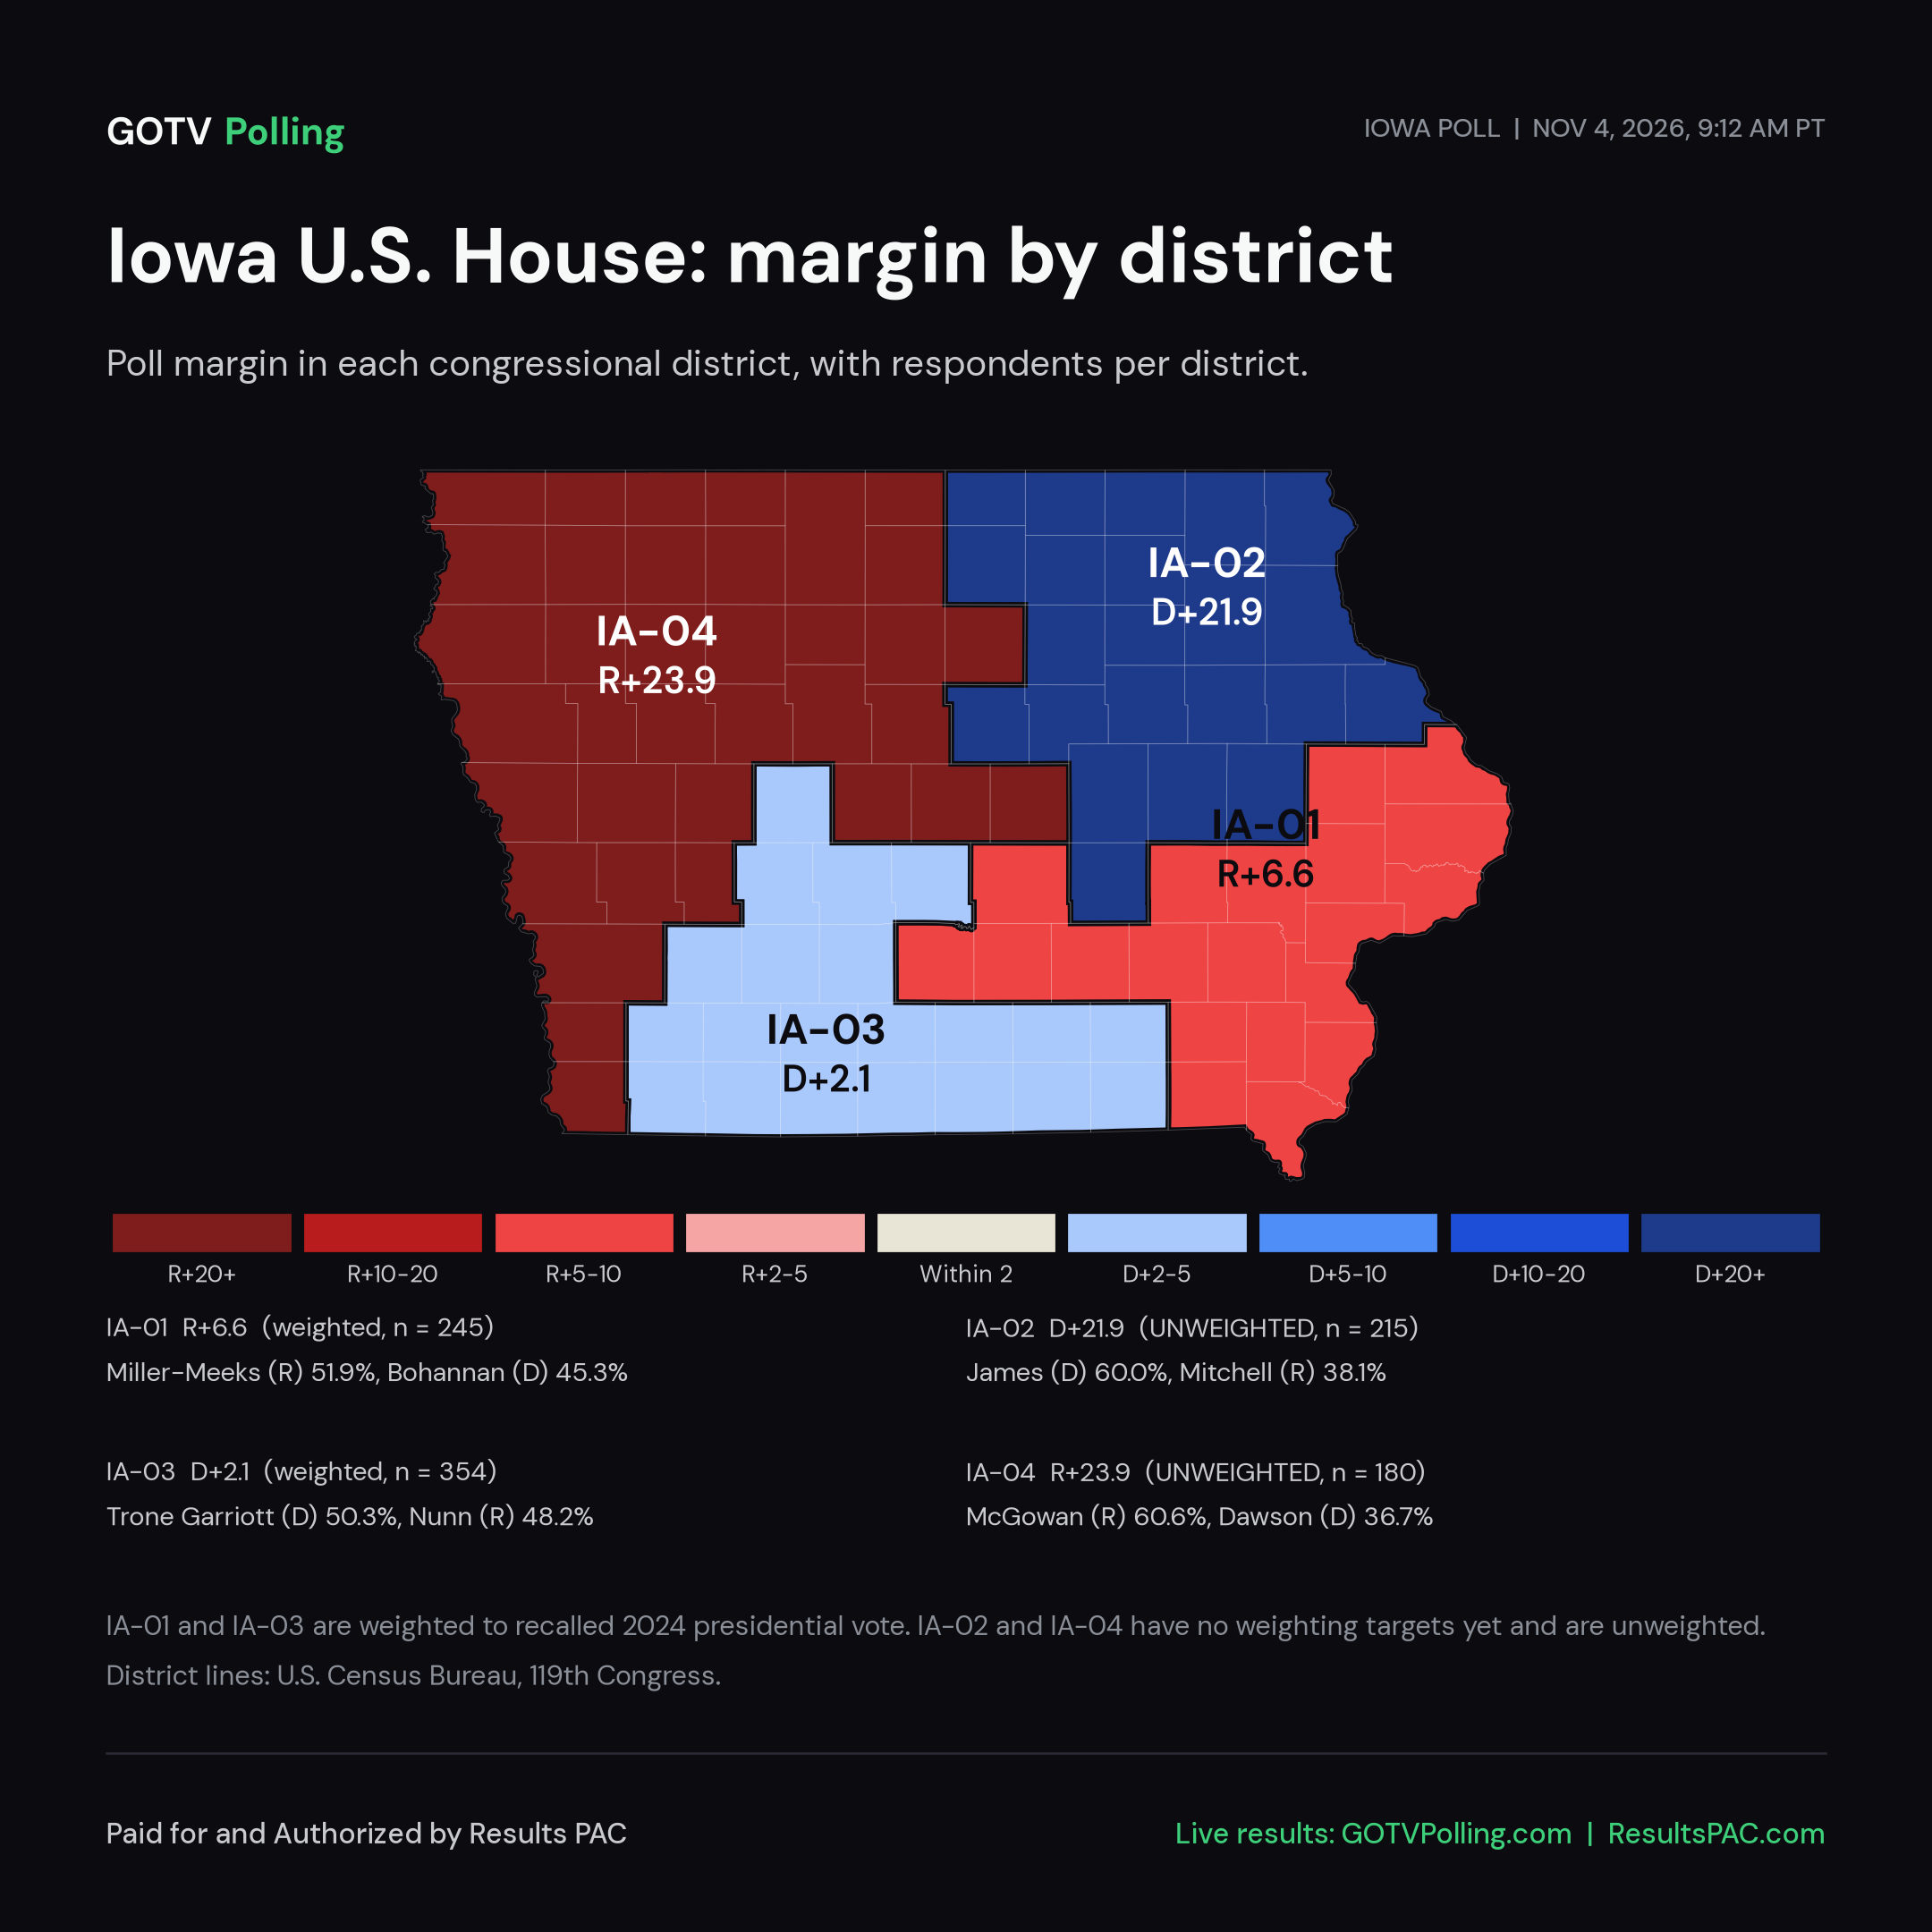
  • One poll covers all six races; this methodology is the same on every race page. Respondents and margin of error by race: IA-SEN (#IASEN): 994 respondents, MOE ±3.1 pts; IA-GOV (#IAGOV): 993 respondents, MOE ±3.1 pts; IA-01 (#IA01): 245 respondents, MOE ±6.3 pts; IA-02 (#IA02): 215 respondents, MOE ±6.7 pts; IA-03 (#IA03): 350 respondents, MOE ±5.2 pts; IA-04 (#IA04): 180 respondents, MOE ±7.3 pts.
  • Margin of error: plus or minus 3.1 points for the full sample (95% confidence); 3.3 with the design effect from weighting.
  • Mode: Text-to-web. Registered Iowa voters, matched to the voter file. Collection has closed.
  • Weighting: Weighted to the recalled 2024 presidential vote targets shown on this page (Trump, Harris, other). Region targets are not applied yet because respondents are placed by county only. Unweighted results and respondent counts are shown alongside.
  • Official release as of November 4, 2026, 9:12 AM PT.
  • Responses are still coming in. Results are published live on the GOTVPolling.com and ResultsPAC.com poll pages, and updated results, crosstabs, methodology and an expanded universe may be published from time to time.

Download methodology (as of now)

Crosstabs LiveParty registration: Democratic Bohannan 96%; Republican Miller-Meeks 85%Age: 65+ Bohannan 59%; 50-64 Bohannan 61%Expand to see more

U.S. House (IA-01) vote, unweighted, IA-01 respondents. Groups under 30 respondents are not shown.

Party registrationnChristina BohannanMariannette Miller-MeeksUndecided
Democratic13396.2%2.3%1.5%
Republican11011.8%84.5%3.6%
Non-Partisann too small
AgenChristina BohannanMariannette Miller-MeeksUndecided
65+18258.8%39.6%1.6%
50-644161.0%34.1%4.9%
35-49n too small
18-34n too small
SexnChristina BohannanMariannette Miller-MeeksUndecided
Men13048.5%49.2%2.3%
Women11569.6%27.8%2.6%

Download all crosstabs (CSV, as of now)

Graphics downloads for IA-01 #IA01

Poll results

Respondents (completed): 245. Last updated: Nov 3, 2:32 AM PT. Reload the page for the latest numbers while responses come in.

Toplines are weighted; unweighted shares and respondent counts are shown with each question. Margin of error for the full sample: plus or minus 6.3 points (unweighted, 95% confidence). Crosstab groups with fewer than 30 respondents are not shown.

U.S. House vote

Weighted shares among completed respondents who answered. n = 245.

  • Mariannette Miller-Meeks51.9%
  • Christina Bohannan45.3%
  • Undecided2.7%

Unweighted: Christina Bohannan 58.4%, Mariannette Miller-Meeks 39.2%, Undecided 2.4%.

Crosstabs (unweighted)
Party registrationnChristina BohannanMariannette Miller-MeeksUndecided
Democratic13396.2%2.3%1.5%
Republican11011.8%84.5%3.6%
Non-Partisann too small
AgenChristina BohannanMariannette Miller-MeeksUndecided
65+18258.8%39.6%1.6%
50-644161.0%34.1%4.9%
35-49n too small
18-34n too small
SexnChristina BohannanMariannette Miller-MeeksUndecided
Men13048.5%49.2%2.3%
Women11569.6%27.8%2.6%
EthnicitynChristina BohannanMariannette Miller-MeeksUndecided
European21857.3%39.9%2.8%
Not on filen too small
East and South Asiann too small
Likely African-Americann too small
Hispanic and Portuguesen too small

Weighting: Weighted to the recalled 2024 presidential vote targets shown on this page (Trump, Harris, other). Region targets are not applied yet because respondents are placed by county only. Unweighted results and respondent counts are shown alongside.

Candidates on the ballot

  • Christina Bohannan (D)
  • Michael Bridgford (I)
  • Mariannette Miller-Meeks (R)

Past results in this area

2024 President (R / D / other): 53.3% / 44.9% / 1.9%
2022 Governor: 55.0% / 42.6% (R / D)
Adults who speak Spanish at home: 3.1% (ACS 2020-2024 5-year, aggregated to current precincts)

Areas

AreaWeighting cellWeighting share2024 President R two-party2024 U.S. House R two-party2022 Governor R two-party2020 President R two-partySpanish at home (adults)
Johnson County: most Democratic third of precinctsC16.8%19.0%18.5%18.6%18.6%4.0%
Johnson County: middle third of precinctsC16.9%28.8%26.7%25.3%24.4%4.0%
Johnson County: most Republican third of precinctsC16.6%44.4%42.6%46.0%44.3%4.0%
Scott County: most Democratic third of precinctsC26.5%42.9%39.7%44.8%37.8%2.8%
Scott County: middle third of precinctsC26.7%50.2%47.3%54.3%47.7%2.8%
Scott County: most Republican third of precinctsC26.3%61.4%58.1%65.3%56.4%2.8%
Warren CountyC17.4%60.5%55.6%63.2%65.7%1.6%
Muscatine CountyC26.5%56.7%51.7%64.2%54.5%11.4%
Jasper CountyC15.4%63.4%57.5%63.9%50.1%2.4%
Clinton CountyC25.3%59.6%53.6%60.9%64.3%1.3%
Marion CountyC14.4%69.2%65.0%72.9%67.2%1.4%
Des_Moines CountyC24.1%52.2%46.0%54.6%48.6%1.5%
Lee, Cedar, Washington (combined)C29.0%61.2%56.4%63.4%61.1%2.3%
Other counties: middle thirdC19.2%65.6%59.7%68.8%61.9%1.8%
Other counties: most Republican thirdC19.0%76.1%69.9%74.2%73.0%3.2%

Areas are counties; large counties are split into thirds of precincts by 2024 presidential lean, and small counties are pooled. Past results are certified results. Spanish at home is the county figure (within this district for House races) from the ACS 2020-2024 5-year estimates, so the three thirds of one county show the same value.

Weighting cells

  • C1: Johnson County: most Democratic third of precincts; Johnson County: middle third of precincts; Johnson County: most Republican third of precincts; Warren County; Jasper County; Marion County; Other counties: middle third; Other counties: most Republican third
  • C2: Scott County: most Democratic third of precincts; Scott County: middle third of precincts; Scott County: most Republican third of precincts; Muscatine County; Clinton County; Des_Moines County; Lee, Cedar, Washington (combined)

Weighting targets

VariableCategoryTarget
RegionJohnson County: most Democratic third of precincts6.8%
RegionJohnson County: middle third of precincts6.9%
RegionJohnson County: most Republican third of precincts6.6%
RegionScott County: most Democratic third of precincts6.5%
RegionScott County: middle third of precincts6.7%
RegionScott County: most Republican third of precincts6.3%
RegionWarren County7.4%
RegionMuscatine County6.5%
RegionJasper County5.4%
RegionClinton County5.3%
RegionMarion County4.4%
RegionDes_Moines County4.1%
RegionLee, Cedar, Washington (combined)9.0%
RegionOther counties: middle third9.2%
RegionOther counties: most Republican third9.0%
Recalled 2024 voteTrump53.5%
Recalled 2024 voteHarris44.6%
Recalled 2024 voteOther1.8%
Age x gender (adults)M_18_2911.0%
Age x gender (adults)M_30_4412.3%
Age x gender (adults)M_45_6415.6%
Age x gender (adults)M_65p10.8%
Age x gender (adults)F_18_2910.5%
Age x gender (adults)F_30_4411.8%
Age x gender (adults)F_45_6415.3%
Age x gender (adults)F_65p12.6%

ZIP code key

Show 253 ZIP codes and their areas
ZIPAreaAlso in
50001Warren County
50027Other counties: most Republican third
50028Jasper County
50044Marion CountyS15 46%
50047Warren County
50049Marion County
50054Jasper County
50055Jasper County
50057Marion County
50061Warren County
50062Marion County
50104Other counties: most Republican third
50112Jasper County
50116Marion County
50118Warren County
50119Marion County
50125Warren County
50127Jasper County
50135Jasper County
50136Other counties: most Republican third
50137Jasper County
50138Marion County
50139Warren CountyS11 46%
50141Jasper County
50143Other counties: most Republican third
50145Warren County
50150Marion County
50151Warren County
50153Jasper CountyS15 6%
50160Warren County
50161Jasper County
50162Jasper County
50163Marion County
50166Warren County
50168Jasper County
50170Jasper CountyS11 17%
50171Other counties: most Republican third
50207Other counties: most Republican third
50208Jasper County
50210Warren County
50211Warren County
50214Marion County
50219Marion CountyS15 8%
50225Marion CountyS07 8%
50228Jasper CountyS11 6%
50229Warren County
50232Jasper County
50234Jasper County
50237Jasper CountyS11 24%
50240Warren County
50241Warren County
50251Jasper County
50252Marion CountyS07 34%
50255Other counties: most Republican third
50256Marion CountyS15 26%
50257Warren County
50265Warren County
50268Other counties: most Republican third
50320Warren County
52030Other counties: middle third
52031Other counties: middle third
52032Other counties: middle third
52033Other counties: middle third
52037Clinton County
52054Other counties: middle third
52060Other counties: middle third
52064Other counties: middle thirdS10 13%
52069Other counties: middle thirdS10 18%
52070Other counties: middle thirdS10 12%
52071Other counties: middle third
52074Other counties: middle third
52075Other counties: middle third
52079Other counties: middle third
52201Lee, Cedar, Washington (combined)
52203Other counties: middle thirdS03 34%
52205Other counties: middle third
52207Other counties: middle thirdS10 11%
52208Other counties: middle third
52209Other counties: middle third
52212Other counties: middle third
52216Lee, Cedar, Washington (combined)S14 10%
52220Other counties: middle third
52221Other counties: middle third
52222Other counties: middle third
52227Johnson County: most Republican third of precincts
52228Johnson County: most Republican third of precincts
52231Other counties: most Republican third
52235Johnson County: most Republican third of precincts
52236Other counties: middle third
52237Other counties: middle third
52240Johnson County: most Democratic third of precinctsS02 39%; S03 17%
52241Johnson County: middle third of precinctsS01 28%
52242Johnson County: middle third of precinctsS03 34%; S01 9%
52245Johnson County: most Democratic third of precinctsS02 23%
52246Johnson County: most Democratic third of precinctsS02 30%; S03 6%
52247Lee, Cedar, Washington (combined)S03 21%
52248Other counties: most Republican thirdS13 44%
52251Other counties: middle third
52252Other counties: middle third
52253Lee, Cedar, Washington (combined)S14 14%; S03 7%
52254Clinton County
52255Lee, Cedar, Washington (combined)
52301Other counties: middle third
52305Other counties: middle third
52306Lee, Cedar, Washington (combined)S14 13%
52307Other counties: middle third
52309Other counties: middle third
52310Other counties: middle third
52316Other counties: middle thirdS15 9%
52317Johnson County: most Republican third of precinctsS02 43%
52318Other counties: middle third
52320Other counties: middle thirdS13 9%
52321Other counties: middle third
52322Johnson County: most Republican third of precincts
52323Other counties: middle thirdS13 12%; S10 12%
52325Other counties: middle thirdS03 17%
52327Lee, Cedar, Washington (combined)S03 18%
52333Johnson County: most Republican third of precincts
52334Other counties: middle third
52335Other counties: most Republican third
52337Lee, Cedar, Washington (combined)
52338Johnson County: most Republican third of precincts
52340Johnson County: most Republican third of precincts
52347Other counties: middle third
52353Lee, Cedar, Washington (combined)
52355Other counties: most Republican thirdS14 5%
52356Lee, Cedar, Washington (combined)S14 12%; S03 8%
52358Lee, Cedar, Washington (combined)S03 9%
52359Lee, Cedar, Washington (combined)
52361Other counties: middle third
52362Other counties: middle third
52404Johnson County: most Republican third of precincts
52501Other counties: most Republican third
52533Other counties: most Republican third
52534Other counties: most Republican third
52535Other counties: most Republican third
52540Other counties: most Republican thirdS13 48%
52542Other counties: most Republican third
52543Other counties: most Republican third
52550Other counties: most Republican third
52551Other counties: most Republican third
52553Other counties: most Republican third
52554Other counties: most Republican third
52556Other counties: most Republican third
52561Other counties: most Republican third
52562Other counties: most Republican third
52563Other counties: most Republican third
52565Other counties: most Republican third
52567Other counties: most Republican third
52568Other counties: most Republican third
52570Other counties: most Republican third
52573Other counties: most Republican third
52576Other counties: most Republican third
52577Other counties: most Republican third
52580Other counties: most Republican third
52585Other counties: most Republican thirdS13 7%
52586Other counties: most Republican third
52588Other counties: most Republican third
52591Other counties: most Republican third
52595Other counties: most Republican third
52601Des_Moines County
52620Other counties: most Republican third
52621Lee, Cedar, Washington (combined)S15 13%
52623Other counties: middle third
52625Lee, Cedar, Washington (combined)
52626Other counties: most Republican third
52627Lee, Cedar, Washington (combined)
52630Other counties: most Republican thirdS14 50%
52632Lee, Cedar, Washington (combined)
52635Other counties: most Republican thirdS14 6%
52638Des_Moines County
52640Other counties: most Republican third
52641Other counties: middle third
52644Other counties: middle third
52645Other counties: middle third
52646Other counties: most Republican third
52647Other counties: middle third
52649Other counties: middle thirdS13 18%
52651Other counties: most Republican third
52652Other counties: middle third
52653Other counties: most Republican third
52654Lee, Cedar, Washington (combined)S14 33%
52655Des_Moines County
52656Lee, Cedar, Washington (combined)
52657Lee, Cedar, Washington (combined)
52658Des_Moines County
52659Other counties: middle thirdS15 37%
52701Clinton County
52720Muscatine CountyS13 30%
52721Lee, Cedar, Washington (combined)
52722Scott County: middle third of precinctsS06 29%; S04 10%
52726Scott County: most Republican third of precincts
52727Clinton County
52728Scott County: most Republican third of precincts
52729Clinton County
52730Clinton County
52731Clinton County
52732Clinton County
52737Other counties: most Republican third
52738Other counties: most Republican third
52739Other counties: most Republican thirdS08 47%
52742Clinton County
52745Scott County: most Republican third of precincts
52746Scott County: most Republican third of precincts
52747Lee, Cedar, Washington (combined)S06 31%
52748Scott County: most Republican third of precincts
52749Muscatine County
52750Clinton County
52751Clinton County
52752Other counties: most Republican third
52753Scott County: most Republican third of precincts
52754Other counties: most Republican third
52755Johnson County: most Republican third of precinctsS15 6%
52756Scott County: most Republican third of precincts
52757Clinton County
52758Scott County: most Republican third of precincts
52760Muscatine CountyS13 33%
52761Muscatine County
52765Scott County: most Republican third of precinctsS13 28%
52766Muscatine CountyS03 7%
52767Scott County: most Republican third of precincts
52768Scott County: most Republican third of precincts
52769Scott County: most Republican third of precincts
52771Clinton County
52772Lee, Cedar, Washington (combined)
52773Scott County: most Republican third of precincts
52774Clinton County
52776Muscatine CountyS13 11%
52777Clinton CountyS13 10%
52778Muscatine CountyS13 34%
52801Scott County: most Democratic third of precincts
52802Scott County: most Republican third of precinctsS04 47%
52803Scott County: most Democratic third of precincts
52804Scott County: most Democratic third of precinctsS05 31%; S06 23%
52806Scott County: middle third of precinctsS04 46%; S06 8%
52807Scott County: middle third of precinctsS04 31%; S06 26%
61041Other counties: middle third
61074Other counties: middle third
61201Scott County: most Democratic third of precincts
61242Scott County: most Republican third of precinctsS10 34%
61244Scott County: most Republican third of precincts
61252Clinton County
61256Scott County: most Republican third of precincts
61259Muscatine County
61264Scott County: most Republican third of precincts
61272Other counties: most Republican third
61275Scott County: most Republican third of precincts
61285Clinton County
61425Des_Moines County
61437Des_Moines County
62341Lee, Cedar, Washington (combined)
62379Lee, Cedar, Washington (combined)
63430Lee, Cedar, Washington (combined)

Respondents give a ZIP code, which places each response in an area. No names or addresses are collected.

Voting history of respondents: U.S. House IA-01 (#IA01)

Aggregate results only. Groups under 30 respondents are held back. All respondents are high-turnout voters who voted in each of the last four general elections.

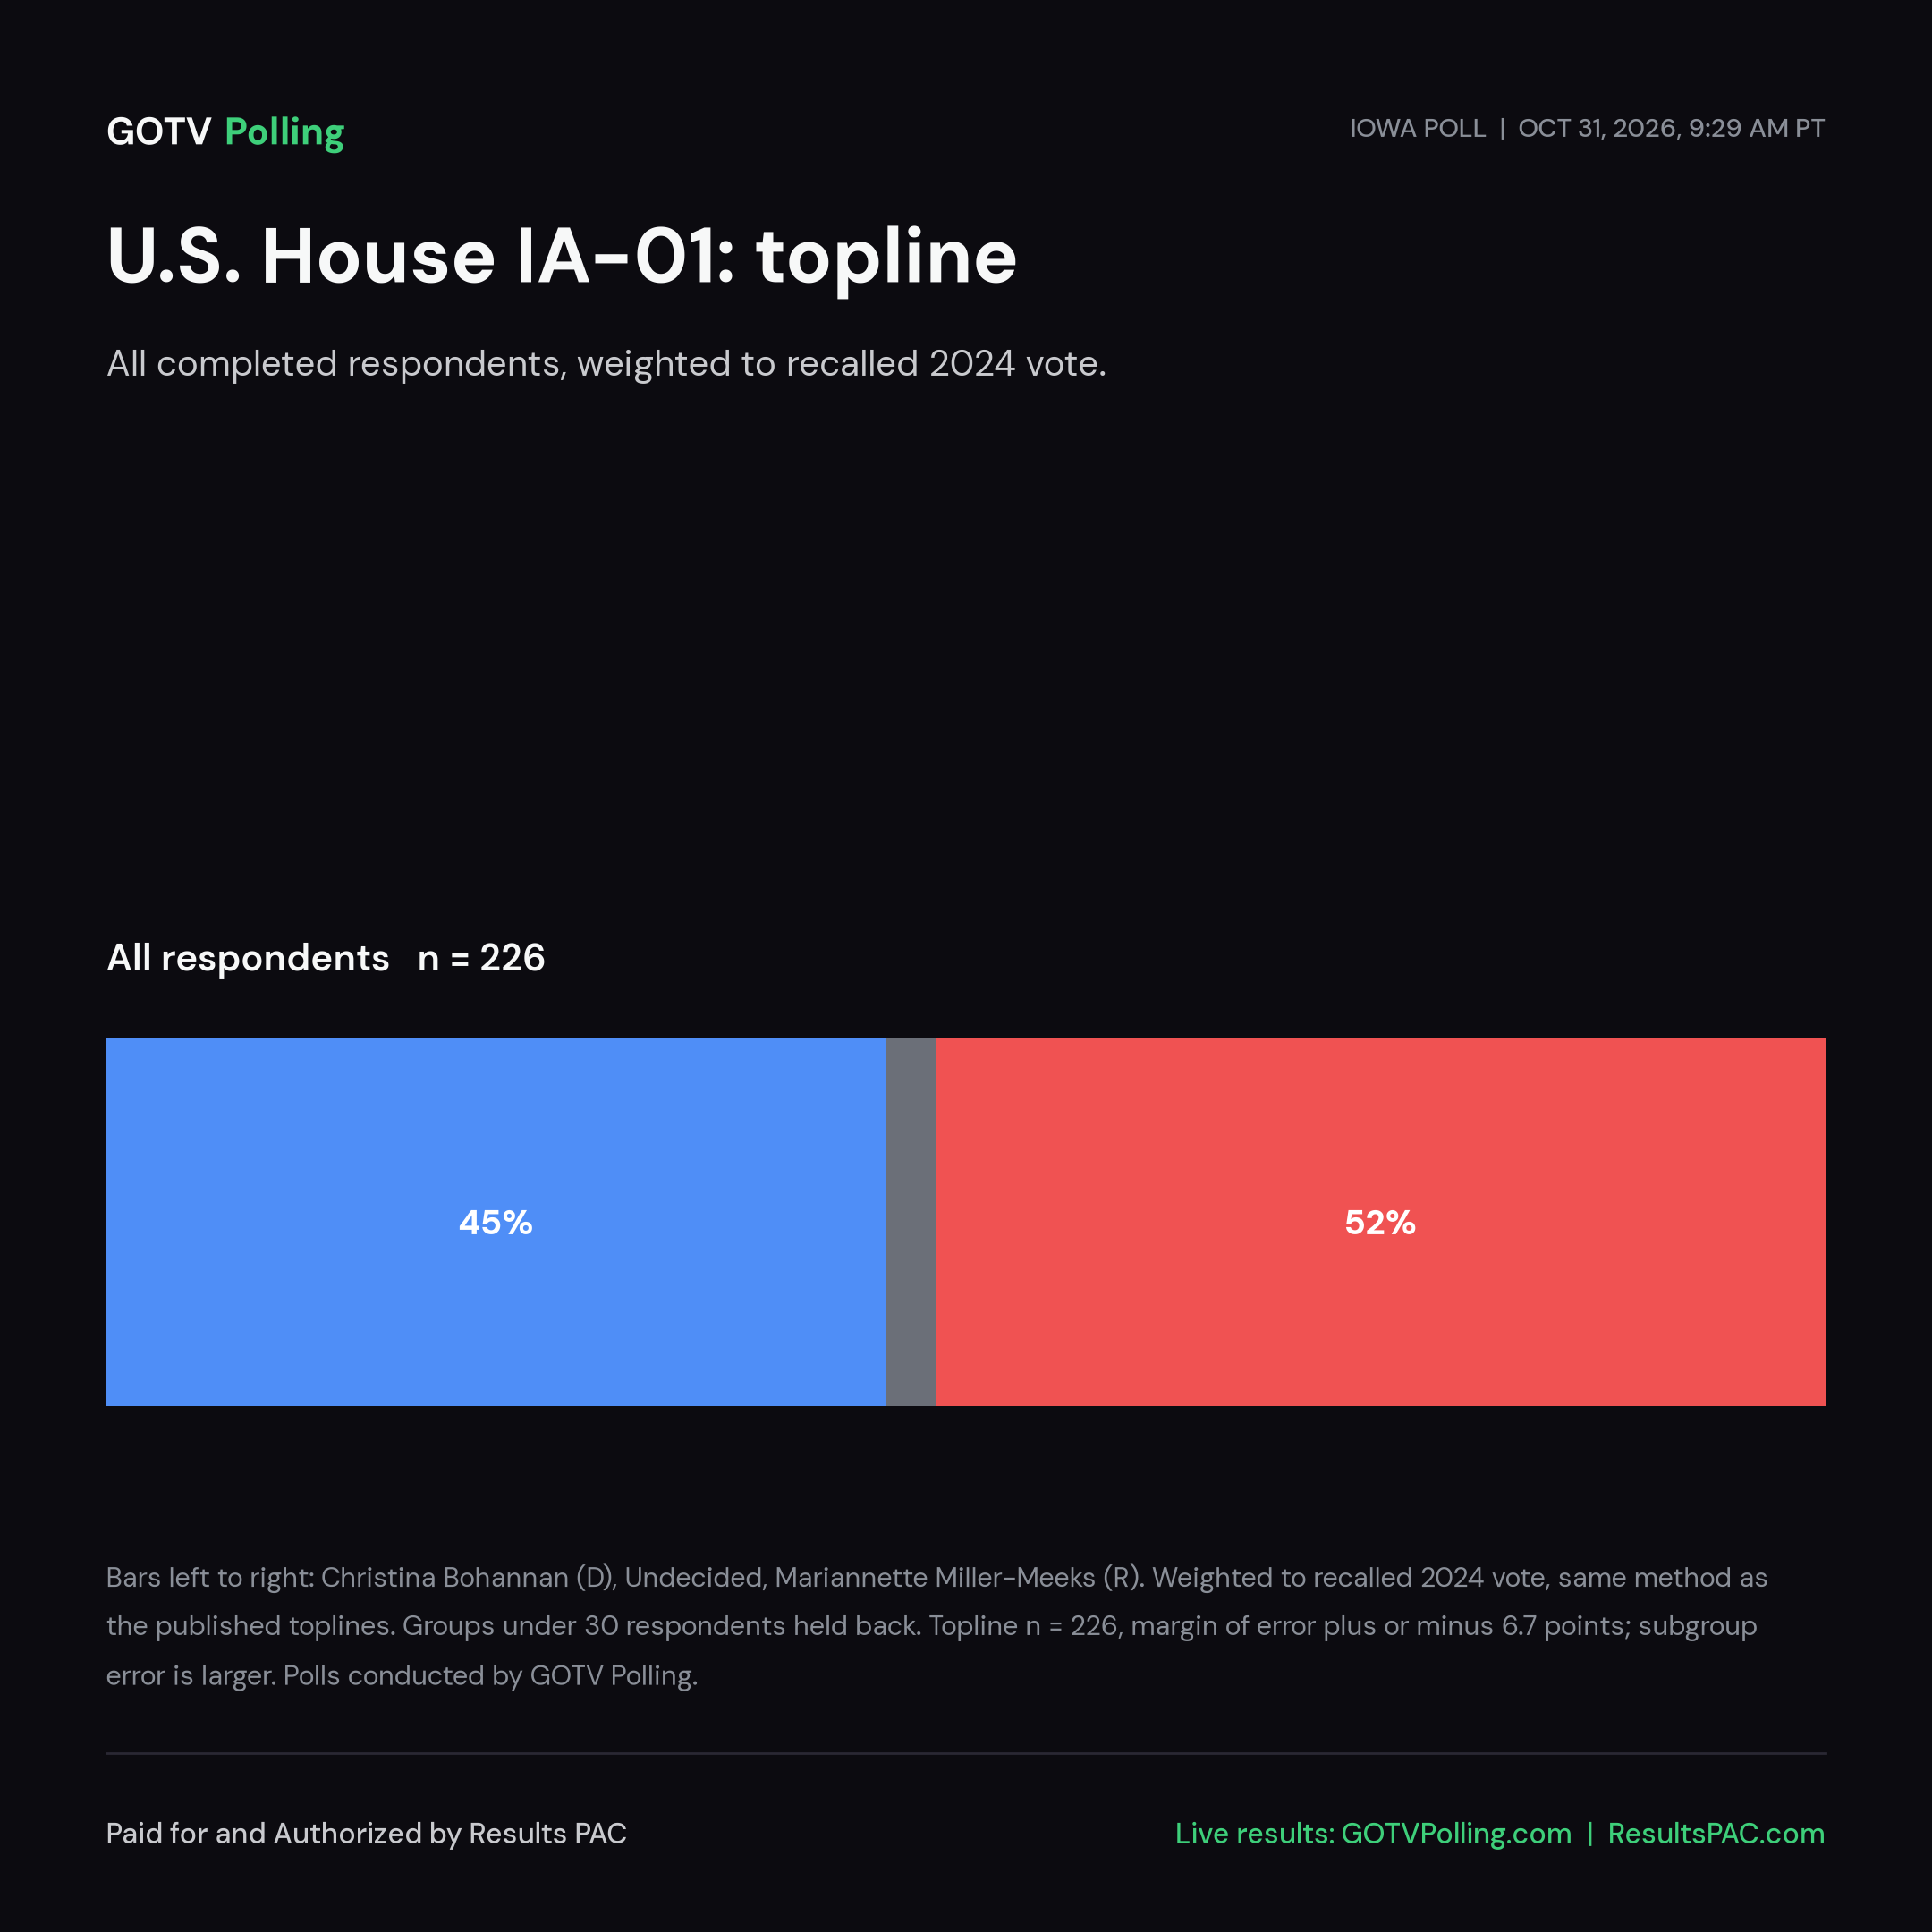
Sample: 226 completed respondents answered the U.S. House IA-01 question (published topline n). Margin of error plus or minus 6.7 points at 95% confidence (including the weighting design effect). Weighted to recalled 2024 presidential vote, the same method as the published toplines. Voting history comes from the voter file record matched to each respondent (226 of 226 matched). All numbers are polling aggregates. Any group with fewer than 30 respondents is held back. Subgroup margins of error are larger than the topline.

Published topline: Mariannette Miller-Meeks 51.8%, Christina Bohannan 45.3%, Undecided 2.9%.

Who answered: voting history profile

  • Every respondent voted in the 2018, 2020, 2022 and 2024 general elections (all of the last four). These are high-turnout voters, not all registered voters, so these results describe the most reliable part of the electorate.
  • New vs habitual: voters who did not vote in the 2016 general (newer voters) number under 30 and are held back; everyone else is a long-run habitual voter. A new-voter comparison is not possible from this sample.

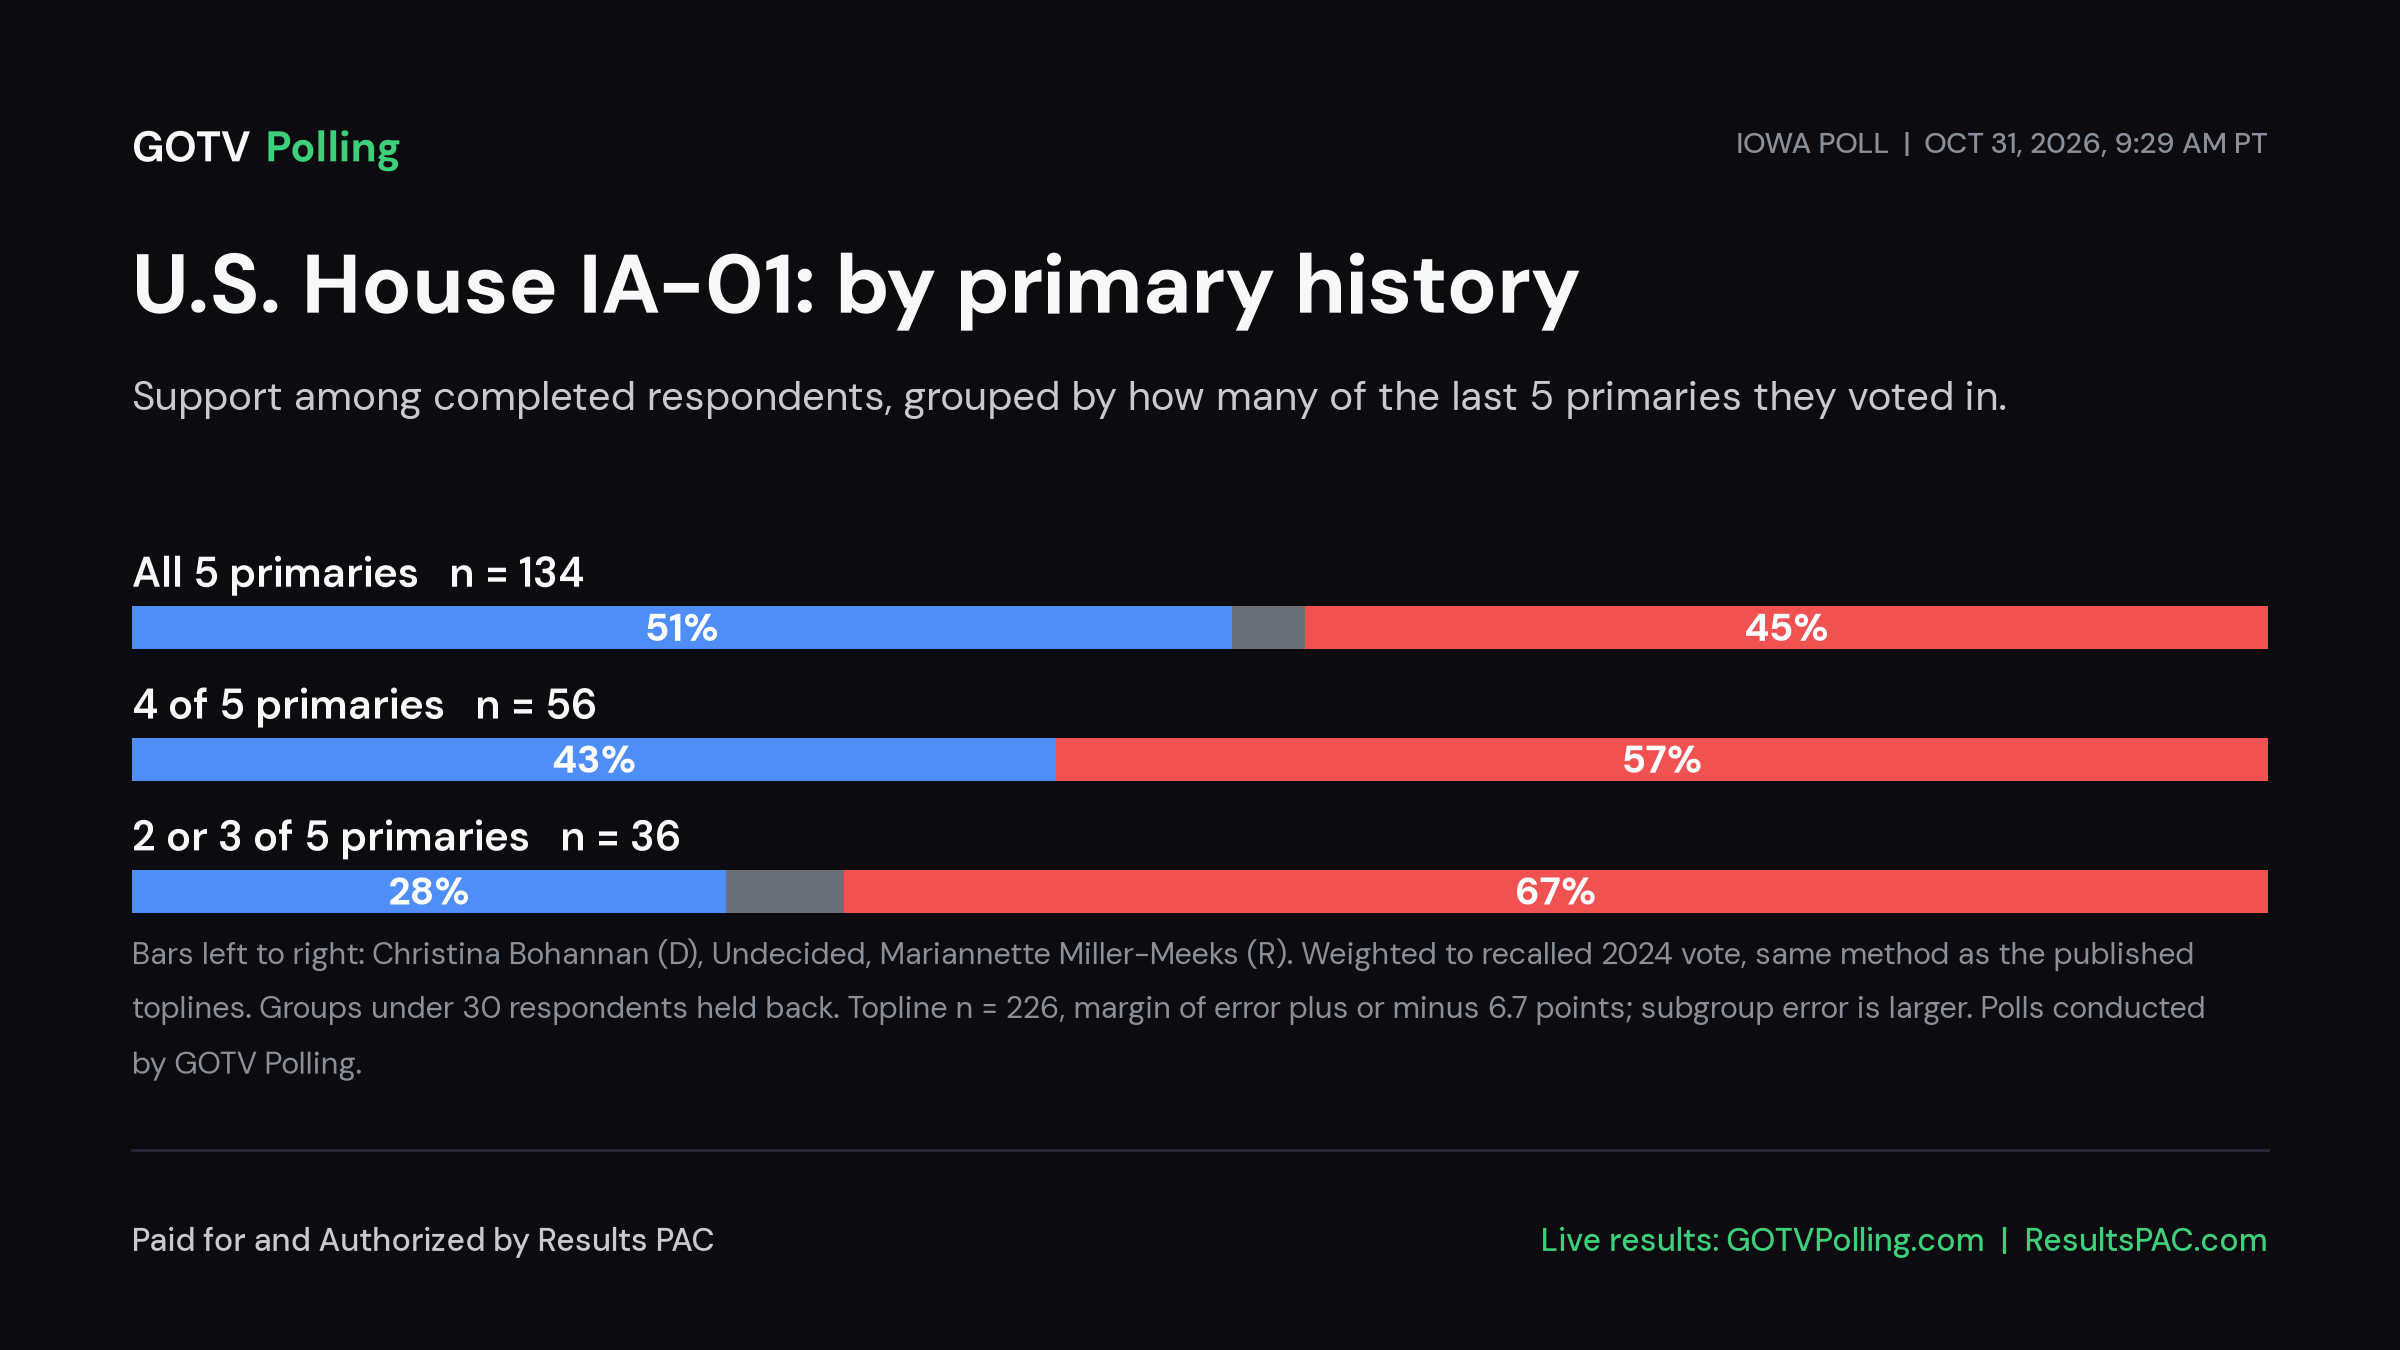
Primary participation, 2018 to 2026 (of 5):

GroupRespondentsShare
All 5 primaries13459%
4 of 5 primaries5625%
2 or 3 of 5 primaries3616%

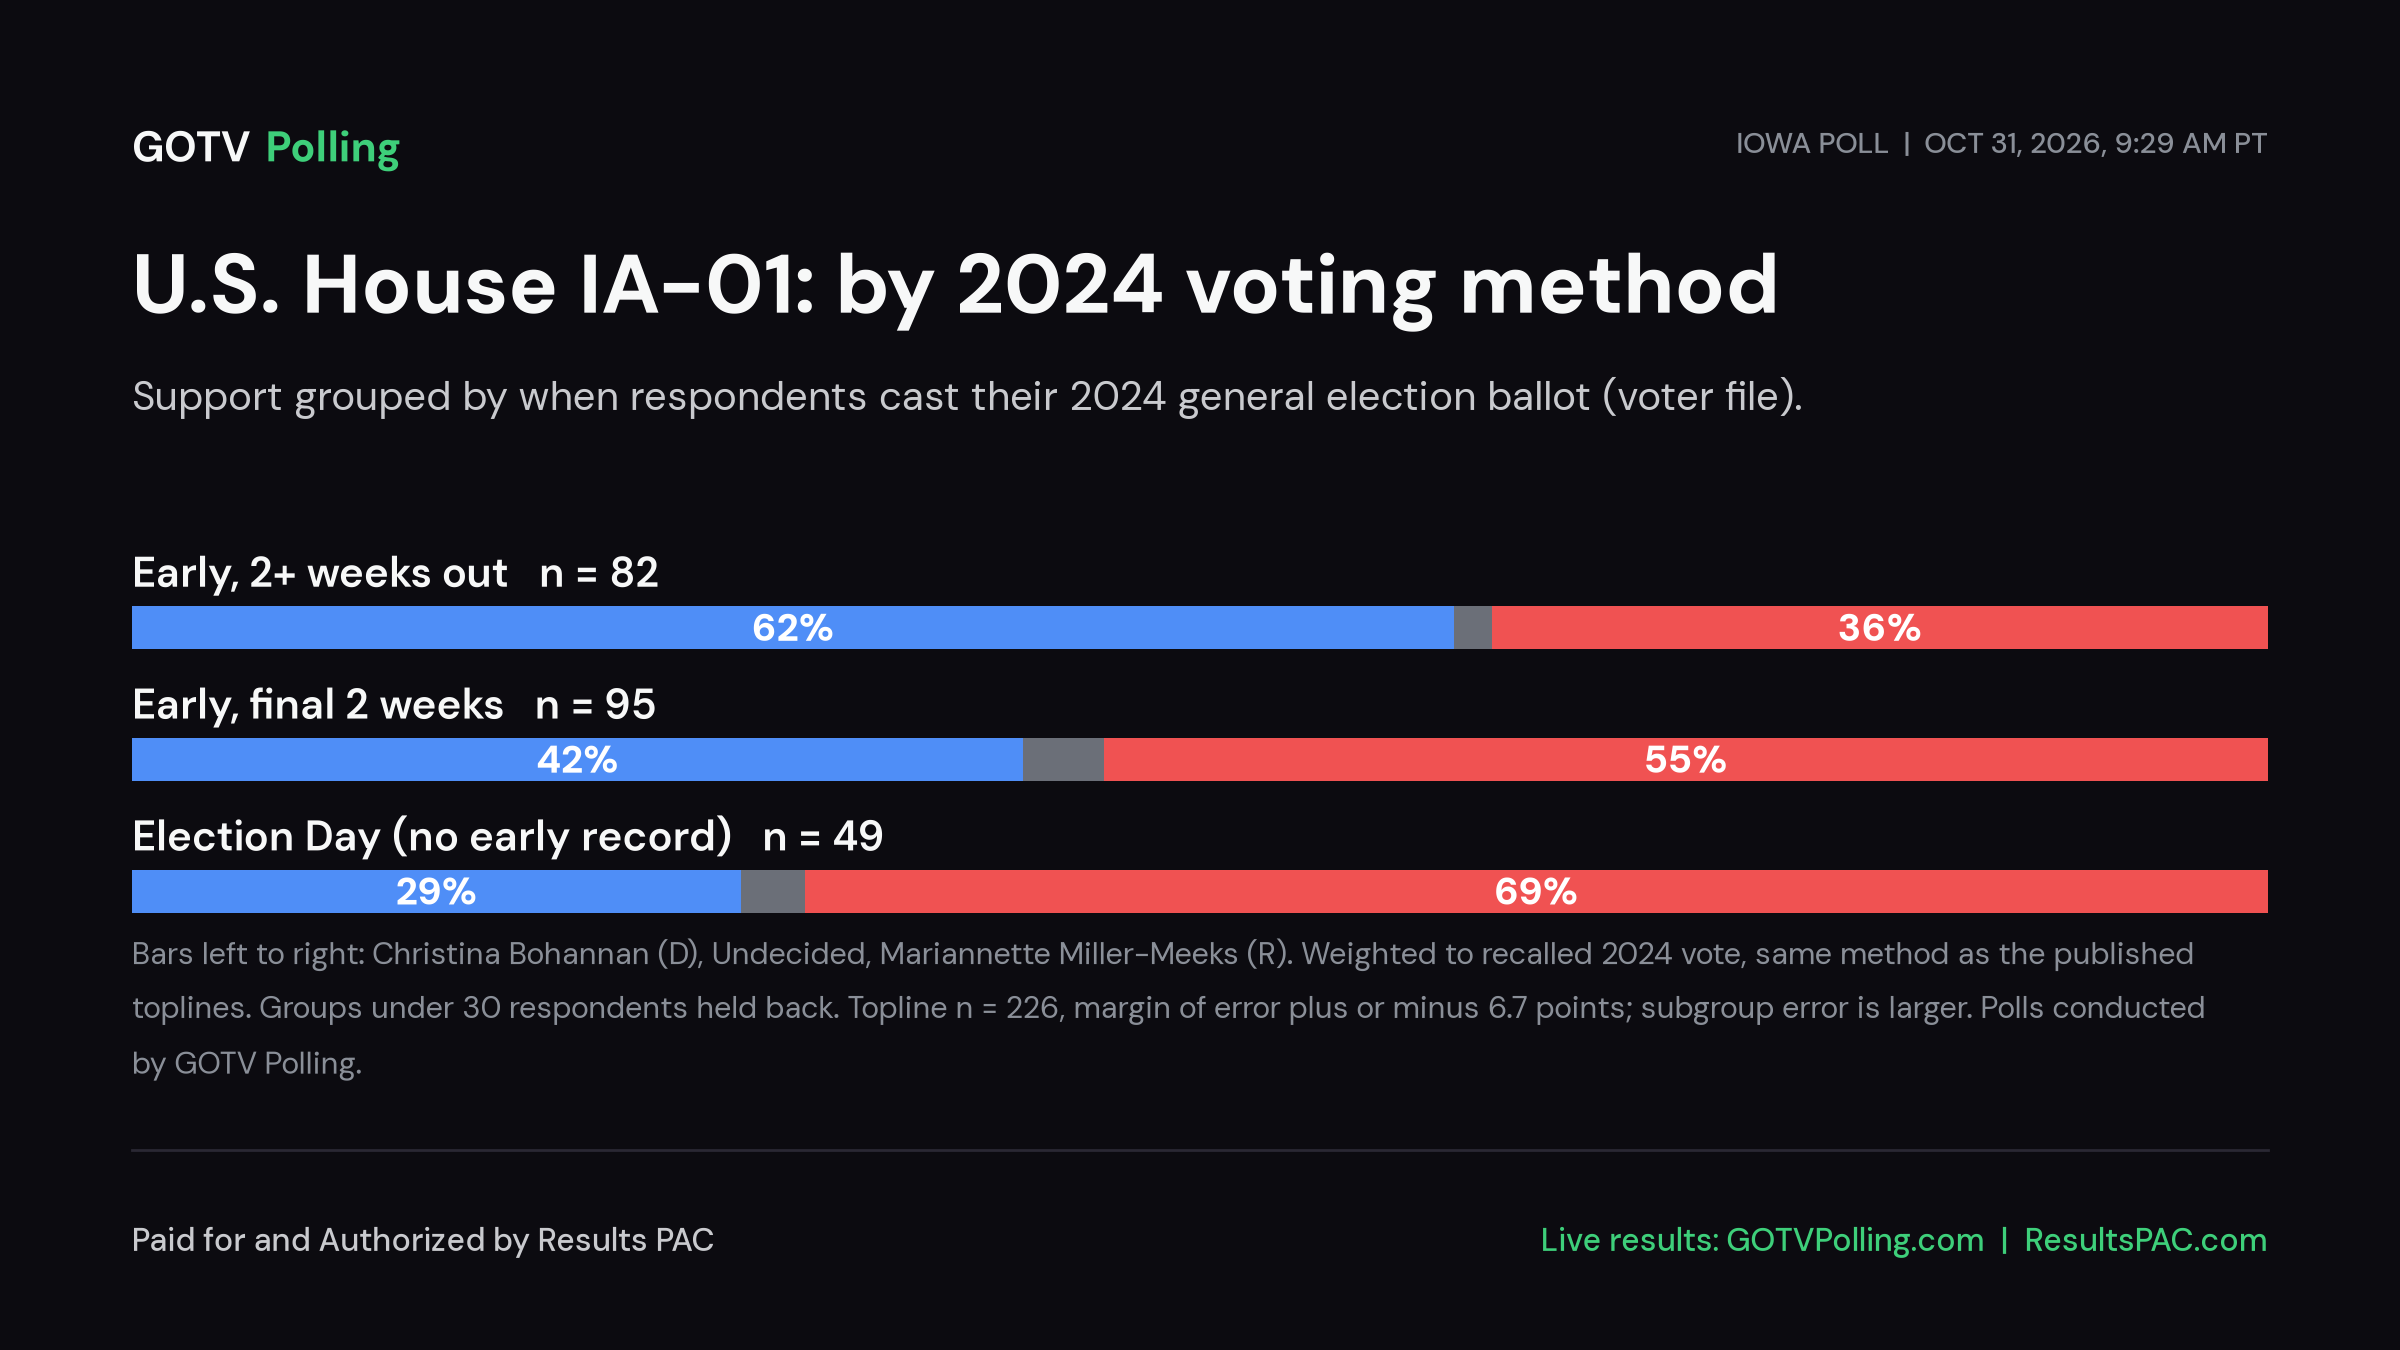
2024 general, how they voted:

GroupRespondentsShare
Early, 2+ weeks out8236%
Early, final 2 weeks9542%
Election Day (no early record)4922%

Voter-file vote frequency score:

GroupRespondentsShare
Vote frequency 8 (highest)13459%
Vote frequency 75625%
Vote frequency 5 to 63616%

Support by voting history

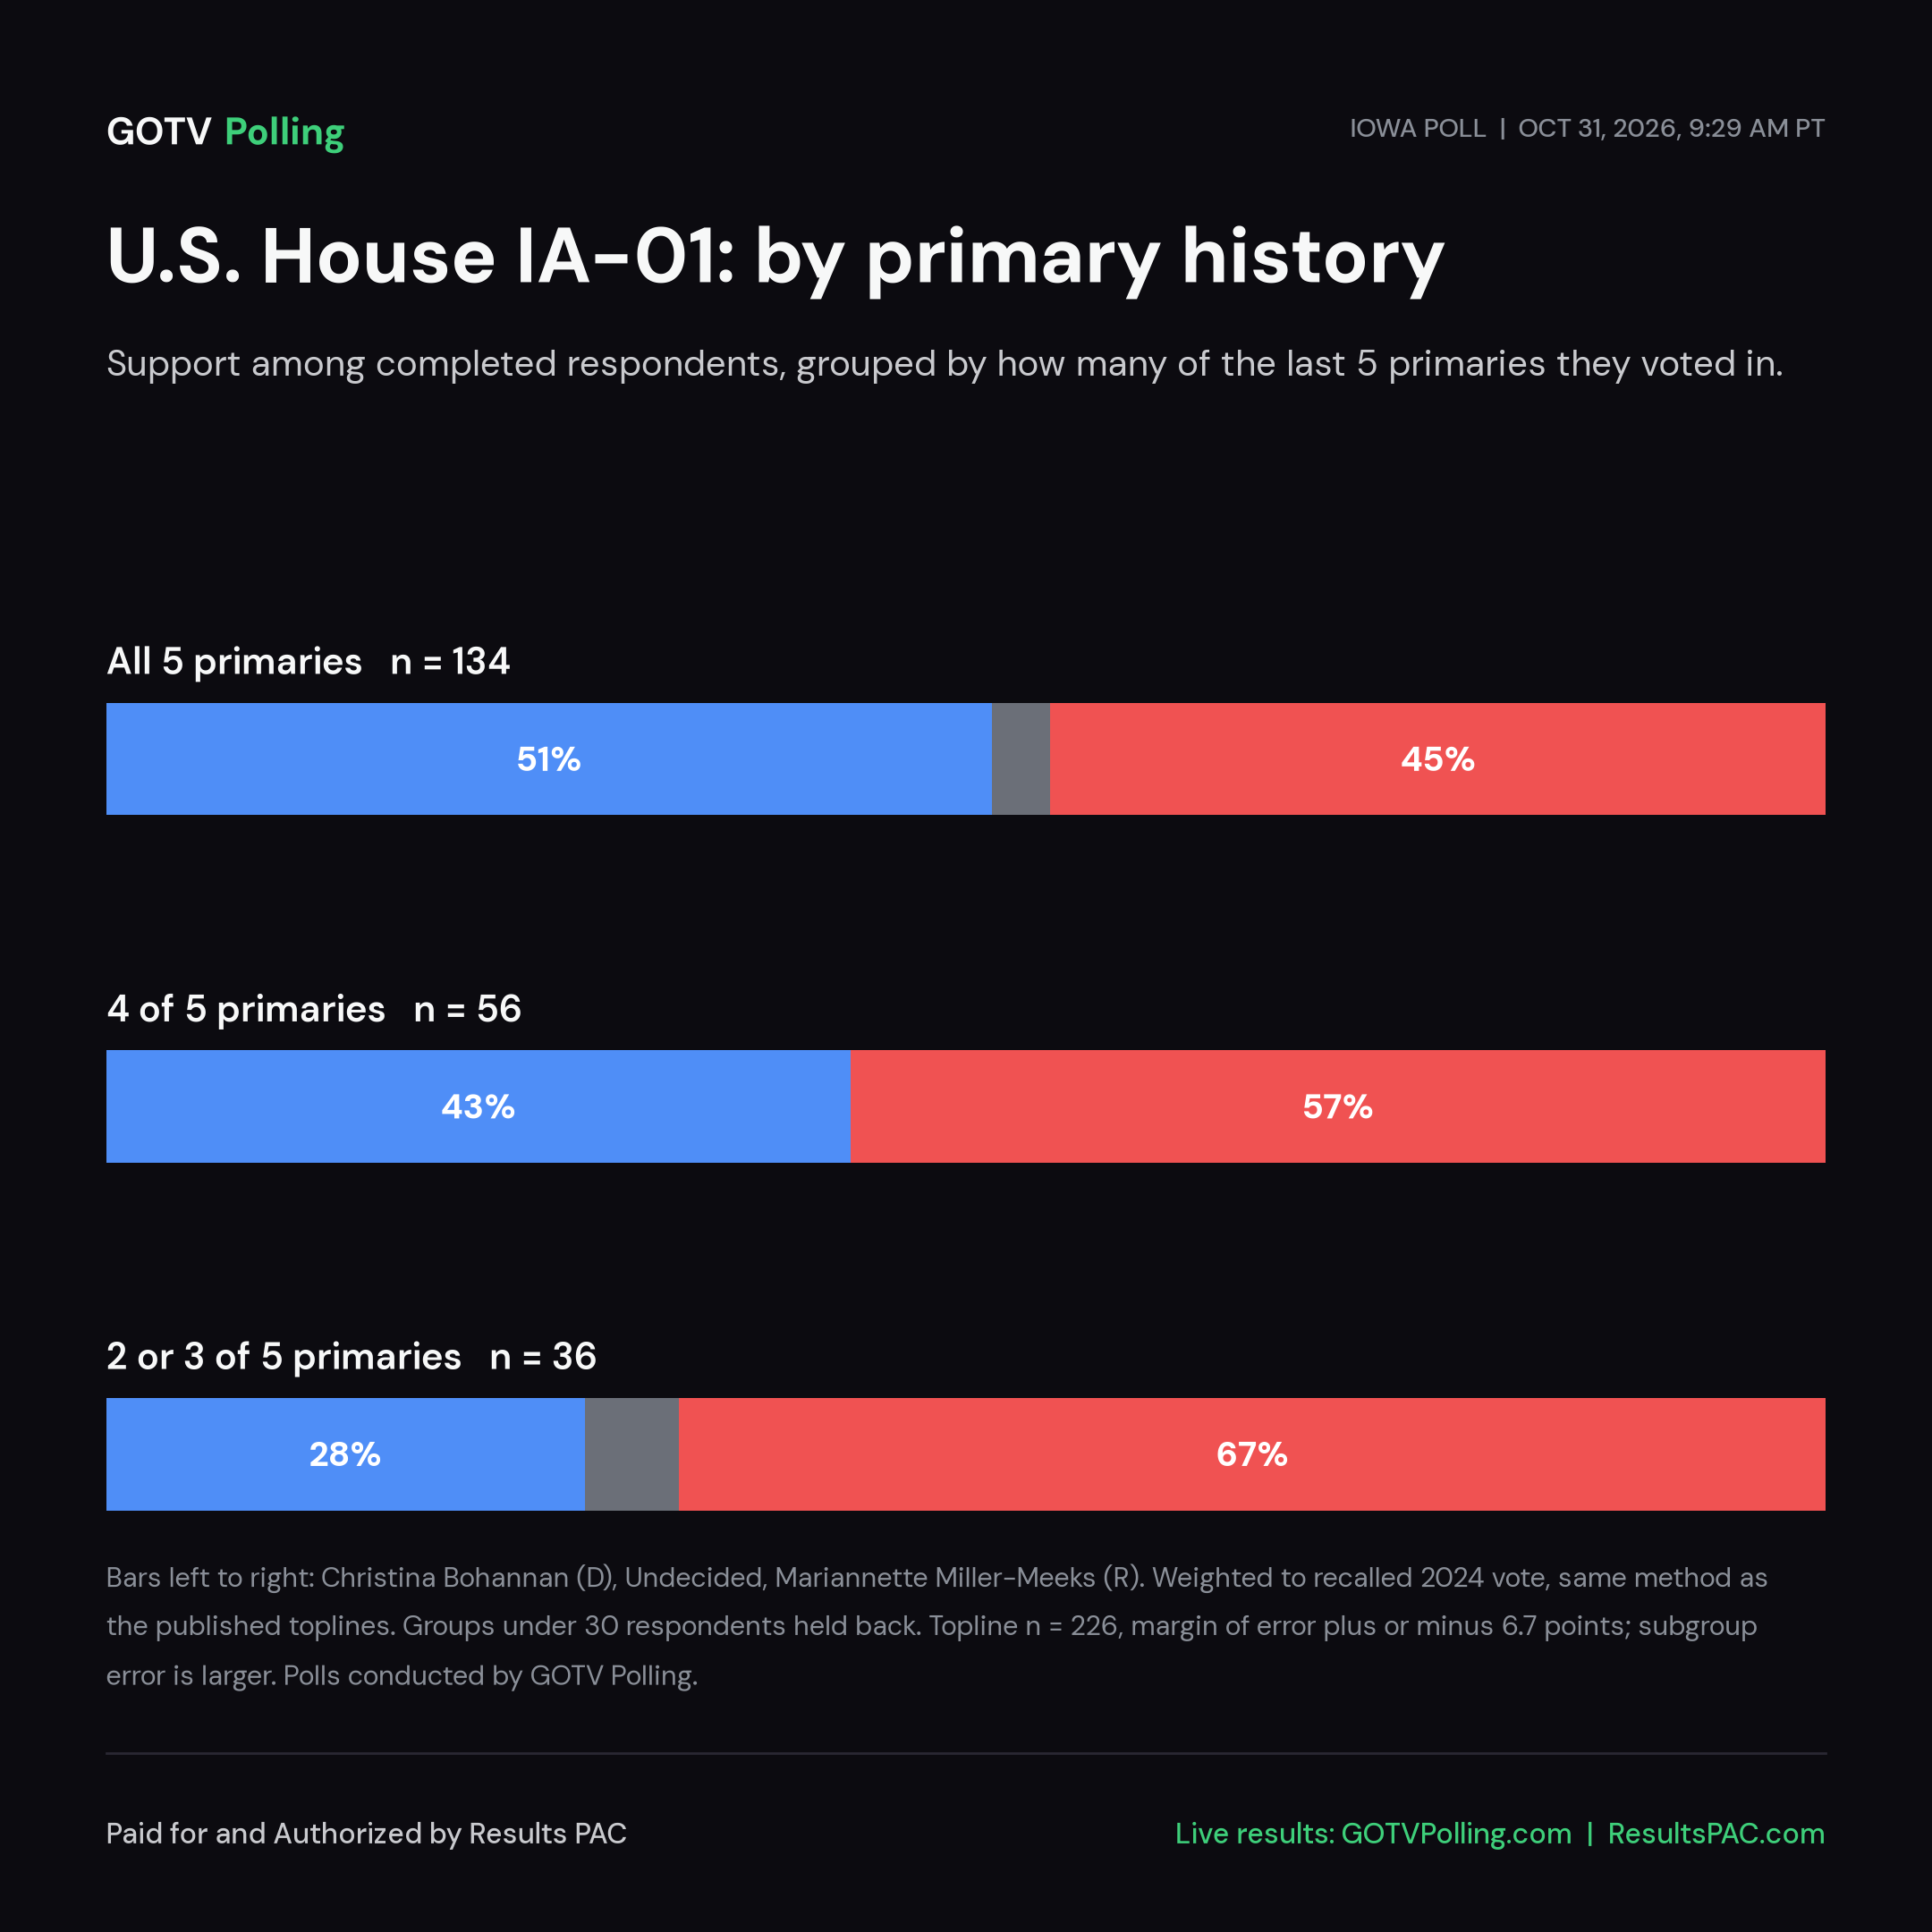
Primary history:

GroupnChristina BohannanMariannette Miller-MeeksUndecided
All 5 primaries13451.5%45.1%3.4%
4 of 5 primaries5643.3%56.7%0.0%
2 or 3 of 5 primaries3627.8%66.7%5.5%

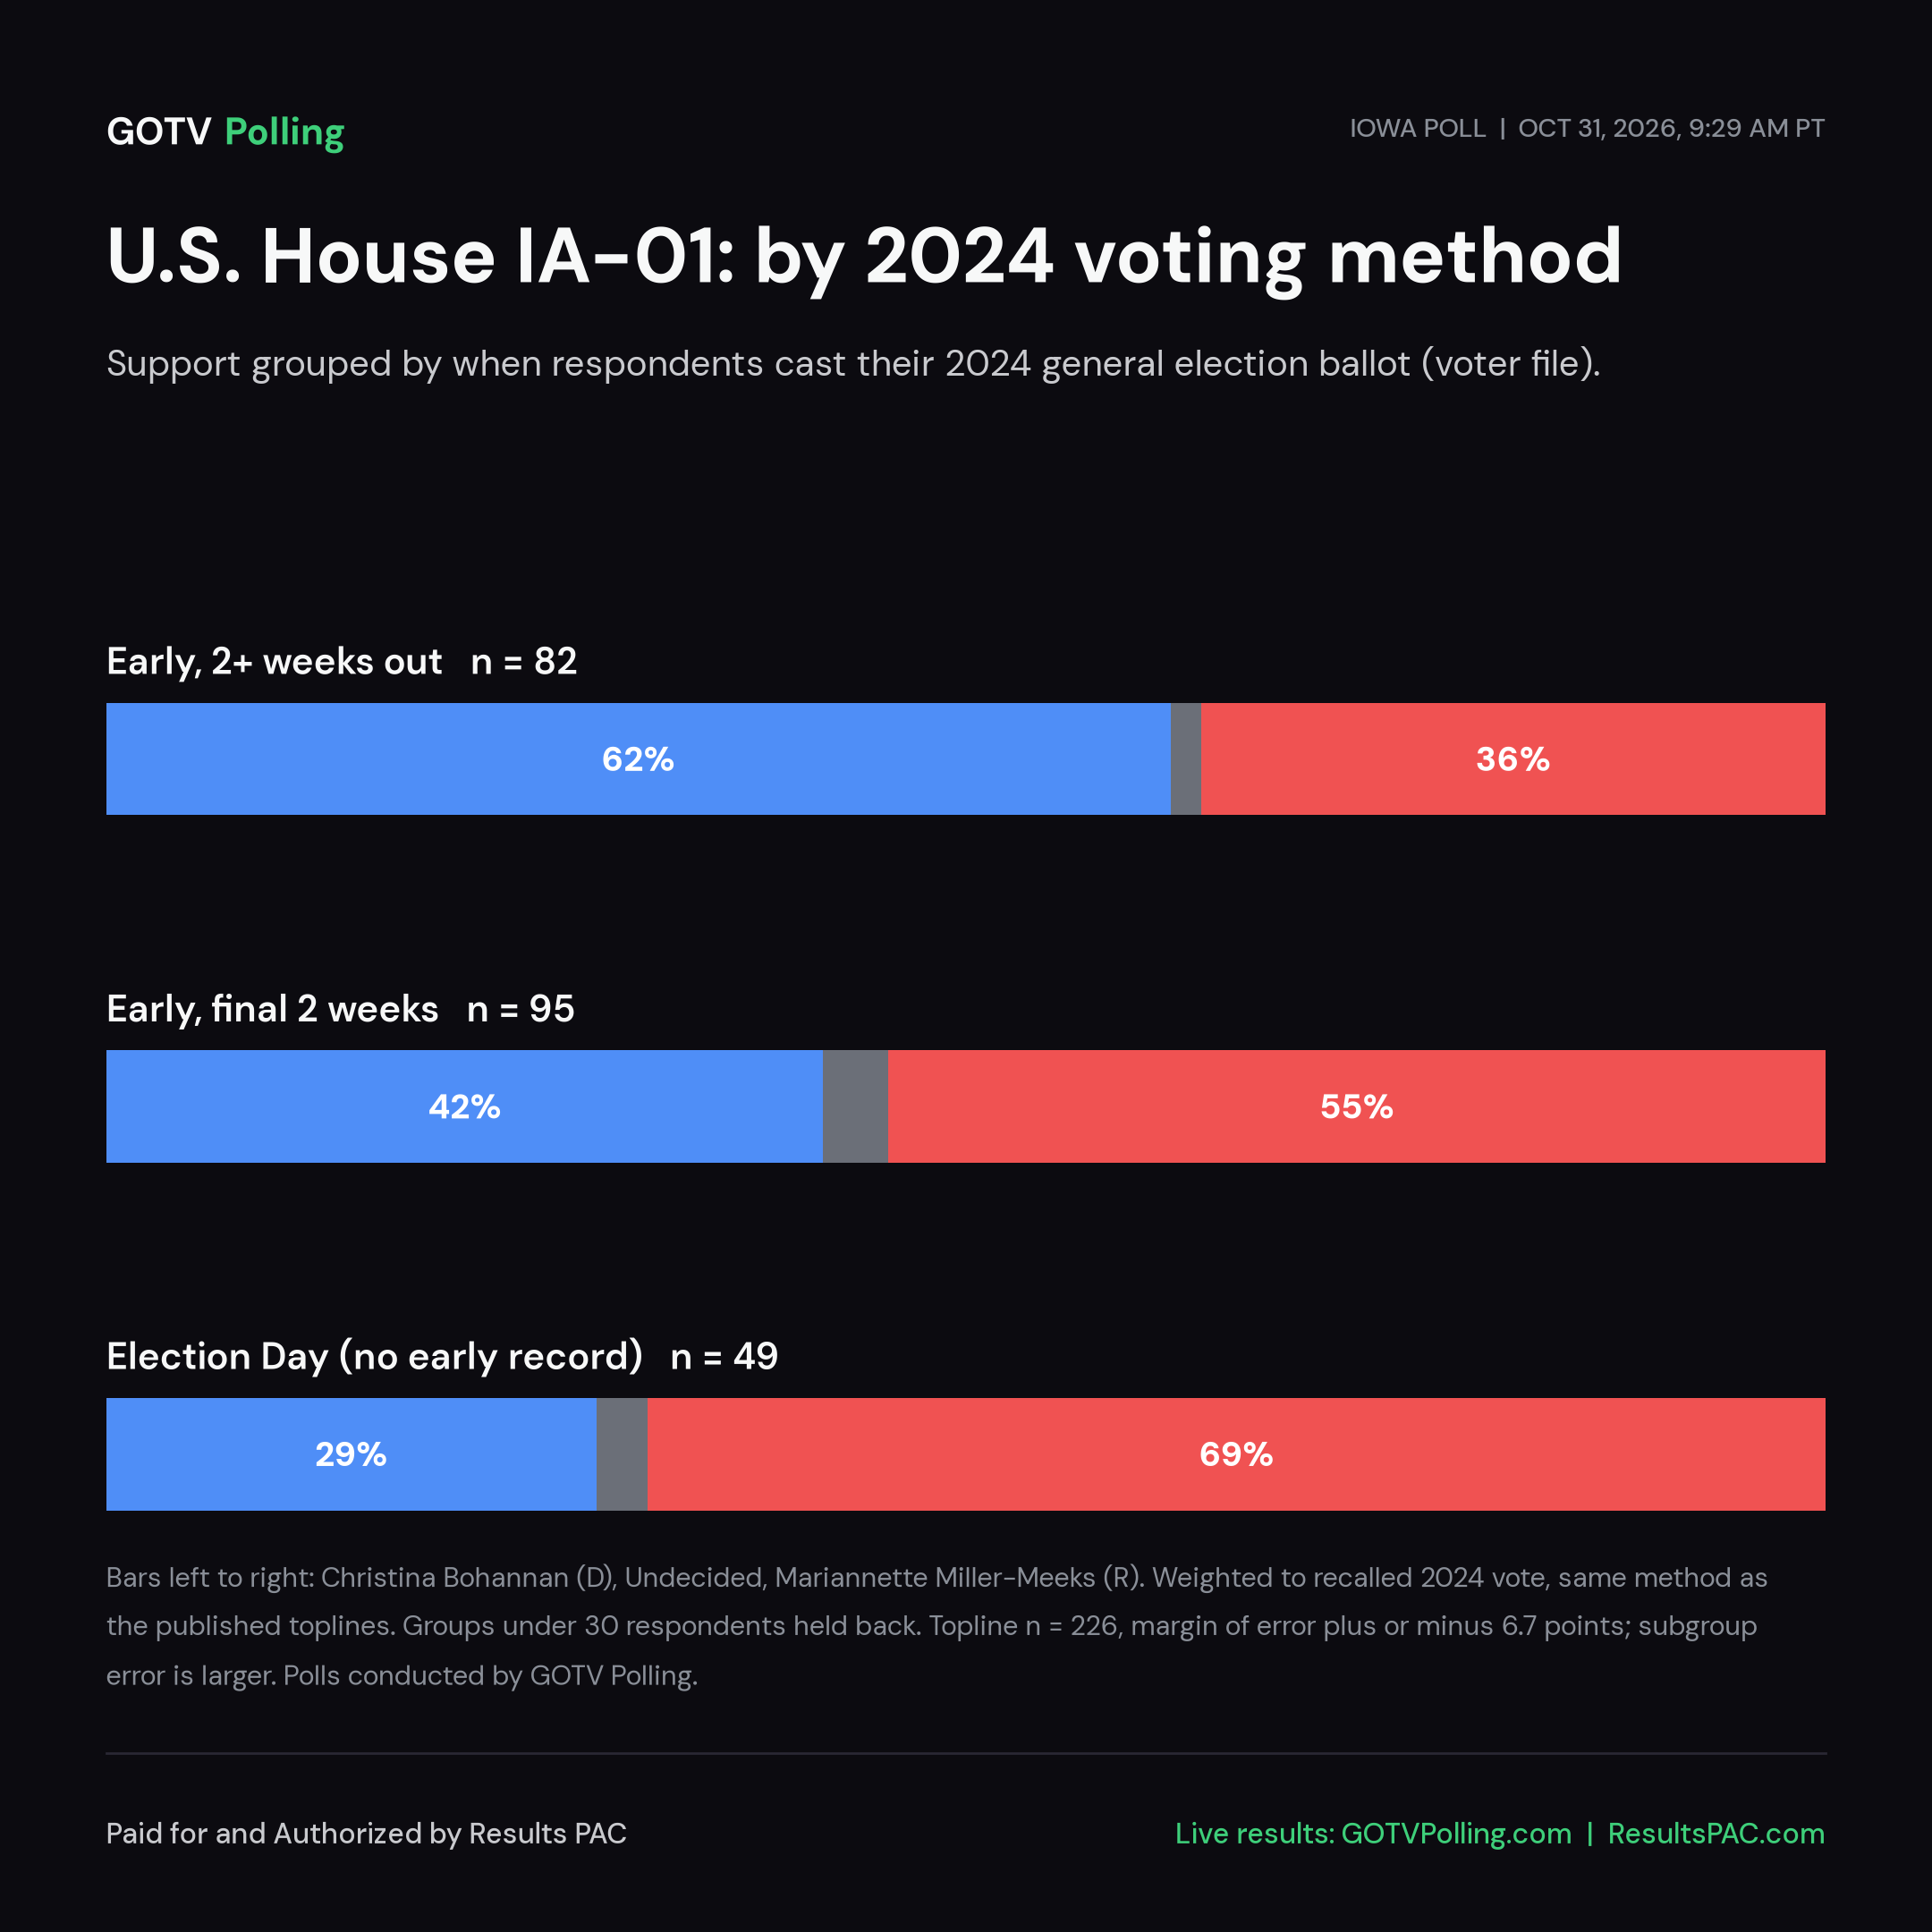
2024 voting method:

GroupnChristina BohannanMariannette Miller-MeeksUndecided
Early, 2+ weeks out8261.9%36.3%1.8%
Early, final 2 weeks9541.7%54.5%3.8%
Election Day (no early record)4928.5%68.5%3.0%

Vote frequency score:

GroupnChristina BohannanMariannette Miller-MeeksUndecided
Vote frequency 8 (highest)13451.5%45.1%3.4%
Vote frequency 75643.3%56.7%0.0%
Vote frequency 5 to 63627.8%66.7%5.5%

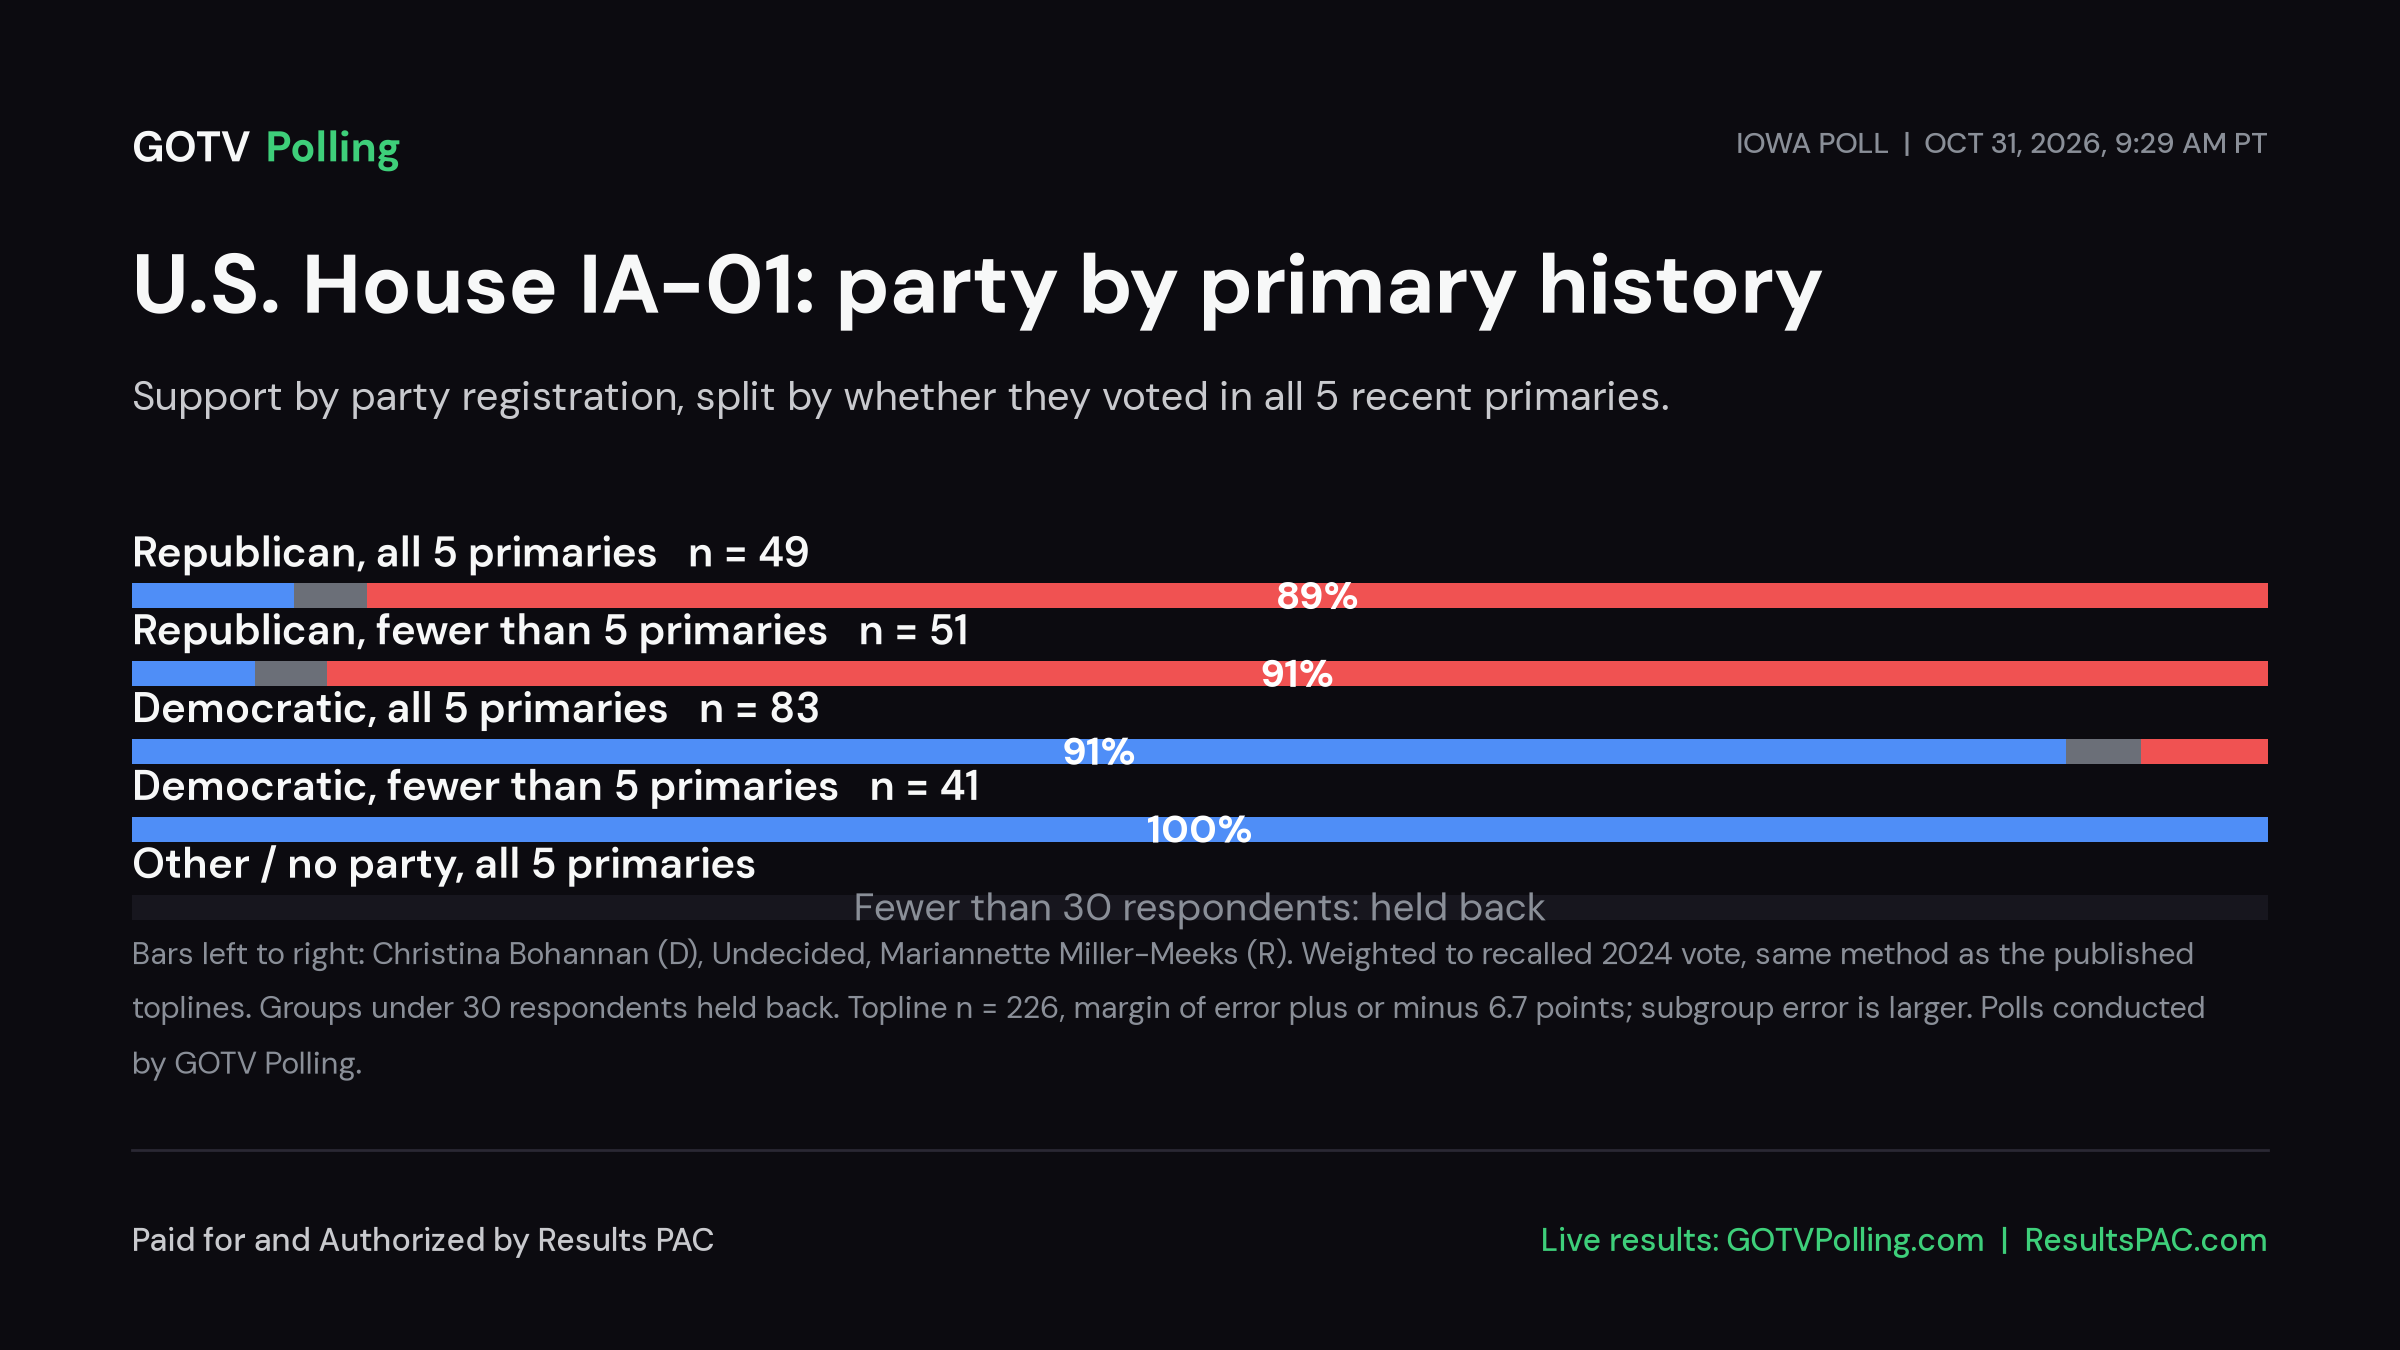
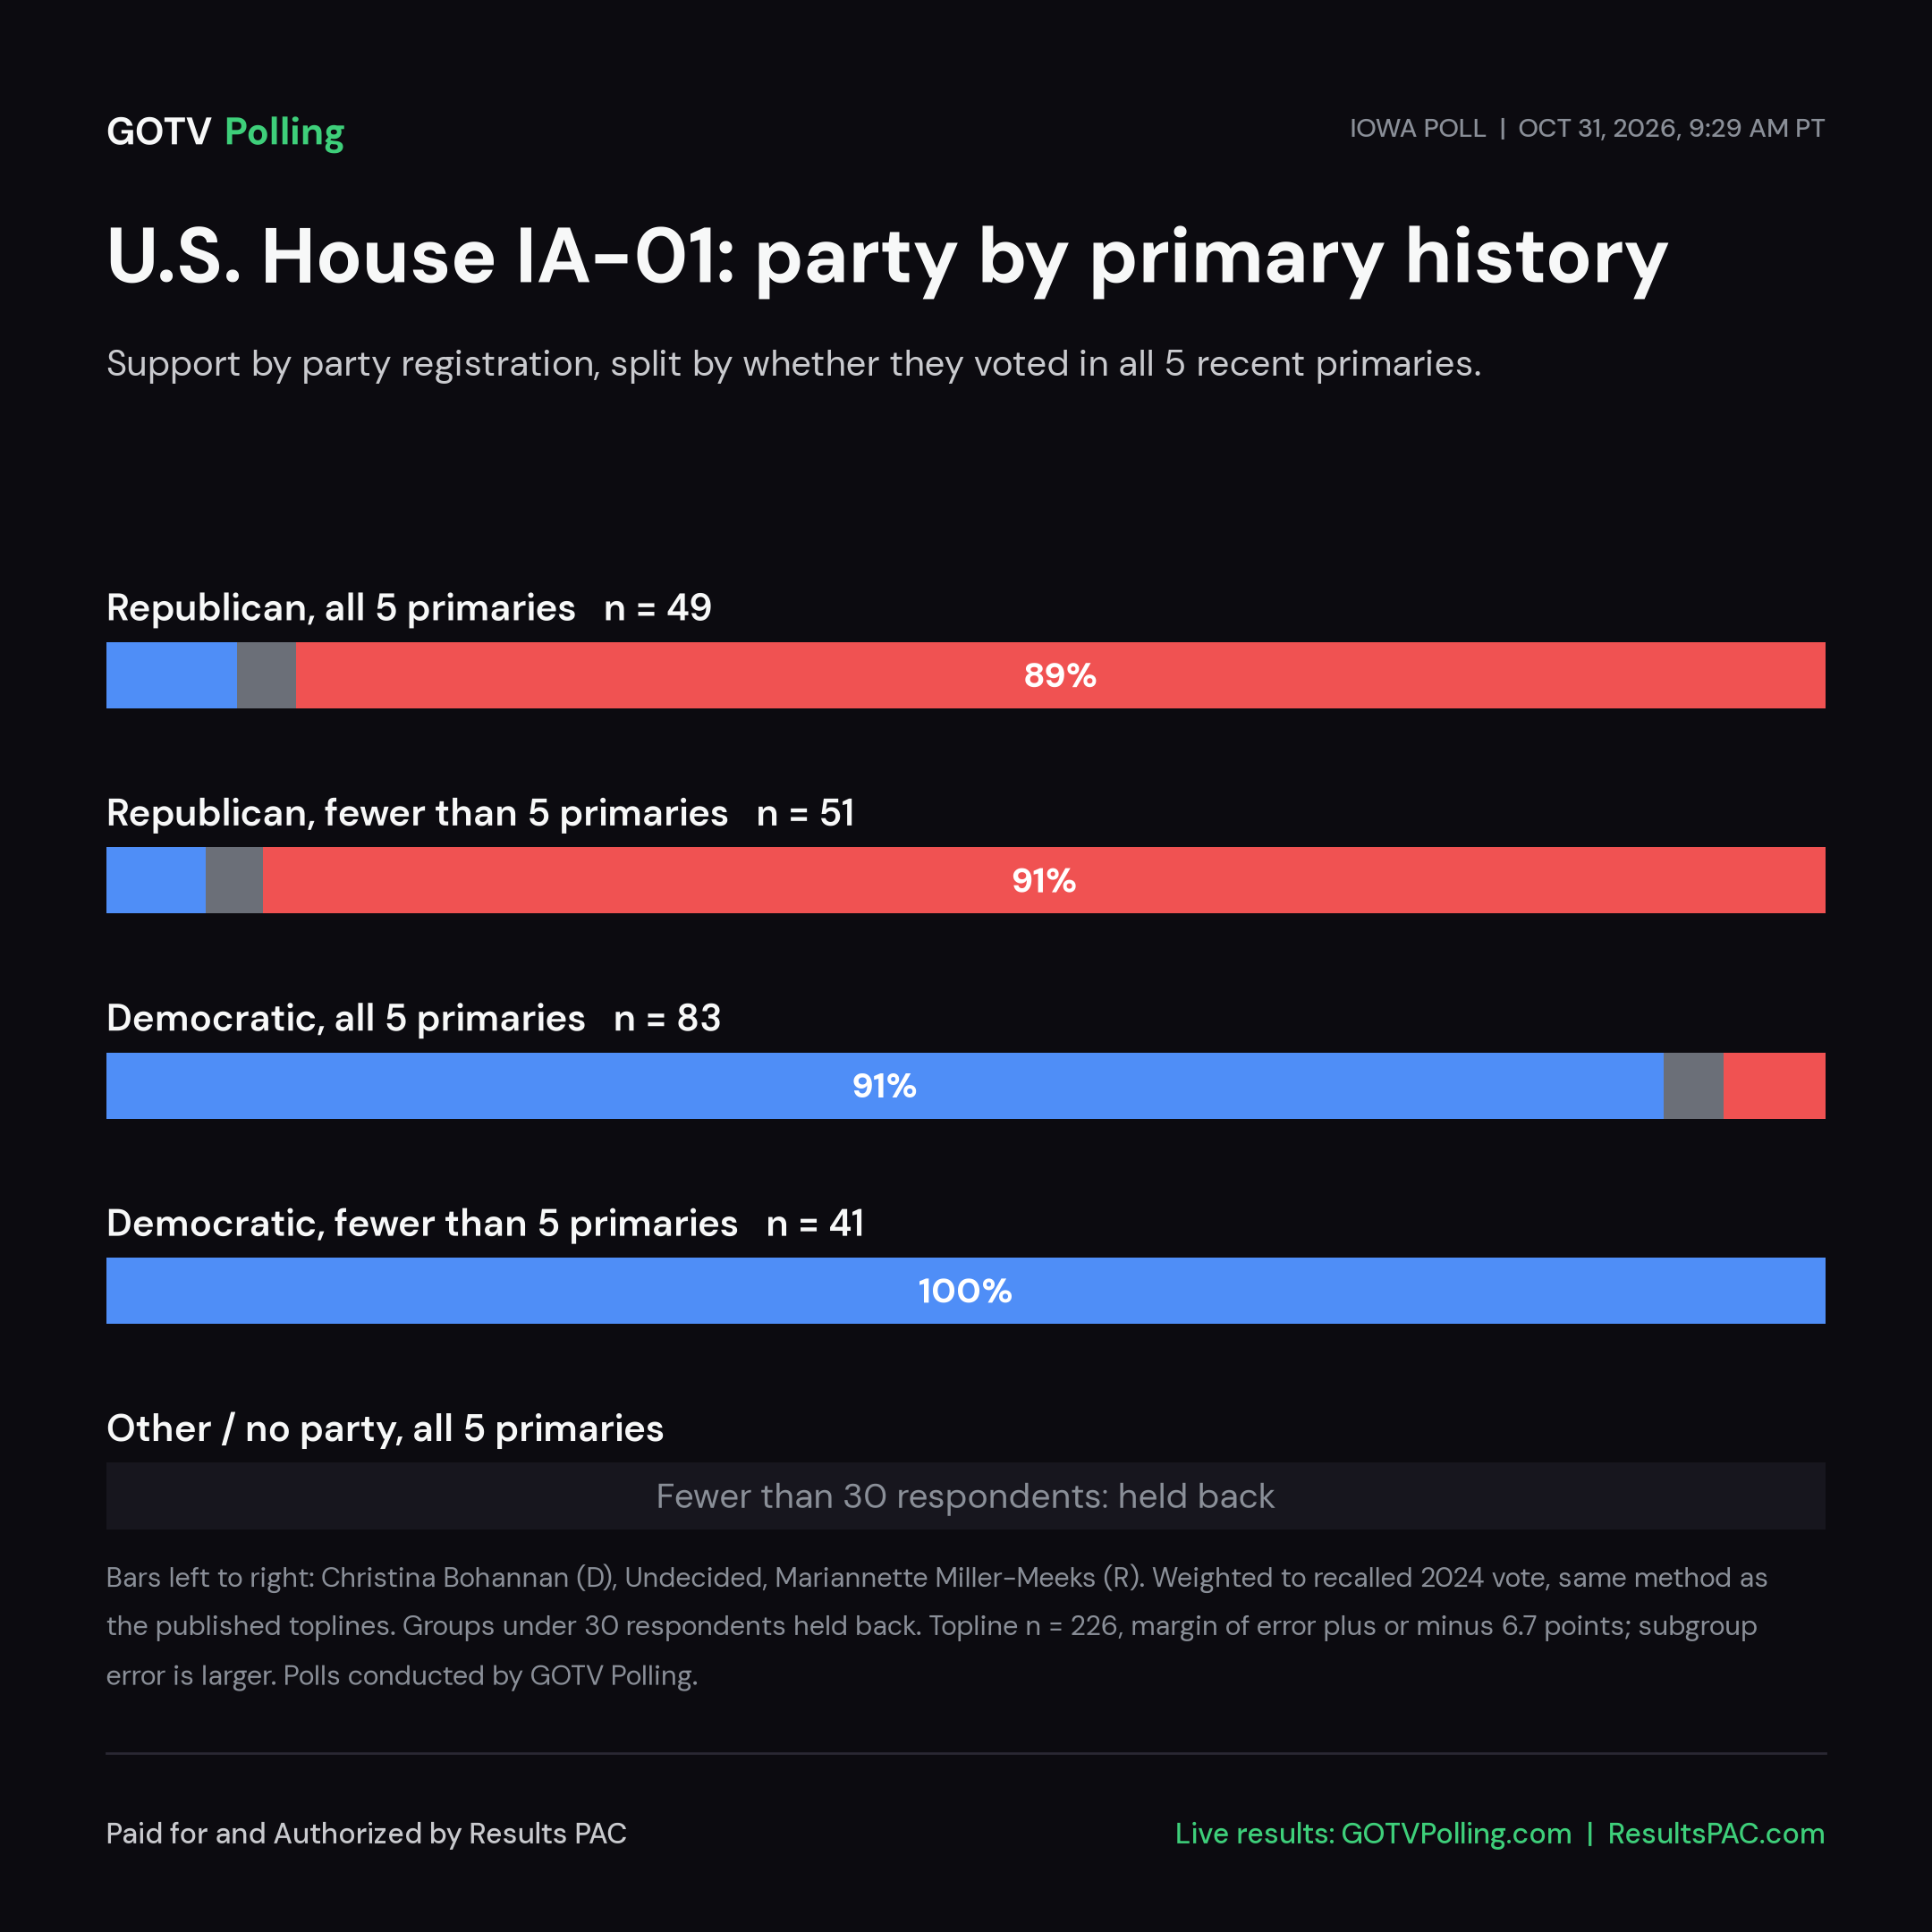
Party registration by primary history:

GroupnChristina BohannanMariannette Miller-MeeksUndecided
Republican, all 5 primaries497.6%89.0%3.4%
Republican, fewer than 5 primaries515.8%90.9%3.4%
Democratic, all 5 primaries8390.6%6.0%3.5%
Democratic, fewer than 5 primaries41100.0%0.0%0.0%
Other / no party, all 5 primariesunder 30held backheld backheld back

What it means

  • Margin among voters in all 5 primaries: Bohannan +6.4; among those in 2 or 3 of 5: Miller-Meeks +38.9.
  • Margin among voters who voted early 2+ weeks out in 2024: Bohannan +25.6; among Election Day voters: Miller-Meeks +40.0.
  • Within each party support barely moves (Republicans 89% and 91% Miller-Meeks, Democrats 91% and 100% Bohannan), so the gap is mostly party mix.
  • Because every respondent is a high-turnout voter, read differences between voting-history groups as differences within the most reliable part of the electorate, not as a turnout model.
  • Party and primary history overlap strongly; differences by history group are largely party composition.

Caveats

  • Held back (under 30): Other / no party, all 5 primaries.
  • Early-vote timing is from the voter file's 2024 record, not a 2026 early-vote measure.
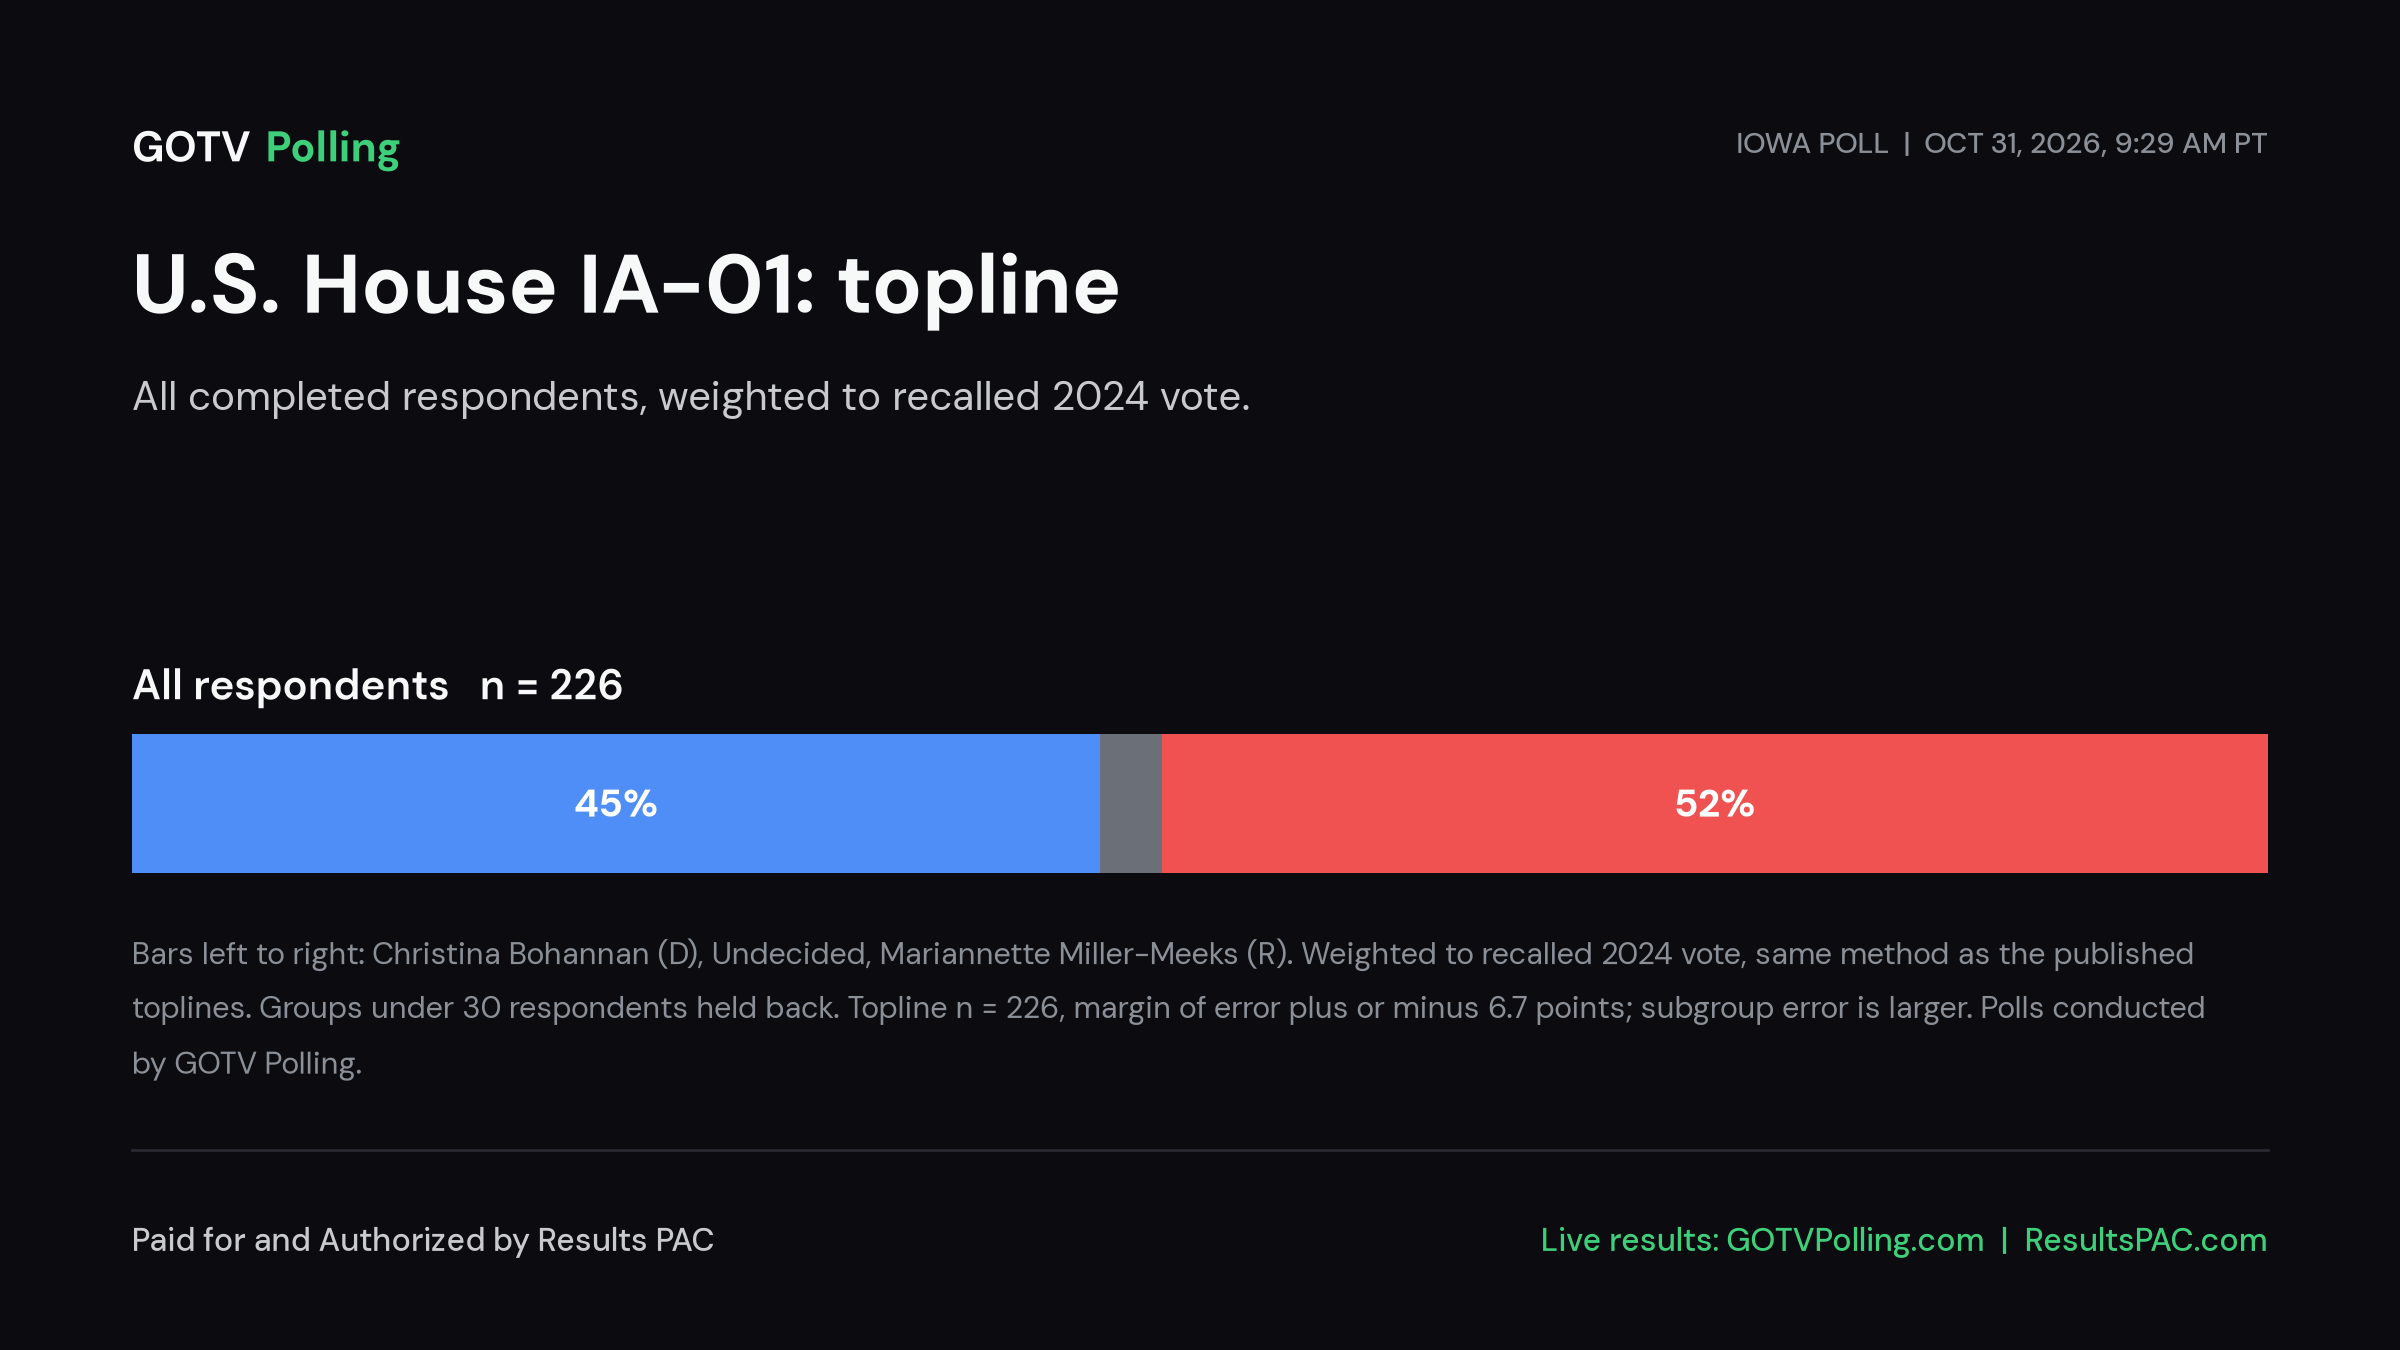
U.S. House IA-01 (#IA01): voting history of poll respondents: Topline
Topline · square
U.S. House IA-01 (#IA01): voting history of poll respondents: By primary history
By primary history · square
U.S. House IA-01 (#IA01): voting history of poll respondents: By 2024 vote timing
By 2024 vote timing · square
U.S. House IA-01 (#IA01): voting history of poll respondents: Party by primary history
Party by primary history · square

Race profile: Iowa's 1st Congressional District

U.S. House · Iowa · District 1 · General election: Tuesday, November 3, 2026

Seat status: Incumbent running

Candidates on the November 3 ballot

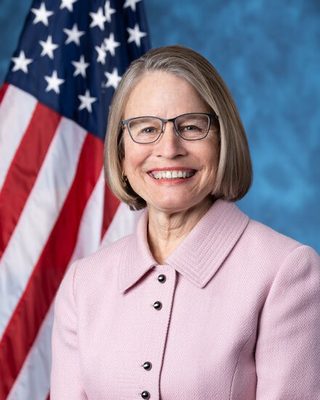
  • Photo of Mariannette Miller-Meeks
    Mariannette Miller-Meeks
    Republican
    Incumbent
    Photo: U.S. Congress
  • Photo of Christina Bohannan
    Christina Bohannan
    Democratic
    Photo: bohannanforcongress.com
  • Photo of Michael Bridgford
    Michael Bridgford
    Independent
    Photo: qtrypzzcjebvfcihiynt.supabase.co

Source: Certified November 3, 2026 general-election ballot list (GOTV Polling 2026 Battlegrounds file, compiled from state certified candidate lists). Write-in candidates are not shown.. Order of names does not reflect ballot order. Incumbent tags appear only where the official list marks incumbents. Photos come from the Candidate Alerts database where one is on file; otherwise initials are shown.

Federal campaign finance filings for this seat: FEC election page (FEC registration is not the same as ballot qualification).

Certified candidates

Certified candidate list from Candidate Alerts, as of 2026-09-24, based on Iowa Secretary of State. Includes candidates the database marks as on the November 3 ballot. Incumbent tags here follow the database.

Past election results

2024: United States Representative District 1 (Iowa General Election 2024-11-05)
CandidatePartyVotesShare
Mariannette Miller-MeeksRepublican206,95550.0%
Christina BohannanDemocratic206,15649.8%
Write-in9670.2%
Total414,078

Source: Iowa Secretary of State, Election Night Reporting / Precinct Results by County (electionresults.iowa.gov). Status: Certified, Iowa county canvass results as published by the Iowa Secretary of State (Clarity ENR final county uploads; county totals reconcile exactly to the State Board of Canvassers canvass summary)

2022: United States Representative District 1 (Iowa General Election 2022-11-08)
CandidatePartyVotesShare
Mariannette Miller-MeeksRepublican162,94753.4%
Christina BohannanDemocratic142,17346.6%
Write-in2600.1%
Total305,380

Source: Iowa Secretary of State, Election Night Reporting / Precinct Results by County (electionresults.iowa.gov). Status: Certified, Iowa county canvass results as published by the Iowa Secretary of State (Clarity ENR final county uploads; county totals reconcile exactly to the State Board of Canvassers canvass summary)

2020: United States Representative District 1 (Iowa General Election 2020-11-03)

Held under the district lines in effect at the time. Those boundaries differ from the 2026 district.

CandidatePartyVotesShare
Ashley HinsonRepublican212,08851.2%
Abby FinkenauerDemocratic201,34748.6%
Write-in4340.1%
Total413,869

Source: Iowa Secretary of State, Election Night Reporting / Precinct Results by County (electionresults.iowa.gov). Status: Certified, Iowa county canvass results as published by the Iowa Secretary of State (Clarity ENR final county uploads; county totals reconcile exactly to the State Board of Canvassers canvass summary)

Certified results from state or county election authorities, as compiled in the Candidate Alerts precinct results database (public API candidatealerts.com/api/district-results). Totals are sums of certified precinct and county-level rows.

Demographics

2020 Census demographics by district are not yet published in this data set.

Adults who speak Spanish at home: 3.1% of adults in this district

0 of 408 precincts are above 50%, and 6 are above 25%. Source: Census American Community Survey 2020-2024 5-year block groups, allocated to current precinct shapes by area.

Early vote layer: 2026 general (IA-01, counties in district)

Unofficial. Source: civicAPI and Call the Map (callthemap.com/early-vote), republishing Iowa Secretary of State counts. Official data: sos.iowa.gov.

Data as of October 30, 2026. 118,521 early ballots cast in the 20 counties touching this district: D 49.4%, R 30.5%, No Party / Other 20.0% by registration (D+18.9). Party is registration, not vote. Early vote is published by county only; counties split by the district are counted in full, so this is approximate. Full Iowa early vote page.

R leadEvenD leadoutside district
Adair: 924 early ballots cast, R+25.6 by registered partyAdams: 517 early ballots cast, R+23.8 by registered partyAllamakee: 1,789 early ballots cast, R+13.1 by registered partyAppanoose: 1,439 early ballots cast, R+11.4 by registered partyAudubon: 713 early ballots cast, R+17.0 by registered partyBenton: 2,160 early ballots cast, R+10.0 by registered partyBlack Hawk: 15,605 early ballots cast, D+27.3 by registered partyBoone: 4,259 early ballots cast, D+4.1 by registered partyBremer: 3,585 early ballots cast, D+4.7 by registered partyBuchanan: 2,380 early ballots cast, D+7.5 by registered partyBuena Vista: 1,927 early ballots cast, R+12.1 by registered partyButler: 1,499 early ballots cast, R+28.1 by registered partyCalhoun: 915 early ballots cast, R+21.0 by registered partyCarroll: 2,721 early ballots cast, R+10.3 by registered partyCass: 1,471 early ballots cast, R+23.1 by registered partyCedar: 4,985 early ballots cast, R+12.1 by registered partyCerro Gordo: 5,889 early ballots cast, D+14.7 by registered partyCherokee: 1,643 early ballots cast, R+35.2 by registered partyChickasaw: 1,925 early ballots cast, R+2.9 by registered partyClarke: 964 early ballots cast, R+5.7 by registered partyClay: 2,326 early ballots cast, R+26.7 by registered partyClayton: 1,706 early ballots cast, R+0.5 by registered partyClinton: 6,903 early ballots cast, D+11.8 by registered partyCrawford: 1,308 early ballots cast, R+17.5 by registered partyDallas: 14,814 early ballots cast, D+9.8 by registered partyDavis: 809 early ballots cast, R+15.7 by registered partyDecatur: 722 early ballots cast, R+16.1 by registered partyDelaware: 2,048 early ballots cast, R+9.4 by registered partyDes Moines: 5,093 early ballots cast, D+20.8 by registered partyDickinson: 4,239 early ballots cast, R+29.6 by registered partyDubuque: 15,426 early ballots cast, D+24.4 by registered partyEmmet: 842 early ballots cast, R+1.8 by registered partyFayette: 2,030 early ballots cast, D+4.5 by registered partyFloyd: 1,755 early ballots cast, D+9.2 by registered partyFranklin: 967 early ballots cast, R+21.8 by registered partyFremont: 654 early ballots cast, R+20.0 by registered partyGreene: 1,291 early ballots cast, R+7.8 by registered partyGrundy: 1,396 early ballots cast, R+26.4 by registered partyGuthrie: 1,445 early ballots cast, R+18.9 by registered partyHamilton: 1,977 early ballots cast, R+11.0 by registered partyHancock: 965 early ballots cast, R+19.5 by registered partyHardin: 1,863 early ballots cast, R+19.0 by registered partyHarrison: 1,191 early ballots cast, R+20.2 by registered partyHenry: 693 early ballots cast, R+5.2 by registered partyHoward: 971 early ballots cast, D+11.8 by registered partyHumboldt: 1,117 early ballots cast, R+19.4 by registered partyIda: 577 early ballots cast, R+28.4 by registered partyIowa: 2,142 early ballots cast, R+6.0 by registered partyJackson: 2,403 early ballots cast, D+4.2 by registered partyJasper: 4,809 early ballots cast, D+5.1 by registered partyJefferson: 3,013 early ballots cast, D+30.9 by registered partyJohnson: 29,112 early ballots cast, D+54.8 by registered partyJones: 2,700 early ballots cast, R+0.6 by registered partyKeokuk: 815 early ballots cast, R+16.2 by registered partyKossuth: 1,862 early ballots cast, R+16.0 by registered partyLee: 4,119 early ballots cast, D+17.3 by registered partyLinn: 29,539 early ballots cast, D+32.6 by registered partyLouisa: 1,078 early ballots cast, R+7.3 by registered partyLucas: 1,044 early ballots cast, R+18.3 by registered partyLyon: 861 early ballots cast, R+62.8 by registered partyMadison: 2,303 early ballots cast, R+15.3 by registered partyMahaska: 2,480 early ballots cast, R+32.1 by registered partyMarion: 4,239 early ballots cast, R+15.1 by registered partyMarshall: 5,350 early ballots cast, D+5.3 by registered partyMills: 1,861 early ballots cast, R+28.6 by registered partyMitchell: 1,327 early ballots cast, R+4.6 by registered partyMonona: 841 early ballots cast, R+14.5 by registered partyMonroe: 986 early ballots cast, R+13.0 by registered partyMontgomery: 966 early ballots cast, R+23.6 by registered partyMuscatine: 4,970 early ballots cast, D+11.0 by registered partyO'Brien: 954 early ballots cast, R+49.3 by registered partyOsceola: 411 early ballots cast, R+52.6 by registered partyPage: 1,462 early ballots cast, R+34.2 by registered partyPalo Alto: 1,084 early ballots cast, R+6.5 by registered partyPlymouth: 3,265 early ballots cast, R+36.6 by registered partyPocahontas: 715 early ballots cast, R+26.3 by registered partyPolk: 62,898 early ballots cast, D+35.0 by registered partyPottawattamie: 8,513 early ballots cast, D+2.7 by registered partyPoweshiek: 2,611 early ballots cast, D+20.2 by registered partyRinggold: 644 early ballots cast, R+30.0 by registered partySac: 817 early ballots cast, R+31.3 by registered partyScott: 26,605 early ballots cast, D+16.7 by registered partyShelby: 1,659 early ballots cast, R+28.9 by registered partySioux: 2,745 early ballots cast, R+69.9 by registered partyStory: 11,506 early ballots cast, D+28.0 by registered partyTama: 1,265 early ballots cast, R+6.2 by registered partyTaylor: 535 early ballots cast, R+43.2 by registered partyUnion: 1,538 early ballots cast, R+9.1 by registered partyVan Buren: 654 early ballots cast, R+33.2 by registered partyWapello: 3,252 early ballots cast, D+10.9 by registered partyWarren: 8,526 early ballots cast, D+4.6 by registered partyWashington: 3,182 early ballots cast, R+6.4 by registered partyWayne: 623 early ballots cast, R+26.2 by registered partyWebster: 3,193 early ballots cast, D+5.2 by registered partyWinnebago: 982 early ballots cast, R+5.4 by registered partyWinneshiek: 4,709 early ballots cast, D+10.5 by registered partyWoodbury: 10,000 early ballots cast, D+4.4 by registered partyWorth: 613 early ballots cast, D+4.6 by registered partyWright: 1,155 early ballots cast, R+21.4 by registered party

Shading: registered Democrats minus registered Republicans among early ballots cast (mail returned plus in person), by county. County shapes: U.S. Census Bureau cartographic boundary file cb_2023_us_county_20m.

Early vote by county (20)
CountyMail requestedMail returnedReturn rateIn personTotal castD / Other / R share of cast
Johnson7,0205,78482.4%23,32829,11267.3% / 20.2% / 12.5%
Scott8,7587,58486.6%19,02126,60547.0% / 22.8% / 30.2%
Warren3,1112,68286.2%5,8448,52642.5% / 19.6% / 37.9%
Clinton2,9222,59688.8%4,3076,90344.8% / 22.3% / 32.9%
Des Moines2,0791,84588.7%3,2485,09351.9% / 17.0% / 31.1%
Cedar1,03191388.6%4,0724,98534.2% / 19.5% / 46.3%
Muscatine1,9741,73788.0%3,2334,97046.6% / 17.9% / 35.6%
Jasper1,7861,57688.2%3,2334,80943.7% / 17.7% / 38.6%
Marion2,2571,97787.6%2,2624,23933.2% / 18.5% / 48.3%
Lee1,7531,58390.3%2,5364,11950.2% / 16.9% / 32.9%
Washington1,1851,07290.5%2,1103,18237.5% / 18.6% / 43.9%
Jefferson85671583.5%2,2983,01357.9% / 15.1% / 27.0%
Jones1,2711,13189.0%1,5692,70037.1% / 25.1% / 37.7%
Mahaska1,05389284.7%1,5882,48025.7% / 16.6% / 57.7%
Jackson1,3181,16888.6%1,2352,40344.3% / 15.6% / 40.1%
Iowa86078290.9%1,3602,14235.0% / 23.9% / 41.0%
Louisa38834187.9%7371,07837.0% / 18.6% / 44.3%
Keokuk41535084.3%46581533.4% / 17.1% / 49.6%
Henry78768887.4%569340.0% / 14.9% / 45.2%
Van Buren23819280.7%46265426.3% / 14.2% / 59.5%

Nonpartisan voter information. GOTV Polling does not endorse any candidate.