
Alabama's 6th Congressional District
U.S. House · Alabama · District 6 · General election: Tuesday, November 3, 2026
Candidates on the November 3 ballot
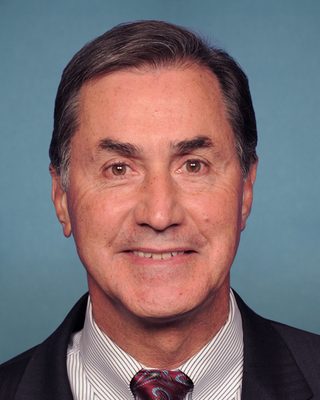 Gary PalmerRepublicanPhoto: U.S. Congress
- Maurice MercerDemocratic
Source: Alabama Secretary of State, State Certification of Republican, Democratic and Independent Candidates, 2026 General Election, certified list (2026-08-26; retrieved 2026-10-30). The Secretary of State certified no independent candidates for these offices. Order of names does not reflect ballot order. Incumbent tags appear only where the official list marks incumbents. Photos come from the Candidate Alerts database where one is on file; otherwise initials are shown.
Federal campaign finance filings for this seat: FEC election page (FEC registration is not the same as ballot qualification).
Certified candidates
- Gary J. Palmer RepublicanIncumbent @USRepGaryPalmer
- Maurice Mercer Democratic
Certified candidate list from Candidate Alerts, as of 2026-09-24, based on Alabama Secretary of State. Includes candidates the database marks as on the November 3 ballot. Incumbent tags here follow the database.
Past election results
Held under the district lines in effect at the time. Those boundaries differ from the 2026 district.
| Candidate | Party | Votes | Share |
|---|---|---|---|
| Gary Palmer | Republican | 243,741 | 70.3% |
| Elizabeth Anderson | Democratic | 102,504 | 29.6% |
| Write-In | NON | 380 | 0.1% |
| Total | 346,625 |
Source: Alabama Secretary of State, official precinct-level results. Status: Official precinct-level results (Alabama Secretary of State)
Held under the district lines in effect at the time. Those boundaries differ from the 2026 district.
| Candidate | Party | Votes | Share |
|---|---|---|---|
| Gary Palmer | Republican | 154,233 | 83.7% |
| Andria Chieffo | Libertarian | 27,833 | 15.1% |
| Write-In | NON | 2,137 | 1.2% |
| Total | 184,203 |
Source: Alabama Secretary of State, official precinct-level results. Status: Official precinct-level results (Alabama Secretary of State)
Held under the district lines in effect at the time. Those boundaries differ from the 2026 district.
| Candidate | Party | Votes | Share |
|---|---|---|---|
| Gary Palmer | Republican | 274,160 | 97.1% |
| Write-In | NON | 8,101 | 2.9% |
| Total | 282,261 |
Source: Alabama Secretary of State, official precinct-level results. Status: Official precinct-level results (Alabama Secretary of State)
Certified results from state or county election authorities, as compiled in the Candidate Alerts precinct results database (public API candidatealerts.com/api/district-results). Totals are sums of certified precinct and county-level rows.
Demographics
2020 Census demographics by district are not yet published in this data set.
0 of 180 precincts are above 50%, and 1 are above 25%. Source: Census American Community Survey 2020-2024 5-year block groups, allocated to current precinct shapes by area.
Poll status
Map
Share of adults (18+) who speak Spanish at home, by precinct. Census ACS 2020-2024 5-year estimates on the current precinct layer. Hover a precinct for its value.
Alabama votes on new congressional district lines in 2026. The Census 119th Congress boundary file does not reflect the new lines, so only the state outline is shown here.
Precinct map: past elections and demographics
Choose a layer above. Hover a precinct for its values.
Precinct results
Certified precinct results on current precinct shapes, grouped by county. 183 precincts. "(part)" marks a precinct only partly inside this district; its full vote is shown, so district sums are approximate and are not the official district total. Elections were held under older lines and are shown on the 2026 district.
| County | 2024 President | 2022 Governor | 2020 President | |||
|---|---|---|---|---|---|---|
| Margin | Votes | Margin | Votes | Margin | Votes | |
| Jefferson | R+23.2 | 89,775 | R+34.1 | 60,399 | R+25.1 | 133,221 |
| Shelby | R+42.7 | 63,296 | R+53.7 | 31,817 | R+48.7 | 97,247 |
| Autauga | R+49.6 | 21,875 | R+57.5 | 13,486 | R+50.6 | 24,148 |
| Elmore | R+58.2 | 16,162 | R+65.0 | 12,805 | R+58.5 | 20,709 |
| Chilton | R+75.6 | 11,384 | R+78.3 | 6,767 | R+74.2 | 9,939 |
| Bibb | R+64.7 | 7,617 | R+63.3 | 4,905 | R+60.6 | 7,707 |
| Coosa | R+42.3 | 4,516 | R+41.4 | 3,304 | R+33.6 | 4,572 |
| All counties (approx.) | R+38.9 | 214,625 | R+47.6 | 133,483 | R+39.9 | 297,543 |
Jefferson: 61 precincts
| Precinct | 2024 President | 2022 Governor | 2020 President | |||
|---|---|---|---|---|---|---|
| Margin | Votes | Margin | Votes | Margin | Votes | |
| AFTON LEE COMMUNIT | D+74.4 | 129 | D+89.3 | 84 | - | - |
| AFTON LEE COMMUNIT | - | - | - | - | D+86.8 | 121 |
| BAGLEY ELEMENTARY | R+85.2 | 2,838 | R+86.9 | 1,785 | R+86.4 | 2,815 |
| BARRETT ELEMENTARY | D+87.3 | 1,006 | D+91.0 | 670 | D+88.5 | 1,111 |
| BIRMINGHAM BOTANIC | R+7.3 | 562 | R+33.7 | 392 | R+9.7 | 589 |
| BRADFORD SANCTUARY | R+60.1 | 1,578 | R+72.2 | 1,030 | R+66.4 | 1,605 |
| BROOKWOOD BAPTIST | R+27.2 | 3,620 | - | - | R+38.9 | 2,939 |
| CAHABA HEIGHTS BAP | R+25.4 | 3,260 | R+39.9 | 2,027 | R+30.2 | 3,124 |
| CENTER POINT FIRST | - | - | - | - | D+48.1 | 2,699 |
| CENTER POINT SENIO (part) | - | - | - | - | D+66.9 | 1,816 |
| CHEROKEE BEND ELEM | - | - | - | - | R+37.3 | 1,612 |
| CHURCH OF THE HIGH | R+10.5 | 1,378 | R+28.9 | 964 | R+23.9 | 1,270 |
| CLAY COMMUNITY CEN | R+21.1 | 3,759 | R+37.3 | 2,672 | R+47.1 | 3,745 |
| CORNER SCHOOL | R+86.9 | 1,520 | R+85.5 | 1,051 | R+88.3 | 1,478 |
| CRESTWAY BAPTIST C | - | - | D+33.4 | 1,568 | D+35.6 | 2,030 |
| DON HAWKINS PARK & | - | - | D+43.7 | 1,237 | D+44.7 | 1,655 |
| FULLNESS CHRISTIAN | R+15.3 | 849 | R+28.6 | 535 | R+20.1 | 822 |
| FULTONDALE SENIOR (part) | - | - | - | - | R+19.7 | 1,740 |
| GARDENDALE CIVIC C | R+51.2 | 2,971 | R+62.3 | 2,060 | R+51.7 | 5,324 |
| GARDENDALE MT. VER | - | - | - | - | R+67.9 | 3,313 |
| GUIDING LIGHT CHUR | - | - | R+13.7 | 526 | R+9.1 | 759 |
| HOMEWOOD PUBLIC LI | - | - | - | - | R+4.9 | 3,248 |
| HOOVER PARK & RECR | - | - | - | - | D+39.1 | 3,686 |
| HOOVER PUBLIC LIBR | R+5.9 | 1,259 | R+19.6 | 799 | R+2.6 | 1,330 |
| HUFFMAN BAPTIST CH | - | - | D+58.6 | 2,281 | D+59.3 | 3,281 |
| IRONDALE CITY HALL | D+5.3 | 693 | R+9.5 | 462 | R+0.7 | 685 |
| IRONDALE CIVIC CEN | D+19.2 | 1,888 | D+13.3 | 1,270 | D+10.0 | 1,503 |
| IRONDALE SENIOR CI | D+47.8 | 1,329 | D+48.2 | 759 | D+44.0 | 1,159 |
| KIMBERLY UNITED ME | - | - | R+77.0 | 1,641 | R+78.7 | 2,342 |
| LEEDS CIVIC CENTER | R+14.9 | 1,468 | R+14.1 | 896 | R+11.9 | 1,464 |
| LEEDS FIRST UNITED | R+46.1 | 3,609 | R+57.6 | 2,399 | R+52.3 | 3,324 |
| LIBERTY PARK BAPTI | - | - | - | - | R+48.7 | 3,346 |
| LIFE CHURCH | D+19.2 | 2,119 | D+3.9 | 1,413 | R+3.0 | 2,069 |
| MCELWAIN BAPTIST C | - | - | - | - | R+20.5 | 2,085 |
| METROPOLITAN CHURC | R+50.5 | 3,746 | R+67.6 | 2,576 | R+59.8 | 3,658 |
| MORRIS SENIOR CITI | R+80.7 | 1,717 | R+82.2 | 1,191 | R+83.6 | 1,656 |
| MOUNTAIN BROOK CIT | - | - | R+61.3 | 2,117 | R+42.3 | 3,040 |
| MOUNTAIN BROOK COM | R+29.1 | 2,645 | R+53.9 | 1,828 | R+45.7 | 2,341 |
| MOUNTAIN VIEW BAPT | D+25.7 | 2,105 | D+8.2 | 1,302 | D+7.9 | 2,177 |
| MOUNTAINTOP COMMUN | R+21.7 | 1,611 | - | - | R+25.8 | 1,559 |
| MT. OLIVE COMMUNIT | R+71.7 | 1,519 | R+77.2 | 1,032 | R+82.0 | 3,360 |
| NEW RISING STAR MI | - | - | D+86.4 | 604 | D+83.4 | 933 |
| NORTH PARK BAPTIST | R+49.5 | 3,750 | R+60.4 | 2,342 | R+63.9 | 3,926 |
| OAKMONT CHAPEL PRE | R+32.3 | 2,161 | R+48.2 | 1,530 | R+38.9 | 2,081 |
| OLIVER ELEMENTARY | D+91.5 | 626 | D+93.7 | 477 | D+94.2 | 776 |
| PALMERDALE UNITED | R+38.3 | 1,624 | R+49.4 | 1,153 | R+50.8 | 1,732 |
| ROBINSON ELEMENTAR | D+74.7 | 1,848 | - | - | D+77.5 | 2,016 |
| ROCK SCHOOL CENTER | D+3.4 | 1,957 | R+12.6 | 1,235 | R+15.1 | 2,070 |
| SAINT LUKE'S EPISC | R+34.5 | 1,692 | R+69.2 | 1,196 | R+40.3 | 1,681 |
| SAINT PETER THE AP | R+10.4 | 2,797 | R+23.7 | 1,902 | R+8.4 | 2,957 |
| SAINT THOMAS EPISC | R+20.1 | 2,831 | R+40.8 | 1,595 | R+28.3 | 2,720 |
| SHADES CAHABA ELEM | R+7.2 | 1,423 | R+33.1 | 973 | R+12.6 | 1,368 |
| SHADES MOUNTAIN BA | R+23.2 | 2,342 | - | - | R+27.8 | 2,021 |
| SHADES MOUNTAIN CO | R+24.5 | 3,118 | R+38.9 | 2,132 | R+32.0 | 3,021 |
| TOM BRADFORD PARK | D+57.7 | 2,938 | - | - | D+49.9 | 2,469 |
| TRAFFORD CITY HALL | R+81.9 | 509 | R+86.3 | 350 | R+85.0 | 521 |
| TRUSSVILLE CITY HA | R+39.6 | 1,786 | R+48.8 | 1,080 | R+53.8 | 3,589 |
| TRUSSVILLE FIRST B | R+43.2 | 4,101 | R+53.5 | 2,729 | R+60.1 | 5,019 |
| VESTAVIA CIVIC CEN | R+46.9 | 1,390 | - | - | R+55.4 | 1,275 |
| VESTAVIA HILLS MET | R+35.6 | 3,704 | R+54.4 | 2,534 | R+46.1 | 3,346 |
| WARRIOR CITY HALL | - | - | - | - | R+58.4 | 1,820 |
Shelby: 44 precincts
| Precinct | 2024 President | 2022 Governor | 2020 President | |||
|---|---|---|---|---|---|---|
| Margin | Votes | Margin | Votes | Margin | Votes | |
| 1ST CHRISTIAN CH | R+29.1 | 2,775 | R+42.6 | 1,841 | R+35.0 | 2,704 |
| 1ST PRESBY. CH | - | - | - | - | R+47.1 | 2,927 |
| ALABASTER LIBERTY BAPTIST | - | - | - | - | D+22.8 | 880 |
| ASBURY UN METHODIST | R+52.1 | 2,607 | R+62.4 | 1,679 | R+55.8 | 2,883 |
| BAY SPRINGS BAPTIST | - | - | - | - | R+80.7 | 830 |
| BLACKWATCH SPORTS | - | - | - | - | R+59.7 | 3,740 |
| CAMP BRANCH CIVIC CTR. | - | - | - | - | R+68.3 | 1,005 |
| CHELSEA CHURCH OF GOD | R+57.2 | 3,288 | R+66.2 | 1,994 | R+67.2 | 2,925 |
| CHELSEA COMM. CTR. | R+69.9 | 1,777 | - | - | R+73.6 | 1,551 |
| CHRIST CH UNITED METHODIST | R+50.8 | 1,368 | R+64.7 | 1,042 | - | - |
| CHRIST UN METHODIST | - | - | - | - | R+56.2 | 1,253 |
| CHURCH AT BROOKHILLS | R+21.0 | 3,511 | - | - | R+52.0 | 3,746 |
| CHURCH OF JESUS CHRIST | R+33.0 | 3,209 | R+40.5 | 1,878 | R+48.9 | 2,932 |
| COLUMBIANA REC. BLDG. | - | - | - | - | R+61.5 | 2,461 |
| CONCORD BAPTIST CH | - | - | - | - | R+28.9 | 3,682 |
| DUNNAVANT COMM. CTR. | R+79.9 | 423 | R+82.8 | 274 | R+79.7 | 439 |
| EVANGEL PRESBY. CH | R+38.2 | 3,687 | R+45.9 | 2,342 | R+47.1 | 3,565 |
| FAITH PRESBY. CH | - | - | - | - | R+61.5 | 2,206 |
| FAITH PRESBYTERIAN CH | - | - | R+70.9 | 1,522 | - | - |
| GREYSTONE FARMS CLUB | R+53.6 | 847 | R+66.8 | 611 | R+55.4 | 811 |
| HELENA COMM. CTR. | R+36.9 | 7,544 | - | - | R+47.5 | 7,879 |
| HOOVER FIRE STA. #8 | - | - | - | - | R+53.2 | 1,141 |
| MEADOWBROOK BAPTIST | R+47.9 | 2,613 | R+58.6 | 1,766 | R+29.7 | 3,083 |
| MONTEVALLO PARK & REC. | - | - | - | - | R+8.5 | 1,271 |
| NEW HOPE CUMBERLAND | R+56.0 | 1,775 | R+69.7 | 1,289 | R+63.2 | 1,751 |
| NEW LIFE ASSEMBLY GOD | R+66.7 | 1,356 | - | - | R+66.6 | 2,865 |
| NORTH SHELBY BAPTIST | R+43.9 | 2,176 | - | - | R+55.7 | 1,870 |
| PEA RIDGE COMM. CTR. | R+80.2 | 379 | R+81.0 | 248 | R+79.7 | 395 |
| PELHAM CIVIC COMPLEX | R+21.8 | 7,921 | - | - | R+53.2 | 4,839 |
| PELHAM PARK & REC. CTR. | - | - | - | - | R+26.0 | 4,296 |
| RESTORE-1ST UN METHODIST | - | - | R+38.3 | 4,744 | R+44.5 | 4,425 |
| RIVERCHASE BAPTIST | R+30.0 | 1,902 | R+43.7 | 1,319 | R+37.4 | 1,784 |
| RIVERCHASE CHURCH CHRIST | R+40.5 | 4,162 | - | - | R+30.0 | 2,956 |
| ROY DOWNS MEMORIAL | - | - | R+23.3 | 2,189 | R+30.4 | 3,323 |
| SHELBY IRON WORKS | - | - | - | - | R+75.3 | 963 |
| SHOAL CREEK TOWN HALL | R+56.0 | 1,742 | R+68.8 | 1,229 | R+60.8 | 1,648 |
| SOUTHCREST BAPTIST CH | - | - | - | - | R+57.2 | 2,951 |
| STEWART STUDENT RETREAT | - | - | - | - | R+15.8 | 1,591 |
| TURNER HOLLIS LEGION | - | - | R+61.9 | 226 | R+59.3 | 317 |
| VALLEYDALE BAPTIST | R+47.3 | 4,144 | R+60.1 | 2,951 | R+56.5 | 3,936 |
| VANDIVER SR. CTR. | R+83.8 | 764 | R+82.7 | 496 | R+85.5 | 767 |
| VINCENT REVIVAL CTR. | R+48.7 | 1,201 | R+46.3 | 748 | R+44.5 | 1,188 |
| WILSONVILLE UMC | R+79.2 | 2,125 | R+82.2 | 1,429 | - | - |
| WILSONVILLE UN METHODIST | - | - | - | - | R+79.4 | 1,468 |
Autauga: 18 precincts
| Precinct | 2024 President | 2022 Governor | 2020 President | |||
|---|---|---|---|---|---|---|
| Margin | Votes | Margin | Votes | Margin | Votes | |
| AUTAUGAVILLE VFD | R+8.9 | 716 | R+20.1 | 482 | D+4.1 | 749 |
| BILLINGSLEY COMM. CTR. | R+83.9 | 478 | R+87.6 | 322 | R+78.3 | 474 |
| BOONE'S CHAPEL | R+72.2 | 2,248 | R+77.1 | 1,305 | R+72.9 | 2,018 |
| BOOTH VFD | R+59.0 | 825 | R+57.6 | 556 | R+59.5 | 812 |
| CAMELLIA BAPTIST | R+31.3 | 1,473 | R+38.7 | 943 | R+39.5 | 1,409 |
| CENTRAL AL ELECTRIC | D+9.4 | 286 | D+5.8 | 206 | D+20.8 | 307 |
| COUNTY LINE BAPTIST | R+71.2 | 1,337 | R+78.0 | 822 | R+75.2 | 1,232 |
| DOSTER COMM. CTR. | R+40.4 | 5,165 | R+50.5 | 3,570 | R+44.6 | 4,755 |
| E. MEMORIAL CHRISTIAN | - | - | - | - | R+41.9 | 3,332 |
| HERITAGE BAPTIST | R+46.8 | 2,457 | R+64.0 | 1,598 | R+59.8 | 2,131 |
| INDEPENDENCE VFD | - | - | - | - | R+12.9 | 395 |
| JONES COMM. CTR. | R+31.9 | 379 | R+33.9 | 233 | R+23.0 | 370 |
| MARBURY MIDDLE SCHOOL | R+80.4 | 932 | R+76.9 | 550 | R+80.7 | 883 |
| OLD KINGSTON VFD | R+34.7 | 783 | R+23.6 | 449 | R+23.2 | 716 |
| PRATTMONT BAPTIST | R+42.7 | 915 | R+52.7 | 575 | R+48.4 | 956 |
| TRINITY METHODIST | R+58.2 | 2,180 | R+75.0 | 1,538 | R+67.1 | 2,047 |
| UPPER KINGSTON | R+47.1 | 1,096 | - | - | R+58.1 | 1,001 |
| WHITE CITY VFD | R+53.4 | 605 | R+49.6 | 337 | R+51.2 | 561 |
Elmore: 23 precincts
| Precinct | 2024 President | 2022 Governor | 2020 President | |||
|---|---|---|---|---|---|---|
| Margin | Votes | Margin | Votes | Margin | Votes | |
| ASBURY KENT COMM. | - | - | R+85.9 | 695 | R+78.6 | 1,051 |
| ASBURY-KENT COMM. CTR. | R+79.8 | 1,118 | - | - | - | - |
| CAINS CHAPEL FIRE | - | - | - | - | R+82.3 | 2,165 |
| CAINS CHAPEL LIFE CTR. | R+82.6 | 2,374 | R+84.2 | 1,478 | - | - |
| DEATSVILLE VFD | R+53.4 | 1,290 | R+61.0 | 835 | R+57.5 | 1,268 |
| ECLECTIC METHODIST | R+55.4 | 917 | R+58.9 | 567 | R+52.4 | 909 |
| KOWALIGA FIRE | - | - | R+78.5 | 720 | R+72.9 | 881 |
| KOWALIGA FIRE DEPT. | R+73.3 | 960 | - | - | - | - |
| MILLBROOK CIVIC CTR. | R+14.3 | 2,729 | R+22.4 | 1,540 | R+14.8 | 2,483 |
| NAZARENE | - | - | R+57.3 | 1,937 | R+53.4 | 3,015 |
| NEW HOPE BAPT. | R+89.7 | 889 | R+90.0 | 529 | R+90.3 | 777 |
| REDHILL COMM. | - | - | R+78.7 | 445 | R+71.3 | 543 |
| REDHILL COMM. CTR. | R+73.3 | 602 | - | - | - | - |
| RUSHENVILLE BAPT. (part) | R+84.3 | 860 | R+86.5 | 578 | R+84.2 | 843 |
| SANTUCK COMM. | - | - | R+62.5 | 871 | R+58.8 | 1,272 |
| SANTUCK COMM. CTR. | R+57.2 | 1,328 | - | - | - | - |
| SEMAN COMM. | - | - | R+86.2 | 603 | R+85.5 | 892 |
| TITUS COMM. | - | - | R+74.9 | 303 | R+68.3 | 385 |
| TITUS COMM. CTR. | R+63.6 | 396 | - | - | - | - |
| TRICITY BAPT. | - | - | - | - | R+39.7 | 1,646 |
| VICTORY BAPT. | R+37.5 | 2,104 | R+52.4 | 1,302 | R+48.3 | 2,005 |
| WEOKA COMM. | - | - | R+80.1 | 402 | R+84.7 | 574 |
| WEOKA COMM. CTR. | R+83.2 | 595 | - | - | - | - |
Chilton: 13 precincts
| Precinct | 2024 President | 2022 Governor | 2020 President | |||
|---|---|---|---|---|---|---|
| Margin | Votes | Margin | Votes | Margin | Votes | |
| CANE CREEK GAP OF MTN | R+88.9 | 748 | - | - | - | - |
| CLANTON REC. | R+72.1 | 2,060 | R+83.6 | 1,319 | R+77.2 | 1,910 |
| COLLINS CHAPEL BAPTIST | - | - | - | - | R+83.9 | 404 |
| COLLINS CHAPEL FS | R+82.6 | 413 | R+92.9 | 254 | - | - |
| ENTERPRISE FS | R+77.4 | 1,060 | R+77.3 | 644 | R+76.6 | 944 |
| FAIRVIEW FS | R+79.0 | 776 | R+75.1 | 489 | R+76.0 | 737 |
| ISABELLA FS | R+79.0 | 666 | R+76.5 | 383 | R+75.2 | 637 |
| LIBRARY CLANTON | R+74.9 | 1,205 | R+83.6 | 786 | R+77.3 | 1,138 |
| MAPLESVILLE LIBRARY | R+39.5 | 701 | R+35.1 | 464 | R+33.7 | 691 |
| THORSBY TOWN HALL | R+78.0 | 1,387 | R+81.3 | 902 | R+75.2 | 1,316 |
| UNION GROVE BAPTIST | - | - | R+88.6 | 824 | - | - |
| UNION GROVE BAPTIST CH | R+83.6 | 1,253 | - | - | R+82.0 | 1,126 |
| VERBENA FS | R+76.3 | 1,115 | R+73.5 | 702 | R+74.3 | 1,036 |
Bibb: 9 precincts
| Precinct | 2024 President | 2022 Governor | 2020 President | |||
|---|---|---|---|---|---|---|
| Margin | Votes | Margin | Votes | Margin | Votes | |
| ALTERNATIVE SCHOOL | R+67.3 | 1,813 | R+65.3 | 1,189 | R+64.3 | 1,867 |
| BRENT CITY HALL | D+12.9 | 774 | D+15.0 | 505 | D+24.8 | 882 |
| CENTREVILLE ROCK BLDG | R+66.5 | 1,075 | R+66.7 | 723 | R+64.2 | 1,101 |
| EOLINE FIRE | - | - | - | - | R+77.1 | 682 |
| EOLINE FIRE DEPT. | R+80.9 | 712 | R+82.5 | 479 | - | - |
| GREENPOND FIRE | - | - | - | - | R+83.6 | 1,821 |
| GREENPOND FIRE DEPT. | R+82.0 | 1,855 | R+83.6 | 1,148 | - | - |
| LAWLEY COMM. CTR. | R+76.7 | 472 | R+74.2 | 322 | R+74.7 | 458 |
| SIX MILE COMM. CTR. | R+69.4 | 916 | R+60.9 | 539 | R+66.1 | 896 |
Coosa: 15 precincts
| Precinct | 2024 President | 2022 Governor | 2020 President | |||
|---|---|---|---|---|---|---|
| Margin | Votes | Margin | Votes | Margin | Votes | |
| COMMUNITY LIFE | D+73.2 | 183 | D+76.6 | 154 | D+79.7 | 222 |
| EQUALITY METHODIST | R+73.6 | 436 | R+75.5 | 347 | R+73.0 | 411 |
| GOODWATER COMM CTR | - | - | D+34.7 | 539 | D+51.8 | 826 |
| GOODWATER VFD | D+41.1 | 718 | - | - | - | - |
| HANOVER | R+75.8 | 231 | R+75.6 | 176 | R+73.5 | 230 |
| KELLYTON CIVIC | R+18.6 | 633 | R+19.3 | 517 | R+14.0 | 655 |
| MARBLE VALLEY FD | - | - | R+70.0 | 100 | R+74.8 | 147 |
| MARBLE VALLEY VFD | R+66.3 | 160 | - | - | - | - |
| MT. OLIVE COMM CTR | R+60.9 | 207 | R+47.1 | 140 | R+46.7 | 212 |
| RAY FD | - | - | R+32.9 | 280 | R+20.8 | 395 |
| RAY VFD | R+24.7 | 364 | - | - | - | - |
| RICHVILLE FD | - | - | R+86.6 | 231 | R+79.8 | 258 |
| RICHVILLE VFD | R+80.9 | 293 | - | - | - | - |
| WEOGUFKA VOTING HOUSE | R+92.0 | 410 | R+90.2 | 276 | R+89.8 | 411 |
| WEST COOSA SR. CTR | R+89.6 | 881 | R+91.9 | 544 | R+88.6 | 805 |
2024 President (Kamala D. Harris vs. Donald J. Trump). Source: Alabama Secretary of State, official precinct-level results. Official precinct-level results (Alabama Secretary of State).
2022 Governor (Yolanda Rochelle Flowers vs. Kay Ivey). Source: Alabama Secretary of State, official precinct-level results. Official precinct-level results (Alabama Secretary of State).
2020 President (Joseph R. Biden vs. Donald J. Trump). Source: Alabama Secretary of State, official precinct-level results. Official precinct-level results (Alabama Secretary of State).
Precinct demographics
Demographics are Census American Community Survey (ACS) 2020-2024 5-year estimates for block groups, assigned to precincts by area share. They describe the resident population, not registered or likely voters, and include non-citizens. ACS margins of error are not shown; small precincts carry large error. Area weighting assumes people are spread evenly within each block group, so large rural precincts are the least reliable. Median income is a household-weighted average of block-group medians, an approximation.
| Area | Population | Voting-age pop. | % White non-Hisp. | % Hispanic | % Black | % Asian | Median income* | % Bachelor's+ | % 18-29 (of adults) | % 65+ | % Homeowners | % Below poverty | % Spanish at home (adults) |
|---|---|---|---|---|---|---|---|---|---|---|---|---|---|
| District | 733,173 | 563,515 | 69.0% | 5.9% | 20.0% | 1.7% | $93k | 38.9% | 19.0% | 16.7% | 75.0% | 10.4% | 3.8% |
| Jefferson (in district) | 307,124 | 232,956 | 63.7% | 5.0% | 26.3% | 2.0% | $97k | 43.7% | 19.6% | 16.4% | 69.0% | 11.4% | 3.2% |
| Shelby (in district) | 233,016 | 180,025 | 73.2% | 7.6% | 13.4% | 2.2% | $106k | 46.9% | 18.5% | 16.8% | 81.3% | 7.2% | 5.0% |
| Autauga (in district) | 60,274 | 46,162 | 70.6% | 3.8% | 20.4% | 1.1% | $78k | 29.2% | 18.4% | 16.3% | 77.1% | 11.3% | 2.3% |
| Elmore (in district) | 51,294 | 40,793 | 71.6% | 3.4% | 20.3% | 0.7% | $76k | 25.6% | 19.3% | 15.8% | 76.9% | 9.3% | 1.6% |
| Chilton (in district) | 46,250 | 35,084 | 76.4% | 10.2% | 9.4% | 0.4% | $66k | 16.5% | 19.1% | 17.0% | 76.8% | 14.0% | 7.1% |
| Bibb (in district) | 22,212 | 17,756 | 73.3% | 3.5% | 19.8% | 0.4% | $53k | 11.7% | 18.6% | 17.4% | 79.1% | 22.5% | 1.8% |
| Coosa (in district) | 10,347 | 8,543 | 66.0% | 2.5% | 29.2% | 0.3% | $63k | 13.9% | 14.3% | 25.3% | 81.6% | 13.1% | 1.1% |
| Talladega (in district) | 2,657 | 2,195 | 68.8% | 14.2% | 11.7% | 2.0% | $69k | 18.9% | 16.6% | 16.6% | 78.7% | 14.1% | 11.3% |
Jefferson: 63 precincts
| Precinct | Population | Voting-age pop. | % White non-Hisp. | % Hispanic | % Black | % Asian | Median income* | % Bachelor's+ | % 18-29 (of adults) | % 65+ | % Homeowners | % Below poverty | % Spanish at home (adults) |
|---|---|---|---|---|---|---|---|---|---|---|---|---|---|
| Afton Lee Comm Ctr (part) | 817 | 654 | 79.6% | 7.7% | 9.8% | 1.2% | $151k | 65.5% | 29.9% | 15.4% | 66.5% | 15.5% | 6.4% |
| Bagley Jr HS | 4,652 | 3,679 | 98.2% | 0.0% | 0.4% | 0.0% | $82k | 18.8% | 20.3% | 19.6% | 97.4% | 3.2% | 0.8% |
| Barrett Elem Sch | 2,816 | 2,299 | 15.0% | 5.3% | 76.5% | 0.7% | $40k | 12.9% | 19.0% | 14.5% | 42.0% | 28.6% | 4.0% |
| Birmingham Botanical Gardens | 2,261 | 1,726 | 91.1% | 0.6% | 0.3% | 0.2% | $215k | 90.6% | 11.9% | 18.1% | 72.4% | 7.8% | 0.5% |
| Birmingham FD #12 | 3,440 | 2,525 | 32.9% | 6.5% | 58.6% | 0.6% | $60k | 45.9% | 21.6% | 11.4% | 54.0% | 29.2% | 6.5% |
| Bradford Sanctuary of Praise | 3,673 | 2,783 | 74.3% | 10.9% | 13.6% | 0.0% | $74k | 8.5% | 8.9% | 18.8% | 81.5% | 11.0% | 5.9% |
| Brookwood Bapt Church | 4,640 | 3,434 | 90.5% | 2.2% | 5.3% | 0.7% | $163k | 76.1% | 8.9% | 20.9% | 87.2% | 4.3% | 0.5% |
| Center Pt 1st Bapt | 10,011 | 6,862 | 19.8% | 8.5% | 69.8% | 0.0% | $50k | 20.2% | 19.6% | 10.0% | 63.6% | 16.8% | 6.1% |
| Center Pt Comm Ctr (part) | 1,096 | 803 | 11.8% | 5.0% | 79.4% | 0.3% | $56k | 11.9% | 24.0% | 11.3% | 47.3% | 12.4% | 3.6% |
| Cherokee Bend Elem Sch | 2,709 | 2,164 | 78.7% | 2.5% | 14.4% | 0.2% | $169k | 72.9% | 18.6% | 17.6% | 71.2% | 9.1% | 1.0% |
| Church at Grants Mill | 2,919 | 2,362 | 62.2% | 15.4% | 18.2% | 0.7% | $96k | 43.7% | 13.5% | 19.2% | 76.7% | 14.5% | 19.1% |
| Church of the Highlands | 2,953 | 2,388 | 71.2% | 7.4% | 19.1% | 0.4% | $121k | 61.3% | 16.2% | 25.9% | 99.1% | 3.3% | 1.9% |
| Clay Comm Ctr | 7,996 | 5,611 | 54.7% | 4.2% | 34.6% | 0.6% | $103k | 23.3% | 13.1% | 15.0% | 91.4% | 12.8% | 1.3% |
| Corner Sch | 3,107 | 2,002 | 94.2% | 1.2% | 0.0% | 0.9% | $87k | 16.7% | 12.9% | 13.7% | 94.4% | 6.6% | 0.0% |
| Crestwood Ed Ctr | 4,391 | 3,716 | 77.7% | 3.0% | 16.1% | 1.4% | $106k | 69.1% | 26.2% | 14.6% | 74.1% | 5.2% | 1.3% |
| Don Hawkins Pk & Rec | 4,182 | 3,354 | 44.8% | 2.3% | 51.8% | 0.0% | $70k | 40.9% | 14.9% | 24.0% | 80.4% | 4.6% | 1.6% |
| East Pinson Valley Ctr | 7,453 | 5,615 | 18.5% | 10.4% | 69.7% | 0.0% | $60k | 17.3% | 19.9% | 15.0% | 53.6% | 27.3% | 7.0% |
| Fullness Christian Fellowship | 2,017 | 1,621 | 57.7% | 4.0% | 29.8% | 6.4% | $82k | 65.6% | 31.6% | 11.3% | 43.2% | 16.1% | 3.4% |
| Fultondale Sr Citizens Bldg (part) | 1,782 | 1,456 | 65.7% | 8.3% | 21.7% | 0.9% | $64k | 28.3% | 24.6% | 17.5% | 67.7% | 9.1% | 6.7% |
| Gardendale Civic Ctr | 10,425 | 8,063 | 70.5% | 1.5% | 22.3% | 0.2% | $75k | 30.0% | 20.3% | 16.6% | 75.8% | 5.6% | 0.6% |
| Gardendale Mt Vernon UM | 6,501 | 4,797 | 74.4% | 4.1% | 14.2% | 0.2% | $89k | 32.4% | 11.5% | 21.5% | 88.1% | 3.7% | 1.6% |
| Guiding Light Church | 2,677 | 2,174 | 57.3% | 16.3% | 23.0% | 0.5% | $64k | 32.1% | 23.0% | 16.1% | 64.4% | 14.6% | 13.8% |
| Homewood Public Lib | 11,208 | 9,174 | 76.3% | 2.5% | 13.8% | 4.2% | $103k | 62.0% | 42.2% | 14.7% | 63.1% | 13.7% | 1.0% |
| Hoover Pk & Rec Ctr | 14,255 | 10,785 | 36.0% | 10.0% | 49.4% | 1.8% | $65k | 42.9% | 39.6% | 9.0% | 20.3% | 8.2% | 8.2% |
| Hoover Public Library | 2,744 | 2,051 | 75.6% | 8.8% | 8.4% | 4.2% | $77k | 62.3% | 20.4% | 9.9% | 64.7% | 9.1% | 4.4% |
| Horizon Church | 5,629 | 4,518 | 84.9% | 1.7% | 3.2% | 8.8% | $99k | 50.4% | 19.6% | 18.1% | 78.2% | 6.9% | 1.1% |
| Irondale City Hall | 2,387 | 1,781 | 52.3% | 2.7% | 37.0% | 0.6% | $67k | 33.0% | 27.6% | 15.2% | 66.2% | 18.1% | 0.9% |
| Irondale Sr Citizens Bldg | 2,541 | 2,217 | 60.6% | 6.9% | 25.7% | 0.0% | $86k | 56.5% | 33.5% | 19.7% | 52.6% | 6.8% | 3.5% |
| Kimberly UM church | 5,076 | 3,640 | 92.5% | 0.7% | 5.1% | 0.1% | $86k | 30.7% | 14.0% | 13.0% | 89.6% | 8.0% | 0.1% |
| Leeds 1st UM Church | 7,086 | 5,026 | 82.8% | 5.7% | 8.1% | 0.4% | $90k | 39.8% | 16.1% | 16.9% | 78.7% | 3.5% | 4.6% |
| Leeds Civic Ctr | 3,195 | 2,382 | 47.4% | 26.1% | 23.6% | 0.4% | $57k | 19.6% | 24.1% | 15.4% | 53.0% | 29.6% | 23.4% |
| Liberty Pk Bapt Church | 5,862 | 3,854 | 76.5% | 6.2% | 7.7% | 6.0% | $186k | 83.5% | 7.8% | 14.6% | 92.0% | 10.4% | 2.0% |
| Life Church | 5,718 | 3,988 | 36.0% | 13.5% | 41.4% | 5.1% | $54k | 21.8% | 19.7% | 15.7% | 81.9% | 19.7% | 5.3% |
| McElwain Bapt Church | 4,107 | 3,510 | 74.6% | 10.8% | 12.6% | 0.9% | $97k | 57.4% | 36.9% | 16.6% | 61.2% | 13.4% | 6.4% |
| Metropolitan/Rocky Rdg | 5,089 | 3,492 | 91.2% | 3.2% | 1.9% | 1.8% | $164k | 78.4% | 7.3% | 21.2% | 90.8% | 3.9% | 1.3% |
| Morris Sr Citizens Bldg | 2,697 | 2,067 | 91.6% | 1.4% | 4.5% | 0.4% | $92k | 30.6% | 16.3% | 15.0% | 89.0% | 3.9% | 1.2% |
| Mountain Brook City Hall | 5,674 | 4,275 | 95.7% | 0.9% | 0.0% | 1.7% | $149k | 91.1% | 19.8% | 18.3% | 76.9% | 3.5% | 1.2% |
| Mountain Brook Comm Church | 4,161 | 2,959 | 93.3% | 1.6% | 1.5% | 0.8% | $172k | 83.1% | 8.7% | 20.4% | 83.2% | 2.8% | 1.9% |
| Mountain Brook Elem Sch | 2,816 | 2,287 | 90.8% | 0.3% | 6.2% | 0.4% | $204k | 59.7% | 6.1% | 27.5% | 97.9% | 22.5% | 0.0% |
| Mountain View Bapt | 5,472 | 4,349 | 32.0% | 5.6% | 59.3% | 0.8% | $74k | 33.8% | 22.7% | 12.7% | 67.2% | 20.2% | 3.8% |
| Mountaintop Comm Church | 3,234 | 2,333 | 62.3% | 2.1% | 22.6% | 8.9% | $87k | 64.2% | 25.5% | 14.4% | 52.0% | 4.8% | 2.1% |
| Mt Olive Comm Ctr | 5,313 | 3,942 | 80.9% | 6.6% | 7.2% | 3.7% | $101k | 25.2% | 15.8% | 18.3% | 91.3% | 7.5% | 4.3% |
| New Merkel Cahaba Hts Ctr | 5,057 | 4,048 | 86.0% | 5.1% | 4.7% | 2.1% | $108k | 73.8% | 20.5% | 16.1% | 54.5% | 8.2% | 4.5% |
| New Rising Star Church | 3,392 | 2,720 | 11.0% | 2.7% | 84.3% | 0.0% | $33k | 19.3% | 21.5% | 15.2% | 37.0% | 34.9% | 0.7% |
| Oakmont Presb Church | 3,308 | 2,611 | 80.0% | 2.3% | 7.8% | 9.2% | $134k | 64.0% | 9.5% | 19.6% | 88.2% | 1.4% | 1.2% |
| Oliver Elem Sch | 1,790 | 1,196 | 9.9% | 10.0% | 73.8% | 0.0% | $27k | 19.8% | 23.4% | 14.3% | 31.0% | 39.6% | 0.1% |
| Our Lady of Lourdes Church | 9,823 | 6,781 | 18.1% | 2.8% | 78.1% | 0.5% | $59k | 23.7% | 17.8% | 15.2% | 57.1% | 23.2% | 2.9% |
| Palmerdale UM Church | 4,307 | 3,153 | 62.8% | 2.4% | 29.4% | 0.0% | $98k | 20.1% | 11.7% | 15.8% | 89.4% | 2.2% | 3.6% |
| Robinson Elem Sch | 3,747 | 3,136 | 19.8% | 11.1% | 64.0% | 1.5% | $40k | 15.3% | 26.3% | 15.4% | 34.8% | 35.4% | 5.4% |
| Rock School Ctr | 4,401 | 2,919 | 47.2% | 3.3% | 38.7% | 7.7% | $75k | 16.3% | 18.5% | 10.3% | 81.0% | 20.4% | 3.6% |
| Saint Lukes Church | 3,046 | 1,995 | 97.5% | 1.4% | 0.0% | 0.0% | $220k | 91.2% | 4.0% | 13.0% | 98.3% | 3.7% | 3.0% |
| Saint Thomas Church | 5,875 | 5,084 | 69.6% | 2.0% | 21.9% | 2.2% | $81k | 61.4% | 34.9% | 10.6% | 24.2% | 9.5% | 1.2% |
| Shades Cahaba Elem Sch | 2,432 | 1,823 | 86.1% | 2.3% | 2.6% | 1.9% | $215k | 80.1% | 18.0% | 16.6% | 89.5% | 4.6% | 2.3% |
| Shades Mtn Comm Church | 6,757 | 5,225 | 80.7% | 2.0% | 12.9% | 1.6% | $114k | 67.2% | 15.4% | 14.1% | 73.5% | 7.5% | 1.6% |
| St Peter Apostle Church | 7,393 | 5,678 | 55.6% | 13.6% | 23.6% | 3.6% | $65k | 43.6% | 24.6% | 14.8% | 54.0% | 11.0% | 6.2% |
| Tom Bradford Pk | 6,239 | 4,950 | 25.1% | 0.9% | 69.8% | 1.2% | $67k | 25.4% | 20.3% | 18.8% | 68.4% | 25.7% | 0.5% |
| Town Village Vestavia | 2,348 | 1,773 | 95.2% | 2.8% | 0.6% | 1.0% | $113k | 70.8% | 8.0% | 28.2% | 64.2% | 4.6% | 2.2% |
| Trafford City Hall | 1,117 | 901 | 95.2% | 0.1% | 2.8% | 0.0% | $86k | 18.4% | 17.6% | 16.8% | 90.8% | 12.6% | 0.0% |
| Trussville !st Bapt | 8,302 | 6,524 | 80.3% | 4.3% | 9.6% | 2.9% | $121k | 53.1% | 12.8% | 19.1% | 78.8% | 2.1% | 0.2% |
| Trussville City Hall | 10,479 | 8,082 | 75.8% | 3.9% | 14.0% | 2.7% | $107k | 32.8% | 12.7% | 19.0% | 79.7% | 4.2% | 2.3% |
| Trussville/North Park | 8,676 | 6,182 | 78.4% | 2.1% | 12.1% | 5.0% | $121k | 39.2% | 8.8% | 18.4% | 95.9% | 1.5% | 0.7% |
| Vestavia Hills UM | 8,245 | 6,442 | 85.9% | 2.5% | 4.7% | 5.7% | $166k | 58.4% | 11.0% | 23.7% | 83.8% | 14.6% | 0.7% |
| Warrior City Hall | 3,609 | 3,022 | 73.1% | 1.1% | 22.2% | 0.0% | $60k | 9.1% | 19.8% | 21.7% | 67.8% | 15.9% | 0.0% |
Shelby: 43 precincts
| Precinct | Population | Voting-age pop. | % White non-Hisp. | % Hispanic | % Black | % Asian | Median income* | % Bachelor's+ | % 18-29 (of adults) | % 65+ | % Homeowners | % Below poverty | % Spanish at home (adults) |
|---|---|---|---|---|---|---|---|---|---|---|---|---|---|
| 1st Christian Church | 6,343 | 5,178 | 74.2% | 3.6% | 16.8% | 3.4% | $86k | 64.6% | 21.3% | 18.9% | 50.9% | 10.3% | 4.1% |
| 1st Pres Church | 7,483 | 5,629 | 68.2% | 12.0% | 15.5% | 1.3% | $91k | 40.0% | 14.5% | 14.0% | 92.0% | 8.0% | 10.6% |
| Alabaster Liberty Bapt | 1,971 | 1,489 | 43.9% | 23.9% | 25.1% | 0.6% | $62k | 25.6% | 29.8% | 19.1% | 57.2% | 10.0% | 12.6% |
| Asbury United Meth | 6,069 | 4,732 | 79.4% | 3.5% | 5.6% | 6.0% | $132k | 59.2% | 15.4% | 17.6% | 84.1% | 6.5% | 1.2% |
| Bay Springs Bapt | 1,779 | 1,405 | 84.2% | 4.6% | 0.6% | 0.8% | $96k | 28.4% | 10.1% | 25.6% | 77.4% | 11.9% | 1.5% |
| Blackwatch Sports | 7,932 | 6,129 | 75.8% | 9.3% | 9.8% | 1.0% | $127k | 58.7% | 21.9% | 17.8% | 88.2% | 4.8% | 4.8% |
| Camp Branch Civic Ctr | 1,532 | 1,119 | 67.7% | 19.7% | 11.0% | 0.1% | $97k | 38.5% | 13.9% | 10.1% | 66.5% | 12.5% | 9.7% |
| Chelsea Church of God | 6,763 | 4,949 | 83.0% | 5.5% | 7.2% | 0.3% | $146k | 52.7% | 9.4% | 17.8% | 93.6% | 4.5% | 2.9% |
| Chelsea Comm Ctr | 4,133 | 3,313 | 84.2% | 1.5% | 6.1% | 1.1% | $123k | 42.0% | 17.0% | 23.6% | 95.3% | 3.1% | 0.6% |
| Christ United Meth | 2,605 | 2,144 | 84.9% | 5.4% | 3.1% | 4.2% | $90k | 70.6% | 7.3% | 27.6% | 89.8% | 3.2% | 2.9% |
| Church of Jesus Christ | 6,689 | 4,952 | 64.0% | 14.5% | 18.7% | 0.7% | $101k | 44.7% | 14.7% | 14.3% | 91.4% | 9.2% | 9.0% |
| Columbiana Rec Bldg | 8,459 | 6,849 | 71.2% | 5.8% | 18.3% | 0.1% | $95k | 19.7% | 18.6% | 14.4% | 78.8% | 9.2% | 4.3% |
| Concord Bapt Church | 8,614 | 6,760 | 64.7% | 6.4% | 26.5% | 1.1% | $90k | 37.9% | 22.0% | 9.7% | 81.6% | 6.3% | 2.6% |
| Dunnavant Comm Ctr | 891 | 729 | 98.0% | 0.0% | 0.0% | 0.0% | $67k | 15.0% | 3.6% | 22.6% | 75.3% | 20.5% | 0.0% |
| Evangel Presby Church | 8,576 | 6,696 | 73.1% | 8.9% | 13.6% | 1.0% | $107k | 39.4% | 22.5% | 14.4% | 91.6% | 3.3% | 4.5% |
| Faith Presby Church | 4,568 | 3,169 | 79.2% | 7.0% | 8.1% | 0.8% | $146k | 62.6% | 9.6% | 13.2% | 92.5% | 8.7% | 6.1% |
| Fourmile VFD | 1,789 | 1,347 | 90.5% | 1.5% | 5.1% | 0.1% | $95k | 25.9% | 13.1% | 18.2% | 85.3% | 7.8% | 1.3% |
| Greystone Farms CH | 1,425 | 1,114 | 89.1% | 0.0% | 4.9% | 3.8% | $90k | 58.6% | 6.4% | 40.4% | 83.2% | 0.4% | 0.0% |
| Harpersville Town Hall | 1,760 | 1,353 | 82.6% | 5.9% | 8.3% | 0.6% | $73k | 22.4% | 16.5% | 19.9% | 82.5% | 6.7% | 5.3% |
| Helena Comm Ctr | 21,322 | 14,920 | 74.3% | 6.9% | 11.5% | 2.2% | $113k | 51.4% | 19.0% | 10.5% | 91.3% | 3.9% | 4.8% |
| Hoover Fire #8 | 1,736 | 1,535 | 96.0% | 0.1% | 0.3% | 3.6% | $96k | 63.7% | 20.9% | 31.5% | 71.9% | 2.6% | 0.0% |
| MeadowBrook Bapt | 7,278 | 6,204 | 61.5% | 7.3% | 18.8% | 5.7% | $85k | 65.8% | 24.4% | 12.5% | 47.6% | 6.1% | 5.1% |
| Montevallo Prk & Rec | 4,440 | 3,523 | 42.7% | 17.6% | 32.1% | 2.2% | $51k | 15.2% | 32.1% | 12.4% | 65.5% | 21.3% | 14.4% |
| New Hope Cumberland Presby | 3,595 | 2,566 | 87.6% | 3.1% | 6.2% | 1.5% | $141k | 75.3% | 13.3% | 17.9% | 92.5% | 1.8% | 0.6% |
| New Life Assembly of God | 6,220 | 4,635 | 81.1% | 4.7% | 9.2% | 0.7% | $104k | 38.9% | 17.8% | 18.5% | 85.5% | 4.6% | 2.5% |
| North Shelby Bapt | 4,750 | 3,811 | 78.5% | 5.3% | 13.6% | 0.5% | $142k | 65.1% | 18.9% | 19.6% | 88.4% | 6.9% | 4.1% |
| Pea Ridge Comm Ctr | 755 | 651 | 92.8% | 3.8% | 0.3% | 0.0% | $61k | 12.6% | 12.4% | 22.5% | 92.9% | 15.5% | 2.1% |
| Pelham Civic Complex | 10,668 | 8,057 | 66.8% | 13.0% | 12.1% | 2.4% | $104k | 42.8% | 14.7% | 18.1% | 79.9% | 9.2% | 7.9% |
| Pelham Park Rec Ctr | 7,925 | 6,236 | 63.5% | 20.1% | 10.9% | 2.3% | $78k | 42.5% | 22.3% | 12.6% | 71.6% | 7.0% | 15.6% |
| Restore-1st UM | 12,060 | 8,855 | 70.5% | 11.8% | 13.2% | 1.4% | $93k | 40.2% | 18.8% | 14.2% | 87.5% | 10.0% | 7.5% |
| Riverchase Bapt | 3,906 | 3,062 | 72.9% | 2.3% | 13.8% | 7.4% | $116k | 63.0% | 14.0% | 23.8% | 84.1% | 7.6% | 1.5% |
| Riverchase Church Christ | 5,597 | 4,783 | 66.3% | 5.3% | 17.1% | 5.8% | $104k | 69.4% | 13.2% | 27.2% | 66.7% | 5.5% | 2.2% |
| Roy Downs Memorial Library | 10,234 | 7,483 | 56.5% | 10.4% | 31.2% | 0.1% | $85k | 32.4% | 22.6% | 9.3% | 78.2% | 9.1% | 9.4% |
| Shelby Iron Wrks Prk | 2,731 | 2,217 | 80.1% | 2.7% | 9.7% | 0.0% | $66k | 23.5% | 15.0% | 24.2% | 86.5% | 18.8% | 1.6% |
| Shoal Creek Town Hall | 2,475 | 1,995 | 91.1% | 2.6% | 0.1% | 0.9% | $165k | 65.6% | 10.6% | 25.4% | 92.6% | 3.3% | 1.7% |
| Southcrest Bapt Church | 7,544 | 5,683 | 78.2% | 3.6% | 12.1% | 5.1% | $189k | 62.0% | 17.7% | 13.1% | 95.1% | 1.0% | 3.7% |
| Stewart Student Retreat | 5,207 | 4,505 | 67.5% | 11.6% | 17.5% | 1.1% | $49k | 27.9% | 51.6% | 15.2% | 64.1% | 16.2% | 6.3% |
| The Church at Brook Hills | 9,214 | 7,491 | 80.5% | 1.3% | 11.4% | 5.6% | $152k | 56.9% | 16.3% | 25.5% | 70.5% | 2.9% | 1.2% |
| Turner-Hollis Legion #195 | 877 | 720 | 81.2% | 5.5% | 4.6% | 0.0% | $72k | 27.2% | 18.4% | 27.6% | 89.5% | 14.5% | 1.9% |
| Valleydale Bapt Church | 7,447 | 6,019 | 87.6% | 2.6% | 3.1% | 4.2% | $143k | 64.9% | 12.3% | 24.0% | 96.0% | 4.5% | 1.4% |
| Vandier-Sterrett Sr Ctr | 2,414 | 1,955 | 82.4% | 3.1% | 9.3% | 0.5% | $94k | 29.9% | 14.4% | 20.7% | 83.1% | 10.5% | 0.4% |
| Vincent Revival Ctr | 2,532 | 1,963 | 73.4% | 2.5% | 19.4% | 0.0% | $52k | 13.6% | 12.0% | 24.0% | 86.8% | 22.0% | 1.3% |
| Wilsonville UM Church | 2,704 | 2,101 | 88.3% | 3.0% | 5.0% | 0.4% | $98k | 20.5% | 12.1% | 21.8% | 83.8% | 11.7% | 1.6% |
Autauga: 18 precincts
| Precinct | Population | Voting-age pop. | % White non-Hisp. | % Hispanic | % Black | % Asian | Median income* | % Bachelor's+ | % 18-29 (of adults) | % 65+ | % Homeowners | % Below poverty | % Spanish at home (adults) |
|---|---|---|---|---|---|---|---|---|---|---|---|---|---|
| Autaugaville VFD | 1,265 | 969 | 47.5% | 2.3% | 50.0% | 0.2% | $50k | 10.2% | 10.9% | 20.1% | 92.3% | 23.3% | 2.5% |
| Billingsley Community Ctr | 1,584 | 1,264 | 93.8% | 2.3% | 3.6% | 0.0% | $68k | 12.1% | 18.7% | 6.7% | 95.8% | 24.0% | 1.0% |
| Boone's Chapel | 4,749 | 3,597 | 89.2% | 0.8% | 4.0% | 0.2% | $76k | 20.6% | 19.8% | 17.9% | 85.0% | 6.1% | 0.3% |
| Booth VFD | 1,944 | 1,455 | 65.6% | 0.0% | 32.9% | 0.1% | $39k | 13.5% | 10.1% | 13.2% | 92.0% | 34.0% | 0.5% |
| Camellia Baptist Church | 3,251 | 2,477 | 64.3% | 3.8% | 27.5% | 0.0% | $64k | 12.4% | 19.9% | 14.7% | 66.2% | 7.2% | 1.3% |
| Central AL Electric Co-Op | 838 | 746 | 51.2% | 2.3% | 46.5% | 0.0% | $29k | 12.5% | 22.2% | 25.5% | 95.1% | 8.0% | 2.2% |
| County Line Baptist Church | 2,682 | 1,994 | 87.0% | 0.1% | 12.3% | 0.0% | $99k | 31.0% | 15.7% | 15.7% | 93.0% | 2.4% | 1.2% |
| Doster Community Ctr | 11,785 | 9,131 | 65.6% | 3.0% | 25.3% | 1.9% | $74k | 28.3% | 20.6% | 18.3% | 74.7% | 11.7% | 2.8% |
| East Memorial Christian Academy | 10,210 | 7,356 | 63.1% | 6.0% | 23.4% | 2.8% | $102k | 46.5% | 19.7% | 10.9% | 64.4% | 7.8% | 5.7% |
| Heritage Baptist Church | 5,098 | 4,014 | 79.0% | 5.3% | 9.3% | 2.1% | $86k | 42.6% | 17.1% | 16.6% | 69.4% | 3.1% | 1.0% |
| Independence VFD | 1,221 | 900 | 40.6% | 8.8% | 49.1% | 0.1% | $62k | 6.9% | 14.1% | 14.3% | 86.3% | 15.1% | 6.3% |
| Jones Community Ctr | 661 | 585 | 45.1% | 1.4% | 49.8% | 0.0% | $53k | 4.6% | 25.1% | 26.0% | 84.3% | 6.2% | 0.9% |
| Marbury Middle School | 2,756 | 2,004 | 81.6% | 9.3% | 3.6% | 0.2% | $82k | 24.1% | 19.8% | 11.2% | 96.6% | 10.7% | 1.2% |
| Old Kingston VFD | 1,394 | 1,120 | 68.6% | 4.6% | 25.5% | 0.0% | $59k | 11.8% | 16.1% | 17.0% | 83.8% | 19.6% | 2.9% |
| Prattmont Baptist Church | 2,534 | 1,778 | 59.7% | 0.6% | 35.4% | 0.0% | $66k | 28.1% | 10.0% | 13.3% | 77.3% | 16.2% | 1.6% |
| Trinity Methodist Church | 4,743 | 3,816 | 83.3% | 2.7% | 9.3% | 0.4% | $74k | 34.7% | 22.0% | 24.1% | 71.5% | 18.0% | 1.6% |
| Upper Kingston Community Ctr | 2,007 | 1,772 | 68.9% | 7.2% | 16.1% | 0.0% | $91k | 44.2% | 16.9% | 21.1% | 73.7% | 13.7% | 0.3% |
| White City VF Station | 1,552 | 1,185 | 69.5% | 5.2% | 19.6% | 0.2% | $59k | 21.8% | 12.6% | 21.1% | 84.7% | 10.3% | 3.1% |
Elmore: 17 precincts
| Precinct | Population | Voting-age pop. | % White non-Hisp. | % Hispanic | % Black | % Asian | Median income* | % Bachelor's+ | % 18-29 (of adults) | % 65+ | % Homeowners | % Below poverty | % Spanish at home (adults) |
|---|---|---|---|---|---|---|---|---|---|---|---|---|---|
| Asbury-Kent Comm Ctr | 2,037 | 1,629 | 91.5% | 0.3% | 6.8% | 0.0% | $54k | 17.4% | 14.8% | 18.5% | 78.8% | 9.6% | 0.0% |
| Buyck FD | 1,498 | 1,070 | 84.9% | 0.0% | 5.1% | 0.0% | $75k | 25.2% | 18.0% | 12.2% | 89.5% | 19.8% | 0.0% |
| Cains Chapel Life Ctr | 5,392 | 4,247 | 72.5% | 1.8% | 21.2% | 0.2% | $78k | 15.8% | 17.7% | 11.6% | 81.5% | 7.7% | 0.7% |
| Deatsville VFD | 4,431 | 3,688 | 55.6% | 3.5% | 37.3% | 0.3% | $103k | 18.6% | 21.5% | 10.2% | 86.1% | 6.9% | 2.6% |
| Eclectic Church | 952 | 759 | 87.6% | 0.1% | 10.8% | 0.0% | $57k | 16.8% | 14.4% | 22.1% | 81.0% | 11.7% | 0.0% |
| Grandview Pines Church | 3,626 | 2,850 | 58.4% | 3.1% | 32.8% | 0.2% | $94k | 30.6% | 26.2% | 12.7% | 82.2% | 6.6% | 1.5% |
| Kowaliga Fire Dept. | 1,616 | 1,485 | 93.8% | 2.6% | 0.4% | 0.0% | $76k | 41.3% | 4.6% | 45.1% | 93.5% | 6.2% | 0.7% |
| Millbrook Civic Ctr | 7,754 | 6,265 | 55.0% | 5.3% | 33.4% | 1.0% | $71k | 36.3% | 26.9% | 12.6% | 59.5% | 11.5% | 3.0% |
| Nazarene | 7,554 | 5,711 | 67.8% | 6.3% | 19.1% | 2.7% | $72k | 30.1% | 18.4% | 14.2% | 70.8% | 8.8% | 3.2% |
| New Hope Church | 1,887 | 1,368 | 94.9% | 0.0% | 2.8% | 1.1% | $90k | 20.9% | 10.2% | 14.1% | 83.5% | 2.9% | 0.0% |
| Redhill Comm Ctr | 1,065 | 903 | 88.8% | 0.4% | 4.1% | 0.0% | $70k | 22.0% | 10.0% | 23.3% | 72.3% | 3.6% | 0.4% |
| Rushenville Church (part) | 499 | 395 | 86.5% | 1.7% | 9.0% | 0.0% | $73k | 21.9% | 12.0% | 24.2% | 81.8% | 9.0% | 0.3% |
| Santuck Comm Ctr | 3,146 | 2,456 | 81.3% | 5.2% | 11.2% | 0.0% | $88k | 19.1% | 8.8% | 19.6% | 87.9% | 5.6% | 2.5% |
| Seman Comm Ctr | 2,021 | 1,731 | 84.9% | 0.8% | 12.8% | 0.0% | $77k | 22.0% | 12.4% | 27.5% | 92.9% | 8.1% | 0.2% |
| Titus Comm Ctr | 1,140 | 791 | 93.0% | 0.0% | 2.1% | 0.0% | $62k | 28.1% | 9.6% | 15.1% | 77.6% | 32.6% | 0.0% |
| Victory Baptist | 5,025 | 3,965 | 69.3% | 4.6% | 24.3% | 0.0% | $60k | 27.8% | 28.5% | 15.8% | 70.8% | 9.3% | 0.8% |
| Weoka Comm Ctr | 1,651 | 1,479 | 85.2% | 0.3% | 4.3% | 0.0% | $108k | 18.8% | 21.9% | 14.9% | 93.4% | 10.5% | 0.1% |
Chilton: 18 precincts
| Precinct | Population | Voting-age pop. | % White non-Hisp. | % Hispanic | % Black | % Asian | Median income* | % Bachelor's+ | % 18-29 (of adults) | % 65+ | % Homeowners | % Below poverty | % Spanish at home (adults) |
|---|---|---|---|---|---|---|---|---|---|---|---|---|---|
| Cane Creek Fire St | 2,337 | 1,743 | 95.5% | 0.7% | 1.0% | 0.0% | $78k | 21.3% | 23.0% | 12.6% | 83.1% | 14.9% | 0.5% |
| Chilton Courthouse | 3,059 | 2,120 | 78.5% | 10.2% | 8.4% | 0.0% | $54k | 13.8% | 30.6% | 14.7% | 65.0% | 13.0% | 0.8% |
| City of Jemison | 2,870 | 2,193 | 79.0% | 9.7% | 8.2% | 0.6% | $70k | 12.5% | 20.3% | 15.5% | 75.4% | 11.2% | 6.1% |
| Clanton Library | 3,098 | 2,304 | 81.1% | 2.3% | 10.4% | 1.4% | $69k | 20.3% | 17.2% | 13.8% | 72.5% | 16.4% | 2.2% |
| Clanton Rec Ctr | 4,234 | 3,273 | 89.1% | 2.1% | 6.0% | 0.0% | $59k | 19.6% | 17.9% | 25.0% | 71.9% | 15.5% | 0.6% |
| Collins Chapel Fire St | 1,341 | 1,077 | 84.4% | 4.2% | 8.9% | 0.1% | $79k | 17.8% | 16.6% | 18.8% | 84.0% | 6.7% | 3.1% |
| Douglas Glass Amer. Legion #6 | 2,484 | 2,021 | 45.8% | 11.6% | 38.5% | 0.0% | $87k | 15.7% | 25.6% | 17.0% | 51.2% | 18.2% | 9.7% |
| Enterprise Fire St | 2,402 | 2,077 | 89.4% | 1.5% | 4.4% | 0.0% | $60k | 11.5% | 16.3% | 20.9% | 78.5% | 16.6% | 1.4% |
| Fairview Fire St | 1,653 | 1,347 | 84.1% | 8.5% | 4.6% | 1.5% | $75k | 19.1% | 18.5% | 27.2% | 89.1% | 11.4% | 5.7% |
| Isabella Fire St | 1,601 | 1,153 | 67.9% | 7.7% | 13.9% | 4.5% | $90k | 35.7% | 21.4% | 28.1% | 80.8% | 22.3% | 0.0% |
| Maplesville Fire St | 1,569 | 1,113 | 68.4% | 0.3% | 27.2% | 0.0% | $68k | 11.2% | 12.4% | 11.3% | 74.4% | 15.2% | 0.3% |
| Mars Hill Fire St | 2,838 | 2,139 | 77.5% | 17.5% | 3.5% | 0.0% | $63k | 9.9% | 23.4% | 16.2% | 72.2% | 11.5% | 11.2% |
| Providence , East Chilton Fire Station | 1,229 | 852 | 94.3% | 1.1% | 0.0% | 0.0% | $65k | 8.9% | 11.5% | 17.3% | 90.7% | 11.5% | 0.0% |
| Providence, North Chilton Fire Station | 5,485 | 3,769 | 48.4% | 41.6% | 4.3% | 0.3% | $52k | 17.4% | 18.5% | 11.6% | 72.4% | 16.7% | 35.3% |
| So. Chilton Fire Station | 2,100 | 1,620 | 77.7% | 2.6% | 18.6% | 0.0% | $57k | 14.4% | 12.8% | 17.5% | 86.7% | 16.4% | 2.5% |
| Thorsby Town Hall | 2,662 | 2,066 | 81.1% | 4.0% | 12.2% | 0.7% | $80k | 18.1% | 19.0% | 15.0% | 84.0% | 7.3% | 2.4% |
| Union Grove Fire Station | 2,685 | 2,063 | 89.0% | 4.2% | 3.0% | 0.0% | $69k | 20.4% | 17.8% | 16.2% | 81.5% | 6.8% | 3.7% |
| Verbena Fire Station | 2,603 | 2,155 | 76.3% | 9.3% | 8.8% | 0.0% | $60k | 10.0% | 13.1% | 15.5% | 95.6% | 16.8% | 8.8% |
Bibb: 8 precincts
| Precinct | Population | Voting-age pop. | % White non-Hisp. | % Hispanic | % Black | % Asian | Median income* | % Bachelor's+ | % 18-29 (of adults) | % 65+ | % Homeowners | % Below poverty | % Spanish at home (adults) |
|---|---|---|---|---|---|---|---|---|---|---|---|---|---|
| Alternative School | 4,047 | 3,095 | 84.2% | 3.1% | 9.7% | 0.2% | $67k | 10.9% | 20.3% | 17.0% | 88.1% | 17.2% | 1.5% |
| Brent City Hall | 2,932 | 2,369 | 35.7% | 1.4% | 60.1% | 0.6% | $29k | 7.7% | 15.0% | 12.0% | 61.9% | 53.7% | 0.5% |
| Brent NG Armory | 2,939 | 2,290 | 56.7% | 1.0% | 39.0% | 0.0% | $35k | 13.8% | 22.7% | 22.5% | 56.6% | 33.0% | 0.4% |
| Centreville Rock Bdg | 2,573 | 2,148 | 78.9% | 1.8% | 14.2% | 2.1% | $48k | 14.2% | 21.4% | 23.1% | 86.3% | 18.3% | 0.7% |
| Eoline FD | 2,479 | 1,971 | 76.1% | 8.9% | 14.0% | 0.3% | $52k | 11.1% | 9.7% | 17.7% | 86.4% | 19.3% | 0.6% |
| Green Pond FD | 4,200 | 3,434 | 85.3% | 3.9% | 5.4% | 0.2% | $69k | 17.7% | 23.2% | 13.9% | 81.4% | 15.4% | 3.8% |
| Lawley Comm Ctr | 1,222 | 1,053 | 86.9% | 3.8% | 7.8% | 0.0% | $57k | 5.2% | 15.3% | 24.7% | 88.5% | 6.9% | 2.9% |
| Six Mile Comm Ctr | 1,820 | 1,397 | 88.2% | 5.0% | 3.2% | 0.2% | $64k | 4.8% | 13.0% | 13.0% | 85.2% | 20.9% | 5.0% |
Coosa: 12 precincts
| Precinct | Population | Voting-age pop. | % White non-Hisp. | % Hispanic | % Black | % Asian | Median income* | % Bachelor's+ | % 18-29 (of adults) | % 65+ | % Homeowners | % Below poverty | % Spanish at home (adults) |
|---|---|---|---|---|---|---|---|---|---|---|---|---|---|
| Community Life Ctr | 260 | 230 | 39.5% | 0.0% | 57.8% | 0.0% | $61k | 11.7% | 13.3% | 12.6% | 87.2% | 13.0% | 0.4% |
| Courthouse | 1,287 | 1,151 | 79.4% | 0.0% | 17.6% | 0.0% | $50k | 20.7% | 17.4% | 32.8% | 85.1% | 8.2% | 0.0% |
| Equality Church | 732 | 712 | 81.9% | 0.0% | 14.6% | 0.0% | $113k | 30.5% | 6.3% | 44.6% | 96.3% | 4.9% | 0.0% |
| Goodwater Comm Ctr | 1,699 | 1,274 | 24.6% | 5.8% | 66.4% | 1.7% | $42k | 14.4% | 8.6% | 34.0% | 68.1% | 24.0% | 2.7% |
| Hanover FD | 452 | 380 | 91.1% | 0.9% | 4.3% | 0.0% | $71k | 6.2% | 23.5% | 20.5% | 89.3% | 7.2% | 0.5% |
| Kellyton Civic | 1,586 | 1,219 | 39.3% | 5.0% | 54.2% | 0.0% | $37k | 11.4% | 18.5% | 14.8% | 61.8% | 21.4% | 2.3% |
| Marble Valley FD | 286 | 227 | 94.4% | 2.7% | 0.0% | 0.0% | $70k | 8.6% | 17.5% | 19.9% | 92.6% | 2.5% | 1.6% |
| Mt Olive Comm Ctr | 338 | 293 | 88.7% | 0.1% | 7.1% | 0.0% | $71k | 5.0% | 26.1% | 21.0% | 87.2% | 10.0% | 0.0% |
| Ray Fire Dept | 836 | 723 | 38.9% | 4.9% | 53.8% | 0.0% | $53k | 12.0% | 14.1% | 12.2% | 85.8% | 13.5% | 2.0% |
| Richville Fire Dept | 372 | 338 | 92.9% | 0.7% | 5.3% | 0.0% | $56k | 19.7% | 6.1% | 40.1% | 92.3% | 6.3% | 0.4% |
| Weogufka | 982 | 776 | 95.7% | 2.0% | 0.1% | 0.0% | $76k | 8.5% | 15.5% | 20.8% | 91.8% | 5.2% | 1.2% |
| West Coosa Sr Ctr | 1,517 | 1,220 | 96.7% | 0.0% | 2.0% | 0.0% | $90k | 8.3% | 13.3% | 22.9% | 88.3% | 12.7% | 0.0% |
Talladega: 1 precincts
| Precinct | Population | Voting-age pop. | % White non-Hisp. | % Hispanic | % Black | % Asian | Median income* | % Bachelor's+ | % 18-29 (of adults) | % 65+ | % Homeowners | % Below poverty | % Spanish at home (adults) |
|---|---|---|---|---|---|---|---|---|---|---|---|---|---|
| Fayetteville/County Line (part) | 2,657 | 2,195 | 68.8% | 14.2% | 11.7% | 2.0% | $69k | 18.9% | 16.6% | 16.6% | 78.7% | 14.1% | 11.3% |
*Median income is approximate (see note above). ACS 2020-2024 5-year.
Nonpartisan voter information. GOTV Polling does not endorse any candidate.