
California's 5th Congressional District
U.S. House · California · District 5 · General election: Tuesday, November 3, 2026
Candidates on the November 3 ballot
- Michael MasudaDemocratic
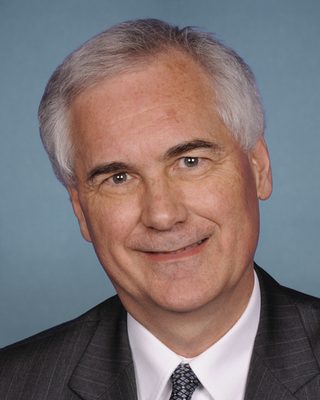 Tom McClintockRepublicanPhoto: U.S. Congress
Source: California Secretary of State, Certified List of Candidates, certified list (2026-08-27; retrieved 2026-10-30). Order of names does not reflect ballot order. Incumbent tags appear only where the official list marks incumbents. Photos come from the Candidate Alerts database where one is on file; otherwise initials are shown.
Federal campaign finance filings for this seat: FEC election page (FEC registration is not the same as ballot qualification).
Certified candidates
- Tom McClintock RepublicanIncumbent @RepMcClintock
- Michael Masuda Democratic
Certified candidate list from Candidate Alerts, as of 2026-08-27, based on California Secretary of State. Includes candidates the database marks as on the November 3 ballot. Incumbent tags here follow the database.
Past election results
Held under the district lines in effect at the time. Those boundaries differ from the 2026 district.
| Candidate | Party | Votes | Share |
|---|---|---|---|
| Tom McClintock | Republican | 227,643 | 61.8% |
| Michael J. "Mike" Barkley | Democratic | 140,919 | 38.2% |
| Total | 368,562 |
Source: Statewide Database (UC Berkeley Law), compilation of county Statements of Vote, SR precinct level. Status: Certified, county Statements of Vote as compiled by the Statewide Database; contest totals verified against the California Secretary of State certified Statement of Vote. Votes from precincts withheld for voter privacy are included as one county-level entry per county (certified county figure minus published precincts), so each county equals its certified figure.
Held under the district lines in effect at the time. Those boundaries differ from the 2026 district.
| Candidate | Party | Votes | Share |
|---|---|---|---|
| Tom McClintock | Republican | 173,524 | 61.3% |
| Michael J. "Mike" Barkley | Democratic | 109,506 | 38.7% |
| Total | 283,030 |
Source: Statewide Database (UC Berkeley Law), compilation of county Statements of Vote, SR precinct level. Status: Certified, county Statements of Vote as compiled by the Statewide Database; contest totals verified against the California Secretary of State certified Statement of Vote
Held under the district lines in effect at the time. Those boundaries differ from the 2026 district.
| Candidate | Party | Votes | Share |
|---|---|---|---|
| Mike Thompson | Democratic | 271,233 | 76.1% |
| Scott Giblin | Republican | 85,227 | 23.9% |
| Total | 356,460 |
Source: Statewide Database (UC Berkeley Law), compilation of county Statements of Vote, SR precinct level. Status: Certified, county Statements of Vote as compiled by the Statewide Database; contest totals verified against the California Secretary of State certified Statement of Vote
Certified results from state or county election authorities, as compiled in the Candidate Alerts precinct results database (public API candidatealerts.com/api/district-results). Totals are sums of certified precinct and county-level rows.
Demographics
2020 Census demographics by district are not yet published in this data set.
37 of 481 precincts are above 50%, and 123 are above 25%. Source: Census American Community Survey 2020-2024 5-year block groups, allocated to current precinct shapes by area.
Poll status
Map
Share of adults (18+) who speak Spanish at home, by precinct. Census ACS 2020-2024 5-year estimates on the current precinct layer. Hover a precinct for its value.
California votes on new congressional district lines in 2026. The Census 119th Congress boundary file does not reflect the new lines, so only the state outline is shown here.
Precinct map: past elections and demographics
Choose a layer above. Hover a precinct for its values.
Precinct results
Certified precinct results on current precinct shapes, grouped by county. 799 precincts. "(part)" marks a precinct only partly inside this district; its full vote is shown, so district sums are approximate and are not the official district total. Elections were held under older lines and are shown on the 2026 district.
| County | 2024 President | 2022 Governor | 2020 President | |||
|---|---|---|---|---|---|---|
| Margin | Votes | Margin | Votes | Margin | Votes | |
| Stanislaus | R+15.9 | 134,904 | R+21.2 | 94,660 | R+7.1 | 147,566 |
| Fresno | R+20.6 | 102,103 | R+30.1 | 72,312 | R+15.6 | 110,213 |
| Madera | R+26.0 | 41,870 | R+33.6 | 30,130 | R+19.4 | 43,770 |
| Tuolumne | R+21.9 | 28,810 | R+27.1 | 23,230 | R+18.8 | 30,401 |
| Calaveras | R+28.1 | 26,479 | R+33.1 | 21,240 | R+23.8 | 27,164 |
| Amador | R+27.8 | 22,402 | R+35.4 | 18,655 | R+24.4 | 22,302 |
| Mariposa | R+21.1 | 9,509 | R+24.9 | 7,840 | R+18.1 | 10,280 |
| San Joaquin | R+46.9 | 7,768 | R+57.9 | 6,528 | R+38.7 | 12,916 |
| Inyo | R+2.9 | 8,938 | R+9.5 | 7,477 | D+0.1 | 9,481 |
| Mono | D+20.3 | 6,064 | D+9.1 | 4,569 | D+22.3 | 6,737 |
| El Dorado | R+22.8 | 1,575 | R+35.0 | 1,954 | R+19.6 | 2,839 |
| Alpine | D+32.0 | 738 | D+17.3 | 619 | D+31.3 | 741 |
| All counties (approx.) | R+20.0 | 391,160 | R+27.1 | 289,214 | R+14.0 | 424,410 |
Stanislaus: 227 precinct results and demographics
Fresno: 117 precinct results and demographics
Madera: 98 precinct results and demographics
Tuolumne: 141 precinct results and demographics
Calaveras: 32 precinct results and demographics
Amador: 48 precinct results and demographics
Mariposa: 29 precinct results and demographics
San Joaquin: 39 precinct results and demographics
Inyo: 40 precinct results and demographics
Mono: 12 precinct results and demographics
El Dorado: 11 precinct results and demographics
Alpine: 5 precinct results and demographics
2024 President (Kamala D. Harris vs. Donald J. Trump). Source: Statewide Database (UC Berkeley Law), compilation of county Statements of Vote, SR precinct level. Certified, county Statements of Vote as compiled by the Statewide Database; contest totals verified against the California Secretary of State certified Statement of Vote.
2022 Governor (Gavin Newsom vs. Brian Dahle). Source: Statewide Database (UC Berkeley Law), compilation of county Statements of Vote, SR precinct level. Certified, county Statements of Vote as compiled by the Statewide Database; contest totals verified against the California Secretary of State certified Statement of Vote.
2020 President (Joseph R. Biden vs. Donald J. Trump). Source: Statewide Database (UC Berkeley Law), compilation of county Statements of Vote, SR precinct level. Certified, county Statements of Vote as compiled by the Statewide Database; contest totals verified against the California Secretary of State certified Statement of Vote.
Precinct demographics
Demographics are Census American Community Survey (ACS) 2020-2024 5-year estimates for block groups, assigned to precincts by area share. They describe the resident population, not registered or likely voters, and include non-citizens. ACS margins of error are not shown; small precincts carry large error. Area weighting assumes people are spread evenly within each block group, so large rural precincts are the least reliable. Median income is a household-weighted average of block-group medians, an approximation.
| Area | Population | Voting-age pop. | % White non-Hisp. | % Hispanic | % Black | % Asian | Median income* | % Bachelor's+ | % 18-29 (of adults) | % 65+ | % Homeowners | % Below poverty | % Spanish at home (adults) |
|---|---|---|---|---|---|---|---|---|---|---|---|---|---|
| District | 781,941 | 603,591 | 53.7% | 31.5% | 2.4% | 5.8% | $98k | 28.9% | 18.0% | 19.3% | 69.8% | 10.5% | 16.6% |
| Stanislaus (in district) | 305,221 | 229,669 | 46.4% | 38.7% | 2.9% | 5.5% | $96k | 24.4% | 20.3% | 15.7% | 65.0% | 11.3% | 22.3% |
| Fresno (in district) | 171,617 | 129,480 | 50.1% | 27.8% | 3.1% | 12.9% | $116k | 44.8% | 19.8% | 17.3% | 66.0% | 6.6% | 11.0% |
| Madera (in district) | 92,727 | 69,894 | 41.6% | 47.0% | 2.4% | 3.0% | $94k | 23.1% | 19.9% | 17.6% | 77.0% | 14.5% | 29.5% |
| Tuolumne (in district) | 54,502 | 45,196 | 78.0% | 13.6% | 1.8% | 1.5% | $83k | 24.6% | 14.2% | 28.1% | 73.9% | 10.4% | 4.6% |
| Calaveras (in district) | 46,212 | 38,386 | 76.4% | 14.5% | 1.0% | 2.2% | $88k | 23.9% | 11.5% | 29.2% | 84.0% | 13.0% | 6.2% |
| Amador (in district) | 41,416 | 35,029 | 72.6% | 16.0% | 1.9% | 1.3% | $89k | 22.4% | 12.2% | 27.6% | 80.4% | 8.2% | 7.1% |
| Inyo (in district) | 18,734 | 14,955 | 58.0% | 24.2% | 0.5% | 1.5% | $73k | 31.5% | 14.5% | 24.9% | 66.4% | 10.9% | 13.5% |
| San Joaquin (in district) | 17,924 | 13,156 | 65.9% | 27.4% | 0.6% | 1.7% | $104k | 20.2% | 13.4% | 20.2% | 72.5% | 11.4% | 16.2% |
| Mariposa (in district) | 17,079 | 14,139 | 74.0% | 14.7% | 0.9% | 1.9% | $78k | 31.8% | 11.2% | 29.7% | 74.7% | 14.0% | 8.4% |
| Mono (in district) | 13,151 | 10,821 | 64.9% | 27.1% | 0.1% | 1.8% | $107k | 32.1% | 11.6% | 17.5% | 65.4% | 8.6% | 16.7% |
| El Dorado (in district) | 1,740 | 1,569 | 70.9% | 18.7% | 0.1% | 2.3% | $83k | 30.2% | 18.7% | 34.2% | 86.2% | 15.8% | 8.8% |
| Alpine (in district) | 1,617 | 1,296 | 57.1% | 13.4% | 0.0% | 2.2% | $106k | 41.1% | 26.5% | 21.1% | 78.2% | 10.0% | 8.8% |
Precinct-level demographics (462 precincts) are on the county pages linked above.
*Median income is approximate (see note above). ACS 2020-2024 5-year.
Nonpartisan voter information. GOTV Polling does not endorse any candidate.