
Colorado's 4th Congressional District
U.S. House · Colorado · District 4 · General election: Tuesday, November 3, 2026
Candidates on the November 3 ballot
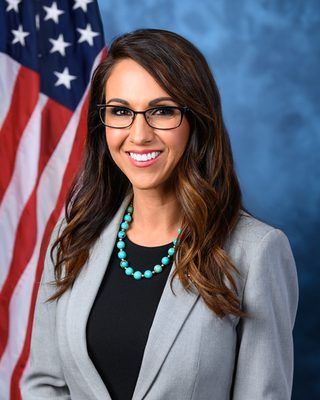 Lauren BoebertRepublicanPhoto: U.S. Congress
- Eileen LaubacherDemocratic
- Douglas MangerisLibertarian
- Luis GalvanRepublicanWrite-in
Source: Colorado Secretary of State, 2026 General Election Official Candidate List (certified to counties 2026-09-04), certified list (2026-09-04; retrieved 2026-10-30). Write-in candidates are listed because the Secretary of State lists them as qualified write-in candidates. Order of names does not reflect ballot order. Incumbent tags appear only where the official list marks incumbents. Photos come from the Candidate Alerts database where one is on file; otherwise initials are shown.
Federal campaign finance filings for this seat: FEC election page (FEC registration is not the same as ballot qualification).
Certified candidates
- Lauren Boebert RepublicanIncumbent @RepBoebert Website
- Eileen Laubacher Democratic Website
- Douglas Mangeris Libertarian
Certified candidate list from Candidate Alerts, as of 2026-09-24, based on Colorado Secretary of State. Includes candidates the database marks as on the November 3 ballot. Incumbent tags here follow the database.
Past election results
| Candidate | Party | Votes | Share |
|---|---|---|---|
| Lauren Boebert | Republican | 240,213 | 53.6% |
| Trisha Calvarese | Democratic | 188,249 | 42.0% |
| Hannah Goodman | Libertarian | 11,676 | 2.6% |
| Frank Atwood | App | 6,233 | 1.4% |
| Paul Noel Fiorino | Uni | 1,436 | 0.3% |
| Total | 447,807 |
Source: Colorado Secretary of State, Historical Election Database (historicalelectiondata.coloradosos.gov). Status: Certified, Colorado Secretary of State historical election database (precinct detail as certified by county canvass boards; totals per the official Abstract of Votes Cast)
| Candidate | Party | Votes | Share |
|---|---|---|---|
| Ken Buck | Republican | 216,024 | 60.9% |
| Ike McCorkle | Democratic | 129,619 | 36.6% |
| Ryan McGonigal | Ame | 8,870 | 2.5% |
| Total | 354,513 |
Source: Colorado Secretary of State, Historical Election Database (historicalelectiondata.coloradosos.gov). Status: Certified, Colorado Secretary of State historical election database (precinct detail as certified by county canvass boards; totals per the official Abstract of Votes Cast)
Held under the district lines in effect at the time. Those boundaries differ from the 2026 district.
| Candidate | Party | Votes | Share |
|---|---|---|---|
| Ken Buck | Republican | 285,606 | 60.1% |
| Ike McCorkle | Democratic | 173,945 | 36.6% |
| Bruce Griffith | Libertarian | 11,026 | 2.3% |
| Laura Ireland | Uni | 4,530 | 1.0% |
| Total | 475,107 |
Source: Colorado Secretary of State, Historical Election Database (historicalelectiondata.coloradosos.gov). Status: Certified, Colorado Secretary of State historical election database (precinct detail as certified by county canvass boards; totals per the official Abstract of Votes Cast)
Certified results from state or county election authorities, as compiled in the Candidate Alerts precinct results database (public API candidatealerts.com/api/district-results). Totals are sums of certified precinct and county-level rows.
Demographics
2020 Census demographics by district are not yet published in this data set.
2 of 504 precincts are above 50%, and 17 are above 25%. Source: Census American Community Survey 2020-2024 5-year block groups, allocated to current precinct shapes by area.
Poll status
Map
Share of adults (18+) who speak Spanish at home, by precinct. Census ACS 2020-2024 5-year estimates on the current precinct layer. Hover a precinct for its value.
District shown in red: U.S. Census Bureau cartographic boundary file for the 119th Congress (cb_2024_us_cd119_500k). These are the lines in effect for 2026 in this state per the Candidate Alerts district registry.
Precinct map: past elections and demographics
Choose a layer above. Hover a precinct for its values.
Precinct results
Certified precinct results on current precinct shapes, grouped by county. 911 precincts. "(part)" marks a precinct only partly inside this district; its full vote is shown, so district sums are approximate and are not the official district total. Elections were held under older lines and are shown on the 2026 district.
| County | 2024 President | 2022 Governor | 2020 President | |||
|---|---|---|---|---|---|---|
| Margin | Votes | Margin | Votes | Margin | Votes | |
| Douglas | R+7.2 | 240,329 | R+0.8 | 187,905 | R+5.2 | 193,025 |
| Larimer | R+2.4 | 70,010 | D+2.4 | 54,269 | R+7.4 | 74,579 |
| Weld | R+37.4 | 43,011 | R+33.2 | 31,669 | R+38.3 | 36,178 |
| Arapahoe | R+3.2 | 21,644 | D+4.1 | 15,226 | D+1.8 | 23,014 |
| Elbert | R+49.5 | 17,412 | R+44.3 | 13,855 | R+50.3 | 18,953 |
| Morgan | R+47.0 | 12,306 | R+42.0 | 9,305 | R+40.2 | 12,802 |
| Logan | R+56.6 | 10,166 | R+49.2 | 8,256 | R+55.8 | 10,514 |
| Adams | R+48.9 | 7,626 | R+46.4 | 5,606 | R+48.9 | 7,189 |
| Prowers | R+50.7 | 5,145 | R+39.9 | 4,286 | R+46.0 | 5,548 |
| El Paso | R+64.3 | 5,124 | R+55.1 | 4,025 | R+63.3 | 5,063 |
| Yuma | R+65.4 | 4,663 | R+61.1 | 3,964 | R+66.8 | 4,973 |
| Kit Carson | R+68.3 | 3,698 | R+65.8 | 3,026 | R+64.3 | 3,860 |
| Washington | R+75.1 | 2,806 | R+69.4 | 2,389 | R+74.1 | 3,004 |
| Lincoln | R+64.5 | 2,571 | R+58.0 | 2,100 | R+63.0 | 2,644 |
| Phillips | R+62.7 | 2,355 | R+57.6 | 1,969 | R+59.3 | 2,482 |
| Bent | R+38.9 | 2,189 | R+25.4 | 1,830 | R+34.0 | 2,269 |
| Baca | R+70.4 | 2,004 | R+46.1 | 1,747 | R+69.7 | 2,223 |
| Crowley | R+47.4 | 1,706 | R+33.1 | 1,378 | R+47.7 | 1,747 |
| Sedgwick | R+56.3 | 1,358 | R+42.6 | 1,162 | R+57.0 | 1,439 |
| Cheyenne | R+77.9 | 1,055 | R+70.3 | 915 | R+76.1 | 1,133 |
| Kiowa | R+74.4 | 863 | R+61.0 | 759 | R+77.2 | 903 |
| All counties (approx.) | R+17.8 | 458,041 | R+12.0 | 355,641 | R+18.3 | 413,542 |
Douglas: 338 precinct results and demographics
Larimer: 118 precinct results and demographics
Weld: 75 precinct results and demographics
Arapahoe: 48 precinct results and demographics
Elbert: 30 precinct results and demographics
Morgan: 34 precinct results and demographics
Logan: 32 precinct results and demographics
Adams: 21 precinct results and demographics
Prowers: 26 precinct results and demographics
El Paso: 13 precinct results and demographics
Yuma: 28 precinct results and demographics
Kit Carson: 26 precinct results and demographics
Washington: 12 precinct results and demographics
Lincoln: 26 precinct results and demographics
Phillips: 16 precinct results and demographics
Bent: 10 precinct results and demographics
Baca: 18 precinct results and demographics
Crowley: 12 precinct results and demographics
Sedgwick: 10 precinct results and demographics
Cheyenne: 10 precinct results and demographics
Kiowa: 8 precinct results and demographics
2024 President (Kamala D. Harris and Tim Walz vs. Donald J. Trump and JD Vance). Source: Colorado Secretary of State, Historical Election Database (historicalelectiondata.coloradosos.gov). Certified, Colorado Secretary of State historical election database (precinct detail as certified by county canvass boards; totals per the official Abstract of Votes Cast).
2022 Governor (Jared Polis and Dianne Primavera vs. Heidi Ganahl and Danny Moore). Source: Colorado Secretary of State, Historical Election Database (historicalelectiondata.coloradosos.gov). Certified, Colorado Secretary of State historical election database (precinct detail as certified by county canvass boards; totals per the official Abstract of Votes Cast).
2020 President (Joseph R. Biden and Kamala D. Harris vs. Donald J. Trump and Michael R. Pence). Source: Colorado Secretary of State, Historical Election Database (historicalelectiondata.coloradosos.gov). Certified, Colorado Secretary of State historical election database (precinct detail as certified by county canvass boards; totals per the official Abstract of Votes Cast).
Precinct demographics
Demographics are Census American Community Survey (ACS) 2020-2024 5-year estimates for block groups, assigned to precincts by area share. They describe the resident population, not registered or likely voters, and include non-citizens. ACS margins of error are not shown; small precincts carry large error. Area weighting assumes people are spread evenly within each block group, so large rural precincts are the least reliable. Median income is a household-weighted average of block-group medians, an approximation.
| Area | Population | Voting-age pop. | % White non-Hisp. | % Hispanic | % Black | % Asian | Median income* | % Bachelor's+ | % 18-29 (of adults) | % 65+ | % Homeowners | % Below poverty | % Spanish at home (adults) |
|---|---|---|---|---|---|---|---|---|---|---|---|---|---|
| District | 744,793 | 570,503 | 74.2% | 15.0% | 1.8% | 3.7% | $125k | 48.0% | 17.7% | 15.2% | 76.2% | 6.8% | 6.6% |
| Douglas (in district) | 364,987 | 279,138 | 77.1% | 10.1% | 1.3% | 5.7% | $155k | 62.0% | 17.5% | 13.8% | 77.3% | 3.7% | 4.1% |
| Larimer (in district) | 108,054 | 85,281 | 79.0% | 15.0% | 0.9% | 1.3% | $97k | 43.7% | 18.8% | 19.6% | 67.2% | 8.1% | 5.6% |
| Weld (in district) | 64,901 | 48,208 | 76.5% | 17.7% | 0.8% | 0.7% | $111k | 39.2% | 16.5% | 13.7% | 83.9% | 8.5% | 8.7% |
| Arapahoe (in district) | 45,168 | 32,555 | 54.4% | 19.8% | 9.6% | 7.9% | $137k | 45.4% | 17.2% | 8.9% | 86.5% | 5.9% | 9.6% |
| Morgan (in district) | 29,234 | 21,922 | 54.6% | 38.6% | 1.9% | 0.7% | $77k | 17.9% | 20.3% | 16.1% | 67.7% | 14.2% | 20.3% |
| Elbert (in district) | 27,838 | 21,926 | 82.8% | 9.2% | 0.7% | 0.7% | $135k | 36.1% | 13.8% | 18.8% | 95.0% | 5.3% | 4.2% |
| Logan (in district) | 20,527 | 16,864 | 75.9% | 16.7% | 3.7% | 0.6% | $64k | 20.1% | 21.9% | 19.2% | 66.1% | 15.9% | 7.4% |
| Adams (in district) | 12,216 | 8,826 | 65.7% | 25.2% | 1.6% | 0.7% | $115k | 23.1% | 20.9% | 10.4% | 88.1% | 7.1% | 9.9% |
| Prowers (in district) | 12,121 | 8,978 | 54.8% | 40.6% | 1.1% | 0.3% | $55k | 19.1% | 21.2% | 18.7% | 67.4% | 18.2% | 19.2% |
| Yuma (in district) | 10,079 | 7,271 | 66.4% | 30.7% | 0.2% | 0.0% | $66k | 25.2% | 18.1% | 18.4% | 68.6% | 18.2% | 23.6% |
| El Paso (in district) | 7,967 | 6,378 | 83.6% | 9.5% | 1.5% | 0.5% | $83k | 27.5% | 12.5% | 18.4% | 85.6% | 6.8% | 4.8% |
| Kit Carson (in district) | 6,888 | 5,095 | 75.0% | 20.1% | 0.1% | 0.2% | $70k | 20.4% | 16.0% | 19.9% | 72.8% | 9.8% | 12.8% |
| Crowley (in district) | 5,651 | 4,915 | 55.8% | 28.9% | 6.6% | 0.8% | $50k | 12.5% | 21.2% | 15.5% | 69.5% | 19.4% | 9.9% |
| Bent (in district) | 5,553 | 4,660 | 53.7% | 32.5% | 3.2% | 0.9% | $51k | 15.7% | 18.4% | 18.9% | 65.1% | 28.3% | 7.9% |
| Lincoln (in district) | 5,508 | 4,550 | 74.0% | 15.3% | 5.5% | 0.1% | $58k | 26.0% | 17.0% | 18.3% | 71.8% | 9.9% | 8.8% |
| Washington (in district) | 4,851 | 3,774 | 83.3% | 11.8% | 1.1% | 0.6% | $69k | 24.9% | 15.9% | 22.5% | 73.7% | 8.1% | 5.2% |
| Phillips (in district) | 4,457 | 3,317 | 69.5% | 28.8% | 0.0% | 0.1% | $80k | 31.5% | 12.9% | 20.5% | 71.8% | 16.9% | 21.1% |
| Baca (in district) | 3,425 | 2,658 | 82.8% | 10.9% | 0.4% | 2.6% | $45k | 24.7% | 13.3% | 25.8% | 71.5% | 24.6% | 2.3% |
| Sedgwick (in district) | 2,251 | 1,754 | 72.6% | 19.5% | 0.9% | 1.8% | $53k | 27.3% | 14.5% | 24.2% | 72.0% | 13.0% | 7.2% |
| Cheyenne (in district) | 1,740 | 1,355 | 78.3% | 10.8% | 1.8% | 0.0% | $68k | 26.1% | 12.4% | 19.7% | 72.6% | 8.2% | 7.1% |
| Kiowa (in district) | 1,376 | 1,078 | 83.1% | 12.9% | 0.0% | 1.5% | $58k | 20.1% | 15.2% | 22.0% | 68.7% | 11.8% | 5.1% |
Precinct-level demographics (504 precincts) are on the county pages linked above.
*Median income is approximate (see note above). ACS 2020-2024 5-year.
Nonpartisan voter information. GOTV Polling does not endorse any candidate.