
Florida's 9th Congressional District
U.S. House · Florida · District 9 · General election: Tuesday, November 3, 2026
Candidates on the November 3 ballot
- Dan GreenRepublican
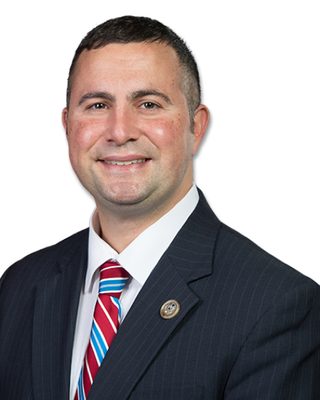 Darren SotoDemocraticIncumbentPhoto: U.S. Congress
Source: Florida Department of State, Division of Elections, candidate listing (status: Qualified), certified list (qualifying closed 2026-06-12; primary 2026-08-18; retrieved 2026-10-30). Write-in candidates appear because the Division lists them as qualified write-in candidates. Order of names does not reflect ballot order. Incumbent tags appear only where the official list marks incumbents. Photos come from the Candidate Alerts database where one is on file; otherwise initials are shown.
Federal campaign finance filings for this seat: FEC election page (FEC registration is not the same as ballot qualification).
Certified candidates
- Darren Soto DemocraticIncumbent @RepDarrenSoto
- Dan Green Republican
Certified candidate list from Candidate Alerts, as of 2026-09-24, based on Florida Division of Elections. Includes candidates the database marks as on the November 3 ballot. Incumbent tags here follow the database.
Past election results
Held under the district lines in effect at the time. Those boundaries differ from the 2026 district.
| Candidate | Party | Votes | Share |
|---|---|---|---|
| Darren Soto | Democratic | 178,785 | 55.1% |
| Thomas Chalifoux | Republican | 138,076 | 42.6% |
| Marcus Carter | NPA | 7,412 | 2.3% |
| Total | 324,273 |
Source: Florida Department of State, Division of Elections, Precinct-Level Election Results. Status: Official results (Florida Division of Elections precinct-level file, compiled from county SOE submissions)
Held under the district lines in effect at the time. Those boundaries differ from the 2026 district.
| Candidate | Party | Votes | Share |
|---|---|---|---|
| Darren Soto | Democratic | 108,541 | 53.6% |
| Scotty Moore | Republican | 93,827 | 46.4% |
| Total | 202,368 |
Source: Florida Department of State, Division of Elections, Precinct-Level Election Results. Status: Official results (Florida Division of Elections precinct-level file, compiled from county SOE submissions)
Held under the district lines in effect at the time. Those boundaries differ from the 2026 district.
| Candidate | Party | Votes | Share |
|---|---|---|---|
| Darren Soto | Democratic | 240,724 | 56.0% |
| William P. "Bill" Olson | Republican | 188,889 | 43.9% |
| Write-in | 415 | 0.1% | |
| Total | 430,028 |
Source: Florida Department of State, Division of Elections, Precinct-Level Election Results. Status: Official results (Florida Division of Elections precinct-level file, compiled from county SOE submissions)
Certified results from state or county election authorities, as compiled in the Candidate Alerts precinct results database (public API candidatealerts.com/api/district-results). Totals are sums of certified precinct and county-level rows.
Demographics
2020 Census demographics by district are not yet published in this data set.
46 of 228 precincts are above 50%, and 143 are above 25%. Source: Census American Community Survey 2020-2024 5-year block groups, allocated to current precinct shapes by area.
Poll status
Map
Share of adults (18+) who speak Spanish at home, by precinct. Census ACS 2020-2024 5-year estimates on the current precinct layer. Hover a precinct for its value.
Florida votes on new congressional district lines in 2026. The Census 119th Congress boundary file does not reflect the new lines, so only the state outline is shown here.
Precinct map: past elections and demographics
Choose a layer above. Hover a precinct for its values.
Precinct results
Certified precinct results on current precinct shapes, grouped by county. 333 precincts. "(part)" marks a precinct only partly inside this district; its full vote is shown, so district sums are approximate and are not the official district total. Elections were held under older lines and are shown on the 2026 district.
| County | 2024 President | 2022 Governor | 2020 President | |||
|---|---|---|---|---|---|---|
| Margin | Votes | Margin | Votes | Margin | Votes | |
| Osceola | R+4.9 | 142,237 | R+8.8 | 88,597 | D+10.8 | 140,976 |
| Indian River | R+27.2 | 99,493 | R+35.6 | 77,400 | R+21.5 | 97,702 |
| Orange | D+5.6 | 61,818 | D+0.1 | 37,492 | D+19.4 | 62,207 |
| Highlands | R+40.7 | 52,031 | R+49.0 | 39,825 | R+34.3 | 52,215 |
| Polk | R+46.1 | 7,789 | R+51.1 | 5,794 | R+41.5 | 7,601 |
| Okeechobee | - | - | - | - | R+44.3 | 15,976 |
| Glades | R+53.1 | 5,300 | R+61.9 | 3,829 | R+46.1 | 5,203 |
| All counties (approx.) | R+15.8 | 368,668 | R+23.8 | 252,937 | R+6.4 | 381,880 |
Osceola: 195 precincts
| Precinct | 2024 President | 2022 Governor | 2020 President | |||
|---|---|---|---|---|---|---|
| Margin | Votes | Margin | Votes | Margin | Votes | |
| - CELEBRATION HERITAGE HA | - | - | D+36.4 | 264 | - | - |
| - FIRE STATION 73 - REUNI (part) | - | - | R+8.4 | 571 | - | - |
| - GYM & AQUATIC CENTER (part) | - | - | D+26.4 | 3,980 | - | - |
| 102 - TAX COLLECTOR (CAMPBELL (part) | - | - | - | - | R+20.9 | 316 |
| 104 - FIRE STATION 42 - POINCI | - | - | - | - | D+32.8 | 3,166 |
| 105 - TAX COLLECTOR (CAMPBELL | - | - | - | - | D+7.2 | 2,503 |
| 106 - TAX COLLECTOR (CAMPBELL | - | - | - | - | D+3.8 | 848 |
| 107 - OSCEOLA COUNTY WELCOME C | - | - | - | - | D+26.0 | 2,836 |
| 109 - THE FATHER'S HOUSE | - | - | - | - | D+19.8 | 278 |
| 110 - OSCEOLA COUNTY WELCOME C | - | - | - | - | D+36.3 | 2,081 |
| 111 - FIRE STATION 42 - POINCI | - | - | - | - | D+35.1 | 1,434 |
| 112 - YMCA | - | - | - | - | D+24.2 | 3,067 |
| 113 - THE FATHER'S HOUSE | - | - | - | - | D+26.5 | 3,534 |
| 132 - FIRE STATION 42 - POINCI | - | - | - | - | D+27.0 | 564 |
| 134 - FIRE STATION 42 - POINCI | - | - | - | - | - | 0 |
| 138 - TAX COLLECTOR (CAMPBELL | - | - | - | - | D+66.7 | 12 |
| 153 - CELEBRATION HERITAGE HAL | - | - | - | - | - | 0 |
| 158 - OSCEOLA COUNTY WELCOME C | - | - | - | - | D+34.8 | 917 |
| 160 - THE FATHER'S HOUSE | - | - | - | - | D+33.6 | 891 |
| 200 - ROBERT GUEVARA COMMUNITY | - | - | - | - | D+39.4 | 7,115 |
| 201 - OSCEOLA HERITAGE PARK | - | - | - | - | D+15.0 | 3,208 |
| 202 - OSCEOLA HERITAGE PARK | - | - | - | - | R+50.0 | 94 |
| 203 - LIONS CLUB | - | - | - | - | D+30.0 | 1,129 |
| 204 - BVL LIBRARY | - | - | - | - | D+37.1 | 5,759 |
| 210 - CYPRESS ELEMENTARY SCHOO | - | - | - | - | D+34.7 | 3,792 |
| 211 - FIRST CHURCH OF THE NAZA | - | - | - | - | D+18.4 | 4,065 |
| 212 - LIONS CLUB | - | - | - | - | D+35.2 | 261 |
| 250 - OSCEOLA HERITAGE PARK | - | - | - | - | D+37.3 | 663 |
| 251 - OSCEOLA HERITAGE PARK | - | - | - | - | D+22.6 | 2,508 |
| 300 - PLEASANT HILL ELEMENTARY | - | - | - | - | D+30.6 | 2,843 |
| 301 - POINCIANA CHRISTIAN CHUR | - | - | - | - | D+14.0 | 641 |
| 302 - LIVING WATER FELLOWSHIP (part) | - | - | - | - | D+22.5 | 3,351 |
| 307 - BROADMOOR CLUBHOUSE | - | - | - | - | D+24.9 | 2,972 |
| 308 - PLEASANT HILL ELEMENTARY | - | - | - | - | D+12.4 | 764 |
| 309 - POINCIANA CHRISTIAN CHUR | - | - | - | - | D+3.5 | 602 |
| 331 - REEDY CREEK ELEMENTARY S | - | - | - | - | D+32.7 | 1,165 |
| 350 - THE VINE CHURCH | - | - | - | - | D+21.7 | 494 |
| 351 - POINCIANA CHRISTIAN CHUR | - | - | - | - | D+49.9 | 1,195 |
| 352 - POINCIANA CHRISTIAN CHUR | - | - | - | - | D+39.5 | 722 |
| 353 - TAX COLLECTOR (CAMPBELL | - | - | - | - | D+28.6 | 42 |
| 360 - THE VINE CHURCH | - | - | - | - | D+39.4 | 1,410 |
| 390 - THE VINE CHURCH | - | - | - | - | R+35.1 | 77 |
| 391 - REEDY CREEK ELEMENTARY S (part) | - | - | - | - | D+38.4 | 1,966 |
| 400 - 17TH STREET CIVIC CENTER | - | - | - | - | R+56.7 | 714 |
| 401 - KNIGHTS OF COLUMBUS | - | - | - | - | R+12.1 | 663 |
| 402 - OSCEOLA HERITAGE PARK | - | - | - | - | R+14.0 | 677 |
| 403 - KNIGHTS OF COLUMBUS | - | - | - | - | D+29.3 | 3,004 |
| 405 - ST. JOHN'S EPISCOPAL CHU | - | - | - | - | D+17.4 | 425 |
| 406 - MARYDIA COMMUNITY CENTER | - | - | - | - | D+21.7 | 1,844 |
| 407 - ELKS LODGE KISSIMMEE | - | - | - | - | R+24.4 | 1,780 |
| 408 - ELKS LODGE KISSIMMEE | - | - | - | - | R+18.3 | 470 |
| 410 - KISSIMMEE CIVIC CENTER | - | - | - | - | D+18.1 | 2,943 |
| 411 - ST. JOHN'S EPISCOPAL CHU | - | - | - | - | D+31.6 | 3,334 |
| 412 - ST. LUKE MISSIONARY BAPT | - | - | - | - | D+39.6 | 1,183 |
| 420 - 17TH STREET CIVIC CENTER | - | - | - | - | R+6.5 | 7,749 |
| 450 - KNIGHTS OF COLUMBUS | - | - | - | - | D+26.0 | 1,062 |
| 451 - KNIGHTS OF COLUMBUS | - | - | - | - | R+2.6 | 114 |
| 470 - 17TH STREET CIVIC CENTER | - | - | - | - | D+21.6 | 991 |
| 471 - 17TH STREET CIVIC CENTER | - | - | - | - | D+0.9 | 907 |
| 500 - KENANSVILLE COMMUNITY CE | - | - | - | - | R+65.2 | 603 |
| 501 - HOLOPAW COMMUNITY CENTER | - | - | - | - | R+57.8 | 927 |
| 502 - FIRE STATION 52 - PINE G | - | - | - | - | R+49.1 | 3,676 |
| 503 - AUSTIN TINDALL REGIONAL | - | - | - | - | D+13.5 | 4,392 |
| 504 - NARCOOSSEE MIDDLE SCHOOL | - | - | - | - | R+9.0 | 5,614 |
| 505 - ST. CLOUD BRANCH LIBRARY | - | - | - | - | R+36.8 | 1,458 |
| 506 - FIRE STATION 53 - DEER R | - | - | - | - | R+57.7 | 3,227 |
| 507 - CORNERSTONE BAPTIST CHUR | - | - | - | - | R+34.5 | 55 |
| 508 - NARCOOSSEE COMMUNITY CEN | - | - | - | - | R+21.4 | 2,576 |
| 520 - ST. CLOUD COMMUNITY HOUS | - | - | - | - | R+12.0 | 6,252 |
| 521 - CORNERSTONE BAPTIST CHUR | - | - | - | - | R+5.9 | 6,051 |
| 522 - CANOE CREEK CHARTER SCHO | - | - | - | - | D+8.4 | 4,638 |
| 523 - ST. CLOUD BRANCH LIBRARY | - | - | - | - | R+15.3 | 983 |
| 550 - HOLOPAW COMMUNITY CENTER | - | - | - | - | R+19.0 | 1,791 |
| 551 - HOLOPAW COMMUNITY CENTER | - | - | - | - | R+26.7 | 60 |
| 552 - FIRE STATION 53 - DEER R | - | - | - | - | D+9.9 | 151 |
| 553 - ST. CLOUD COMMUNITY HOUS | - | - | - | - | R+13.3 | 607 |
| 570 - FIRE STATION 53 - DEER R | - | - | - | - | D+25.3 | 685 |
| 571 - CANOE CREEK CHARTER SCHO | - | - | - | - | D+5.7 | 53 |
| 580 - FIRE STATION 52 - PINE G | - | - | - | - | D+0.0 | 32 |
| BROADMOOR CLUBHOUSE | D+6.3 | 2,686 | D+2.7 | 1,435 | - | - |
| BROADMOOR CLUBHOUSE | - | 0 | - | - | - | - |
| BVL LIBRARY | D+17.1 | 4,902 | D+19.0 | 2,827 | - | - |
| CANOE CREEK CHRISTIAN CHURCH | - | 0 | - | - | - | - |
| CANOE CREEK CHRISTIAN CHURCH | R+12.8 | 1,365 | R+17.1 | 741 | - | - |
| CANOE CREEK CHRISTIAN CHURCH | - | 0 | - | - | - | - |
| CANOE CREEK CHRISTIAN CHURCH | R+2.7 | 998 | R+4.9 | 471 | - | - |
| CANOE CREEK SCHOOL | R+10.2 | 2,288 | R+15.6 | 1,363 | - | - |
| CANOE CREEK SCHOOL | R+26.7 | 60 | R+18.5 | 27 | - | - |
| CANOE CREEK SCHOOL | R+3.8 | 2,072 | R+10.2 | 1,160 | - | - |
| CELEBRATION HERITAGE HALL | - | 0 | - | - | - | - |
| CORNERSTONE FAMILY CHURCH | R+54.3 | 46 | R+41.9 | 31 | - | - |
| CORNERSTONE FAMILY CHURCH | - | 0 | - | - | - | - |
| CORNERSTONE FAMILY CHURCH | R+21.4 | 28 | R+44.0 | 25 | - | - |
| CORNERSTONE FAMILY CHURCH | R+17.2 | 4,958 | R+25.8 | 2,998 | - | - |
| ELKS LODGE KISSIMMEE | R+24.4 | 2,496 | R+35.0 | 1,701 | - | - |
| FIRE STATION 42 - POINCIANA BLVD | D+7.6 | 1,474 | D+2.4 | 858 | - | - |
| FIRE STATION 42 - POINCIANA BLVD | - | 0 | - | - | - | - |
| FIRE STATION 42 - POINCIANA BLVD | D+10.0 | 472 | D+1.1 | 268 | - | - |
| FIRE STATION 45 - CALYPSO CAY | D+7.7 | 2,768 | D+9.9 | 1,363 | - | - |
| FIRE STATION 45 - CALYPSO CAY | D+16.6 | 687 | D+16.8 | 387 | - | - |
| FIRE STATION 52 - PINE GROVE | R+52.4 | 2,126 | R+60.9 | 1,520 | - | - |
| FIRE STATION 52 - PINE GROVE | - | 0 | - | - | - | - |
| FIRE STATION 53 - DEER RUN | R+55.4 | 3,425 | R+66.3 | 2,388 | - | - |
| FIRE STATION 53 - DEER RUN | R+17.3 | 701 | R+18.7 | 251 | - | - |
| FIRE STATION 53 - DEER RUN | R+15.1 | 166 | - | - | - | - |
| FIRE STATION 53 - DEER RUN | R+100.0 | 1 | - | - | - | - |
| FIRE STATION 54 - HARMONY | R+43.5 | 1,903 | R+55.6 | 1,287 | - | - |
| FIRE STATION 54 - HARMONY | R+16.4 | 737 | R+35.7 | 227 | - | - |
| FIRE STATION 54 - HARMONY | R+24.7 | 2,031 | R+30.6 | 1,310 | - | - |
| FIRE STATION 67 - AUSTIN TINDALL | R+4.1 | 5,032 | R+9.2 | 2,963 | - | - |
| FIRST CHURCH OF THE NAZARENE | D+0.3 | 1,726 | R+4.2 | 1,092 | - | - |
| FIRST CHURCH OF THE NAZARENE | R+1.8 | 1,860 | D+0.5 | 1,176 | - | - |
| GREENEWAY CHURCH | D+6.3 | 2,309 | D+8.4 | 1,467 | - | - |
| GREENEWAY CHURCH | D+10.3 | 1,282 | D+11.8 | 727 | - | - |
| HEARTCRY CHAPEL | R+40.7 | 550 | R+44.8 | 435 | - | - |
| HEARTCRY CHAPEL | R+48.3 | 743 | R+47.5 | 739 | - | - |
| HEARTCRY CHAPEL | R+51.6 | 122 | R+64.5 | 76 | - | - |
| HEARTCRY CHAPEL | R+7.6 | 157 | - | - | - | - |
| HEARTCRY CHAPEL | R+6.5 | 1,255 | - | - | - | - |
| HEARTCRY CHAPEL | R+9.5 | 1,257 | R+21.7 | 852 | - | - |
| HEARTCRY CHAPEL | D+77.8 | 9 | - | - | - | - |
| HEARTCRY CHAPEL | - | 0 | - | - | - | - |
| HOLOPAW COMMUNITY CENTER | R+62.6 | 1,084 | R+69.8 | 640 | - | - |
| INTERCESSION CITY CIVIC CENTER (part) | R+19.8 | 602 | R+30.7 | 300 | - | - |
| KENANSVILLE COMMUNITY CENTER | R+64.1 | 629 | R+72.2 | 478 | - | - |
| KINDRED HERITAGE PARK | R+17.2 | 577 | R+29.0 | 397 | - | - |
| KINDRED HERITAGE PARK | D+0.5 | 1,152 | R+6.0 | 583 | - | - |
| KINDRED HERITAGE PARK | D+0.4 | 549 | R+10.2 | 147 | - | - |
| KINDRED HERITAGE PARK | D+1.3 | 1,070 | R+3.8 | 287 | - | - |
| KISSIMMEE CIVIC CENTER | R+3.0 | 268 | R+11.7 | 137 | - | - |
| KISSIMMEE CIVIC CENTER | R+17.1 | 263 | R+24.5 | 192 | - | - |
| KISSIMMEE CIVIC CENTER | D+10.5 | 636 | D+4.2 | 383 | - | - |
| KNIGHTS OF COLUMBUS | R+0.4 | 3,532 | R+2.4 | 1,768 | - | - |
| LIONS CLUB | R+10.9 | 423 | R+3.9 | 206 | - | - |
| LIONS CLUB | D+5.2 | 210 | D+22.0 | 123 | - | - |
| LIVING WATER FELLOWSHIP (part) | D+13.4 | 4,881 | D+11.5 | 3,034 | - | - |
| MARK DURBIN COMMUNITY PARK | D+12.5 | 3,110 | D+20.0 | 1,739 | - | - |
| MARK DURBIN COMMUNITY PARK | R+100.0 | 3 | - | - | - | - |
| MARYDIA COMMUNITY CENTER | R+0.9 | 1,391 | D+1.0 | 825 | - | - |
| MARYDIA COMMUNITY CENTER | D+14.5 | 763 | D+4.2 | 455 | - | - |
| NARCOOSSEE COMMUNITY CENTER | R+38.8 | 1,047 | R+51.8 | 794 | - | - |
| NARCOOSSEE COMMUNITY CENTER | R+9.9 | 3,254 | R+20.9 | 1,323 | - | - |
| NARCOOSSEE COMMUNITY CENTER | D+0.1 | 1,213 | R+32.0 | 466 | - | - |
| NARCOOSSEE COMMUNITY CENTER | D+4.3 | 47 | - | - | - | - |
| NARCOOSSEE COMMUNITY CENTER | R+21.4 | 28 | - | - | - | - |
| NARCOOSSEE MIDDLE SCHOOL | R+15.6 | 5,349 | R+26.0 | 3,411 | - | - |
| NARCOOSSEE MIDDLE SCHOOL | R+9.2 | 207 | D+8.5 | 47 | - | - |
| OSCEOLA COUNTY ROAD & BRIDGE | R+58.9 | 582 | R+62.9 | 407 | - | - |
| OSCEOLA COUNTY ROAD & BRIDGE | R+19.0 | 42 | R+37.9 | 29 | - | - |
| OSCEOLA COUNTY ROAD & BRIDGE | R+3.5 | 231 | R+100.0 | 2 | - | - |
| OSCEOLA COUNTY ROAD & BRIDGE | D+100.0 | 1 | - | - | - | - |
| OSCEOLA COUNTY ROAD & BRIDGE | R+100.0 | 3 | - | - | - | - |
| OSCEOLA COUNTY ROAD & BRIDGE | - | 0 | - | - | - | - |
| OSCEOLA COUNTY ROAD & BRIDGE | R+7.4 | 931 | R+11.0 | 529 | - | - |
| OSCEOLA COUNTY ROAD & BRIDGE | R+9.2 | 889 | R+20.4 | 613 | - | - |
| OSCEOLA COUNTY WELCOME CENTER | D+1.6 | 983 | D+8.6 | 675 | - | - |
| OSCEOLA COUNTY WELCOME CENTER | D+7.4 | 690 | D+14.1 | 389 | - | - |
| OSCEOLA COUNTY WELCOME CENTER | D+5.9 | 1,534 | D+8.5 | 755 | - | - |
| OSCEOLA COUNTY WELCOME CENTER | D+100.0 | 5 | - | - | - | - |
| OSCEOLA HERITAGE PARK | D+8.9 | 236 | R+17.7 | 164 | - | - |
| OSCEOLA HERITAGE PARK | R+2.5 | 3,014 | R+5.5 | 1,858 | - | - |
| OSCEOLA HERITAGE PARK | D+15.8 | 568 | D+16.4 | 372 | - | - |
| OSCEOLA HERITAGE PARK | D+7.7 | 2,257 | D+2.3 | 1,351 | - | - |
| PLEASANT HILL ELEMENTARY SCHOOL | D+12.8 | 2,593 | D+11.1 | 1,576 | - | - |
| PLEASANT HILL ELEMENTARY SCHOOL | D+1.7 | 760 | R+13.6 | 435 | - | - |
| PLEASANT HILL ELEMENTARY SCHOOL | R+20.8 | 24 | R+100.0 | 9 | - | - |
| POINCIANA CHRISTIAN CHURCH | R+0.3 | 1,185 | R+5.9 | 778 | - | - |
| POINCIANA CHRISTIAN CHURCH | D+36.6 | 987 | D+30.7 | 583 | - | - |
| POINCIANA CHRISTIAN CHURCH | D+12.5 | 694 | D+18.3 | 382 | - | - |
| REEDY CREEK ELEMENTARY SCHOOL (part) | D+16.3 | 1,753 | D+22.8 | 936 | - | - |
| REEDY CREEK ELEMENTARY SCHOOL | D+19.5 | 1,022 | D+15.9 | 662 | - | - |
| ROBERT GUEVARA COMMUNITY CENTER | D+16.3 | 6,476 | D+16.3 | 3,940 | - | - |
| ST. CLOUD BRANCH LIBRARY | R+15.4 | 1,570 | R+34.5 | 667 | - | - |
| ST. CLOUD BRANCH LIBRARY | D+1.3 | 532 | R+2.8 | 177 | - | - |
| ST. CLOUD BRANCH LIBRARY | - | 0 | - | - | - | - |
| ST. CLOUD CIVIC CENTER | R+58.3 | 60 | R+61.5 | 52 | - | - |
| ST. CLOUD CIVIC CENTER | R+15.3 | 7,950 | R+24.6 | 5,079 | - | - |
| ST. CLOUD COMMUNITY HOUSE | R+21.0 | 4,406 | R+28.1 | 3,643 | - | - |
| ST. JOHN'S EPISCOPAL CHURCH | D+6.9 | 942 | D+17.9 | 536 | - | - |
| ST. JOHN'S EPISCOPAL CHURCH | D+9.3 | 1,277 | D+17.6 | 780 | - | - |
| ST. JOHN'S EPISCOPAL CHURCH | D+8.7 | 947 | D+10.8 | 472 | - | - |
| ST. LUKE MISSIONARY BAPTIST CHURCH | D+0.0 | 1 | - | - | - | - |
| ST. LUKE MISSIONARY BAPTIST CHURCH | D+28.6 | 786 | D+34.4 | 421 | - | - |
| TAX COLLECTOR (CAMPBELL CITY) | R+17.0 | 471 | R+23.4 | 273 | - | - |
| TAX COLLECTOR (CAMPBELL CITY) | R+5.2 | 460 | R+15.2 | 540 | - | - |
| TAX COLLECTOR (CAMPBELL CITY) | D+13.9 | 822 | D+13.6 | 484 | - | - |
| TAX COLLECTOR (CAMPBELL CITY) | D+16.0 | 25 | - | - | - | - |
| TAX COLLECTOR (CAMPBELL CITY) | R+5.5 | 1,486 | R+7.2 | 991 | - | - |
| TAX COLLECTOR (CAMPBELL CITY) | D+17.5 | 601 | D+23.8 | 164 | - | - |
| THE VINE CHURCH | R+29.1 | 79 | R+14.5 | 62 | - | - |
| THE VINE CHURCH | D+5.8 | 416 | R+0.9 | 229 | - | - |
| THE VINE CHURCH | D+14.4 | 450 | D+12.7 | 291 | - | - |
| THE VINE CHURCH | D+16.0 | 1,267 | D+16.7 | 736 | - | - |
| THE VINE CHURCH | R+2.3 | 88 | - | - | - | - |
| YMCA | D+3.7 | 3,161 | D+4.2 | 1,840 | - | - |
Indian River: 36 precincts
| Precinct | 2024 President | 2022 Governor | 2020 President | |||
|---|---|---|---|---|---|---|
| Margin | Votes | Margin | Votes | Margin | Votes | |
| Precinct 1 | R+74.5 | 47 | R+77.8 | 36 | R+75.6 | 41 |
| Precinct 10 | R+25.9 | 3,057 | R+30.9 | 2,357 | R+22.7 | 5,550 |
| Precinct 11 | R+21.7 | 1,268 | R+33.1 | 1,059 | R+16.4 | 1,266 |
| Precinct 12 | R+76.0 | 25 | R+68.0 | 25 | R+42.0 | 1,290 |
| Precinct 13 | R+35.5 | 3,407 | R+39.1 | 2,632 | R+22.4 | 6,185 |
| Precinct 14 | R+20.8 | 684 | R+23.2 | 518 | R+9.7 | 2,251 |
| Precinct 15 | R+53.0 | 200 | R+57.7 | 149 | R+35.6 | 452 |
| Precinct 16 | R+30.7 | 4,851 | R+38.4 | 3,796 | R+28.9 | 3,606 |
| Precinct 17 | R+26.8 | 4,052 | R+38.4 | 3,238 | R+20.5 | 3,956 |
| Precinct 18 | D+5.4 | 4,524 | R+5.1 | 3,291 | R+28.5 | 3,062 |
| Precinct 19 | R+24.7 | 9,013 | R+34.1 | 7,295 | R+23.2 | 3,177 |
| Precinct 2 | R+2.5 | 797 | R+18.8 | 309 | D+35.9 | 945 |
| Precinct 20 | R+20.0 | 3,296 | R+25.7 | 2,416 | R+18.0 | 527 |
| Precinct 21 | R+24.6 | 447 | R+37.1 | 337 | D+63.5 | 2,370 |
| Precinct 22 | R+25.0 | 2,170 | R+34.0 | 1,808 | R+23.7 | 3,506 |
| Precinct 23 | R+33.2 | 5,586 | R+40.5 | 4,362 | R+10.4 | 2,012 |
| Precinct 24 | R+6.6 | 1,343 | R+19.5 | 951 | D+2.1 | 621 |
| Precinct 25 | R+37.9 | 5,778 | R+43.7 | 4,393 | - | - |
| Precinct 26 | R+25.6 | 3,527 | R+32.6 | 2,673 | D+0.1 | 1,705 |
| Precinct 27 | R+21.9 | 3,404 | R+32.4 | 2,903 | R+22.4 | 3,747 |
| Precinct 28 | R+26.5 | 8,343 | R+34.9 | 5,863 | R+17.8 | 11,488 |
| Precinct 29 | R+10.2 | 2,280 | R+25.1 | 2,071 | R+45.5 | 187 |
| Precinct 3 | R+60.2 | 1,150 | R+68.4 | 851 | R+54.2 | 1,084 |
| Precinct 30 | R+35.0 | 463 | R+45.6 | 419 | R+26.4 | 2,894 |
| Precinct 31 | R+24.5 | 858 | R+34.9 | 736 | R+31.4 | 2,976 |
| Precinct 32 | R+30.6 | 2,830 | R+44.2 | 2,561 | R+31.0 | 5,502 |
| Precinct 33 | R+22.2 | 3,719 | R+33.7 | 3,314 | R+23.8 | 2,480 |
| Precinct 34 | R+26.9 | 2,914 | R+42.7 | 2,600 | R+28.2 | 3,395 |
| Precinct 35 | - | - | - | - | R+24.3 | 2,774 |
| Precinct 36 | - | - | - | - | R+30.5 | 2,026 |
| Precinct 4 | R+44.3 | 4,019 | R+51.0 | 2,528 | R+76.0 | 25 |
| Precinct 5 | R+38.0 | 1,306 | R+34.9 | 1,046 | R+31.7 | 4,254 |
| Precinct 6 | R+32.0 | 1,785 | R+38.2 | 1,434 | R+29.3 | 1,310 |
| Precinct 7 | R+34.4 | 3,193 | R+39.0 | 2,451 | R+26.2 | 1,757 |
| Precinct 8 | R+32.0 | 7,332 | R+36.7 | 5,511 | R+26.6 | 3,925 |
| Precinct 9 | R+31.1 | 1,825 | R+38.9 | 1,467 | R+26.7 | 5,356 |
Orange: 23 precincts
| Precinct | 2024 President | 2022 Governor | 2020 President | |||
|---|---|---|---|---|---|---|
| Margin | Votes | Margin | Votes | Margin | Votes | |
| PCT 433 | - | - | - | - | D+7.2 | 5,016 |
| PCT 439 (part) | - | - | - | - | D+25.6 | 2,628 |
| PCT 440 | - | - | - | - | D+18.3 | 4,728 |
| PL 321 (part) | D+15.3 | 2,835 | D+19.0 | 1,454 | D+34.1 | 3,331 |
| PL 333 | R+33.0 | 1,952 | R+42.1 | 1,606 | R+25.7 | 2,169 |
| PL 334 | R+20.7 | 2,898 | R+26.7 | 2,373 | R+18.2 | 2,887 |
| PL 339 | D+6.0 | 1,287 | R+0.5 | 736 | D+18.5 | 1,396 |
| PL 341 (part) | R+1.2 | 2,034 | R+4.3 | 1,197 | - | - |
| PL 343 (part) | D+13.9 | 2,541 | D+10.8 | 1,497 | - | - |
| PL 405 | R+1.5 | 1,033 | R+10.0 | 4,234 | - | - |
| PL 416 | R+14.9 | 2,877 | R+9.8 | 3,718 | - | - |
| PL 417 | R+0.6 | 2,729 | - | - | - | - |
| PL 418 | D+11.0 | 3,558 | - | - | - | - |
| PL 419 (part) | R+0.5 | 3,101 | - | - | D+13.6 | 2,352 |
| PL 420 | D+14.1 | 4,271 | D+11.6 | 2,409 | D+30.5 | 4,433 |
| PL 425 (part) | D+16.2 | 3,544 | D+14.9 | 2,154 | D+31.4 | 3,039 |
| PL 426 | D+12.7 | 4,329 | D+11.8 | 2,314 | D+33.5 | 5,534 |
| PL 427 | D+11.4 | 3,627 | D+16.0 | 1,998 | D+36.7 | 4,084 |
| PL 428 | D+16.7 | 1,996 | D+19.9 | 1,062 | D+36.6 | 2,280 |
| PL 429 | D+18.3 | 3,021 | D+24.3 | 1,710 | D+40.8 | 3,349 |
| PL 430 | D+10.4 | 5,614 | D+3.5 | 3,174 | D+14.2 | 7,593 |
| PL 431 | D+0.6 | 4,342 | R+5.3 | 3,119 | D+7.5 | 4,398 |
| PL 432 | D+7.3 | 4,229 | R+0.4 | 2,737 | D+9.6 | 2,990 |
Highlands: 50 precincts
| Precinct | 2024 President | 2022 Governor | 2020 President | |||
|---|---|---|---|---|---|---|
| Margin | Votes | Margin | Votes | Margin | Votes | |
| Precinct 1 | R+31.8 | 1,417 | - | - | - | - |
| Precinct 1 | - | - | R+42.4 | 962 | R+24.9 | 1,531 |
| Precinct 10 | R+41.0 | 1,575 | - | - | - | - |
| Precinct 10 | - | - | R+50.4 | 1,259 | R+34.1 | 1,505 |
| Precinct 11 | R+45.7 | 1,382 | - | - | - | - |
| Precinct 11 | - | - | R+53.9 | 1,064 | R+41.8 | 1,500 |
| Precinct 12 | R+61.4 | 905 | - | - | - | - |
| Precinct 12 | - | - | R+64.4 | 699 | R+56.8 | 887 |
| Precinct 13 | R+51.4 | 3,639 | - | - | - | - |
| Precinct 13 | - | - | R+57.3 | 2,829 | R+40.2 | 3,610 |
| Precinct 14 | R+63.0 | 341 | - | - | - | - |
| Precinct 14 | - | - | R+68.2 | 267 | R+64.9 | 325 |
| Precinct 15 | R+50.4 | 5,384 | - | - | - | - |
| Precinct 15 | - | - | R+58.0 | 4,267 | R+45.9 | 5,224 |
| Precinct 16 | R+34.8 | 3,276 | - | - | - | - |
| Precinct 16 | - | - | R+44.0 | 2,284 | R+28.3 | 3,438 |
| Precinct 17 | R+52.7 | 5,302 | - | - | - | - |
| Precinct 17 | - | - | R+58.2 | 4,212 | R+48.7 | 5,300 |
| Precinct 18 | R+57.6 | 198 | - | - | - | - |
| Precinct 18 | - | - | R+62.0 | 121 | R+59.0 | 200 |
| Precinct 19 | R+43.6 | 2,848 | - | - | - | - |
| Precinct 19 | - | - | R+50.8 | 2,213 | R+33.6 | 2,734 |
| Precinct 2 | D+7.4 | 1,944 | - | - | - | - |
| Precinct 2 | - | - | D+1.0 | 1,378 | D+18.3 | 2,238 |
| Precinct 20 | R+42.3 | 1,760 | - | - | - | - |
| Precinct 20 | - | - | R+48.6 | 1,419 | R+35.2 | 1,678 |
| Precinct 21 | R+56.0 | 2,747 | - | - | - | - |
| Precinct 21 | - | - | R+61.0 | 2,016 | R+54.4 | 2,533 |
| Precinct 22 | R+78.7 | 451 | - | - | - | - |
| Precinct 22 | - | - | R+81.8 | 395 | R+71.9 | 441 |
| Precinct 23 | R+47.6 | 708 | - | - | - | - |
| Precinct 23 | - | - | R+57.9 | 477 | R+38.9 | 665 |
| Precinct 24 | R+41.4 | 1,880 | - | - | - | - |
| Precinct 24 | - | - | R+49.3 | 1,564 | R+40.4 | 1,843 |
| Precinct 25 | R+30.4 | 3,290 | - | - | - | - |
| Precinct 25 | - | - | R+38.6 | 2,646 | R+22.9 | 3,346 |
| Precinct 3 | R+61.3 | 1,601 | - | - | - | - |
| Precinct 3 | - | - | R+70.1 | 1,280 | R+56.0 | 1,557 |
| Precinct 4 | R+30.8 | 3,781 | - | - | - | - |
| Precinct 4 | - | - | R+40.4 | 2,741 | R+24.9 | 3,521 |
| Precinct 5 | R+35.1 | 3,726 | - | - | - | - |
| Precinct 5 | - | - | R+44.2 | 2,806 | R+31.8 | 3,876 |
| Precinct 6 | R+40.7 | 1,531 | - | - | - | - |
| Precinct 6 | - | - | R+49.8 | 1,370 | R+40.7 | 1,581 |
| Precinct 7 | R+10.9 | 817 | - | - | - | - |
| Precinct 7 | - | - | R+27.7 | 473 | R+6.7 | 876 |
| Precinct 8 | R+24.2 | 1,124 | - | - | - | - |
| Precinct 8 | - | - | R+37.8 | 825 | R+23.3 | 1,306 |
| Precinct 9 | D+64.4 | 404 | - | - | - | - |
| Precinct 9 | - | - | D+55.8 | 258 | D+74.2 | 500 |
Polk: 5 precincts
| Precinct | 2024 President | 2022 Governor | 2020 President | |||
|---|---|---|---|---|---|---|
| Margin | Votes | Margin | Votes | Margin | Votes | |
| Precinct 533 (part) | R+30.4 | 1,925 | R+33.1 | 1,495 | R+25.4 | 2,025 |
| Precinct 536 (part) | R+56.0 | 1,267 | R+62.6 | 940 | R+49.8 | 1,237 |
| Precinct 537 | R+54.0 | 2,476 | R+60.8 | 1,766 | R+53.6 | 2,200 |
| Precinct 539 | R+39.1 | 1,215 | R+43.4 | 940 | R+21.0 | 1,050 |
| Precinct 540 | R+53.8 | 906 | R+60.6 | 653 | R+57.6 | 1,089 |
Okeechobee: 11 precincts
| Precinct | 2024 President | 2022 Governor | 2020 President | |||
|---|---|---|---|---|---|---|
| Margin | Votes | Margin | Votes | Margin | Votes | |
| 1-ABIDING HOPE WORSHIP CENTER | - | - | - | - | R+62.3 | 1,185 |
| 10-FT DRUM COMMUNITY CHURCH | - | - | - | - | R+55.4 | 904 |
| 11-PALM VILLAGE RANCH CLUBHOUSE | - | - | - | - | R+50.7 | 960 |
| 2-BASINGER COMMUNITY CENTER | - | - | - | - | R+66.0 | 639 |
| 3-OAKVIEW BAPTIST CHURCH | - | - | - | - | R+58.8 | 1,987 |
| 4-OKEECHOBEE CIVIC CENTER | - | - | - | - | R+19.8 | 1,840 |
| 5-FREEDOM RANCH | - | - | - | - | R+47.3 | 1,141 |
| 6-FIRST BAPTIST CHURCH ROC | - | - | - | - | R+33.5 | 2,404 |
| 7 - HAMPTON INN | - | - | - | - | R+20.0 | 982 |
| 8-KOA | - | - | - | - | R+47.8 | 2,613 |
| 9-NEW TESTAMENT BAPTIST CHURCH | - | - | - | - | R+46.0 | 1,321 |
Glades: 13 precincts
| Precinct | 2024 President | 2022 Governor | 2020 President | |||
|---|---|---|---|---|---|---|
| Margin | Votes | Margin | Votes | Margin | Votes | |
| BHR Community Center | R+55.4 | 917 | R+60.9 | 741 | R+53.7 | 949 |
| Doyle Conner Bldg | R+67.0 | 309 | R+79.7 | 251 | R+59.5 | 279 |
| Doyle Conner Bldg | R+67.0 | 233 | R+79.9 | 174 | R+66.2 | 290 |
| Doyle Conner Bldg | R+13.8 | 566 | R+19.5 | 384 | R+35.3 | 241 |
| Indian Hills Fire Dept | R+54.8 | 795 | R+61.5 | 486 | R+49.4 | 599 |
| Lakeport Community Center | R+17.9 | 168 | R+38.4 | 86 | R+8.9 | 168 |
| Lakeport Community Center | R+66.2 | 536 | R+72.2 | 428 | R+60.8 | 566 |
| Lakeport Community Center | R+67.2 | 122 | R+81.0 | 100 | R+65.8 | 117 |
| Muse Community Center | R+66.6 | 724 | R+73.1 | 475 | R+58.6 | 941 |
| Muse Community Center | R+64.8 | 298 | R+78.4 | 213 | D+27.3 | 396 |
| Ortona Community Center | R+56.3 | 366 | R+68.2 | 302 | R+60.5 | 370 |
| Palmdale Community Center | R+75.3 | 194 | R+80.5 | 133 | R+73.4 | 188 |
| Washington Park Comm Center | D+93.1 | 72 | D+78.6 | 56 | D+93.9 | 99 |
2024 President (Harris / Walz vs. Trump / Vance). Source: Florida Department of State, Division of Elections, Precinct-Level Election Results. Official results (Florida Division of Elections precinct-level file, compiled from county SOE submissions).
2022 Governor (Crist / Hernandez vs. DeSantis / Nuñez). Source: Florida Department of State, Division of Elections, Precinct-Level Election Results. Official results (Florida Division of Elections precinct-level file, compiled from county SOE submissions).
2020 President (Biden / Harris vs. Trump / Pence). Source: Florida Department of State, Division of Elections, Precinct-Level Election Results. Official results (Florida Division of Elections precinct-level file, compiled from county SOE submissions).
Precinct demographics
Demographics are Census American Community Survey (ACS) 2020-2024 5-year estimates for block groups, assigned to precincts by area share. They describe the resident population, not registered or likely voters, and include non-citizens. ACS margins of error are not shown; small precincts carry large error. Area weighting assumes people are spread evenly within each block group, so large rural precincts are the least reliable. Median income is a household-weighted average of block-group medians, an approximation.
| Area | Population | Voting-age pop. | % White non-Hisp. | % Hispanic | % Black | % Asian | Median income* | % Bachelor's+ | % 18-29 (of adults) | % 65+ | % Homeowners | % Below poverty | % Spanish at home (adults) |
|---|---|---|---|---|---|---|---|---|---|---|---|---|---|
| District | 805,853 | 636,692 | 43.7% | 40.9% | 8.4% | 2.8% | $78k | 30.6% | 16.6% | 20.6% | 72.5% | 12.4% | 33.4% |
| Osceola (in district) | 347,114 | 263,732 | 26.7% | 58.1% | 8.2% | 2.9% | $77k | 29.2% | 20.1% | 13.1% | 66.5% | 12.9% | 49.7% |
| Indian River (in district) | 167,750 | 142,590 | 72.5% | 13.8% | 7.7% | 1.5% | $81k | 33.8% | 12.0% | 34.8% | 80.1% | 11.1% | 9.4% |
| Orange (in district) | 131,987 | 99,052 | 28.4% | 51.9% | 8.7% | 6.4% | $106k | 47.0% | 17.6% | 10.7% | 67.9% | 7.3% | 45.3% |
| Highlands (in district) | 93,003 | 77,197 | 63.6% | 21.6% | 9.5% | 1.1% | $57k | 19.7% | 12.1% | 35.4% | 78.4% | 15.9% | 17.2% |
| Okeechobee (in district) | 40,919 | 32,180 | 61.9% | 26.1% | 7.5% | 0.7% | $59k | 15.8% | 17.8% | 20.0% | 73.9% | 18.0% | 18.6% |
| Glades (in district) | 12,566 | 10,904 | 54.6% | 25.7% | 14.7% | 0.5% | $55k | 13.4% | 14.6% | 25.9% | 85.1% | 17.2% | 21.3% |
| Polk (in district) | 12,514 | 11,037 | 68.8% | 16.3% | 10.8% | 0.1% | $59k | 14.9% | 14.3% | 31.7% | 78.6% | 20.7% | 12.4% |
Osceola: 116 precincts
| Precinct | Population | Voting-age pop. | % White non-Hisp. | % Hispanic | % Black | % Asian | Median income* | % Bachelor's+ | % 18-29 (of adults) | % 65+ | % Homeowners | % Below poverty | % Spanish at home (adults) |
|---|---|---|---|---|---|---|---|---|---|---|---|---|---|
| Precinct 1003 (part) | 2,682 | 2,134 | 15.6% | 69.3% | 10.3% | 0.7% | $81k | 22.5% | 22.3% | 14.5% | 80.0% | 10.9% | 60.7% |
| Precinct 1004 | 5,266 | 4,036 | 30.0% | 52.3% | 4.7% | 3.9% | $61k | 35.7% | 25.9% | 8.4% | 46.2% | 21.6% | 45.5% |
| Precinct 1005 | 2,494 | 2,056 | 29.0% | 51.8% | 6.6% | 6.5% | $56k | 25.4% | 22.0% | 14.1% | 70.5% | 19.1% | 47.4% |
| Precinct 1006 | 6,150 | 4,540 | 24.8% | 68.3% | 1.4% | 1.7% | $66k | 23.7% | 20.9% | 8.0% | 57.6% | 24.8% | 60.7% |
| Precinct 1007 | 6,572 | 5,184 | 22.2% | 54.0% | 14.3% | 6.0% | $65k | 35.8% | 21.2% | 12.7% | 72.2% | 5.2% | 48.4% |
| Precinct 1008 | 1,121 | 1,070 | 37.3% | 51.7% | 5.4% | 3.0% | $47k | 26.8% | 3.0% | 55.1% | 37.6% | 36.8% | 43.3% |
| Precinct 1100 | 2,032 | 1,623 | 22.2% | 62.5% | 5.3% | 4.0% | $58k | 27.1% | 29.1% | 7.7% | 60.5% | 17.3% | 55.9% |
| Precinct 1101 | 1,152 | 892 | 30.5% | 42.1% | 7.6% | 8.9% | $70k | 30.9% | 19.3% | 10.2% | 69.8% | 4.8% | 35.1% |
| Precinct 1102 | 4,944 | 3,820 | 16.2% | 67.1% | 11.3% | 3.6% | $71k | 39.5% | 21.8% | 12.8% | 41.4% | 20.7% | 64.5% |
| Precinct 1103 | 8,002 | 5,875 | 14.8% | 78.9% | 2.8% | 2.6% | $58k | 30.6% | 17.5% | 7.7% | 33.3% | 29.8% | 71.2% |
| Precinct 1515 | 568 | 428 | 49.6% | 29.2% | 2.4% | 8.5% | $62k | 25.6% | 23.3% | 12.7% | 54.1% | 21.4% | 28.7% |
| Precinct 1516 | 28 | 24 | 34.5% | 48.9% | 11.7% | 1.3% | $69k | 34.2% | 27.4% | 14.0% | 62.6% | 15.2% | 44.4% |
| Precinct 1517 | 1,335 | 949 | 27.0% | 63.5% | 0.5% | 2.4% | $72k | 31.6% | 21.0% | 4.2% | 47.7% | 23.2% | 51.4% |
| Precinct 1518 | 850 | 604 | 27.0% | 63.5% | 0.5% | 2.4% | $72k | 31.6% | 21.0% | 4.2% | 47.7% | 23.2% | 51.4% |
| Precinct 1519 | 537 | 416 | 36.7% | 49.3% | 1.7% | 11.2% | $87k | 29.3% | 15.6% | 15.0% | 93.3% | 6.1% | 40.8% |
| Precinct 1600 | 163 | 126 | 30.3% | 41.9% | 7.8% | 8.8% | $69k | 31.0% | 19.4% | 10.1% | 69.1% | 4.8% | 34.9% |
| Precinct 2000 | 6,756 | 5,562 | 12.6% | 75.0% | 6.1% | 2.1% | $67k | 28.9% | 31.2% | 16.1% | 24.9% | 20.3% | 74.0% |
| Precinct 2001 | 1,547 | 1,283 | 19.3% | 53.9% | 19.1% | 0.7% | $64k | 20.8% | 16.4% | 12.7% | 54.3% | 23.2% | 47.9% |
| Precinct 2002 | 17,974 | 14,873 | 11.6% | 71.3% | 10.9% | 4.7% | $82k | 22.2% | 22.9% | 14.7% | 73.0% | 12.2% | 59.0% |
| Precinct 2003 | 1,946 | 1,462 | 18.5% | 64.9% | 9.8% | 0.7% | $62k | 27.2% | 18.9% | 11.7% | 51.6% | 9.9% | 58.8% |
| Precinct 2004 | 14,645 | 10,840 | 8.6% | 79.7% | 8.1% | 0.9% | $65k | 22.8% | 19.8% | 14.0% | 75.3% | 14.5% | 66.8% |
| Precinct 2005 | 10,573 | 8,357 | 18.7% | 68.3% | 5.2% | 6.1% | $103k | 30.2% | 20.8% | 11.6% | 82.0% | 5.6% | 60.3% |
| Precinct 2100 | 4,349 | 3,369 | 13.5% | 66.6% | 15.2% | 3.1% | $60k | 32.5% | 28.1% | 14.3% | 40.9% | 22.6% | 65.7% |
| Precinct 2101 | 4,855 | 3,306 | 8.0% | 84.5% | 2.2% | 3.6% | $52k | 14.1% | 23.2% | 9.6% | 26.1% | 23.2% | 70.1% |
| Precinct 2102 | 887 | 734 | 19.3% | 51.7% | 21.6% | 0.3% | $60k | 21.3% | 16.9% | 12.0% | 48.6% | 23.8% | 47.7% |
| Precinct 2103 | 3,113 | 2,595 | 19.3% | 68.7% | 3.1% | 2.8% | $84k | 17.8% | 13.5% | 17.7% | 89.7% | 19.2% | 50.7% |
| Precinct 2104 | 3,835 | 3,375 | 22.3% | 63.8% | 4.1% | 4.6% | $68k | 23.0% | 16.9% | 12.7% | 76.3% | 16.5% | 52.5% |
| Precinct 2105 | 7,556 | 6,303 | 3.6% | 84.7% | 8.9% | 2.2% | $48k | 19.2% | 25.3% | 15.0% | 48.3% | 10.1% | 70.4% |
| Precinct 2106 | 754 | 655 | 11.8% | 83.5% | 4.7% | 0.0% | $93k | 23.0% | 28.1% | 16.7% | 87.4% | 4.7% | 77.4% |
| Precinct 2500 | 195 | 169 | 12.0% | 82.9% | 4.8% | 0.2% | $94k | 23.1% | 27.9% | 16.5% | 87.3% | 4.8% | 76.9% |
| Precinct 2501 | 3,553 | 2,820 | 18.2% | 66.4% | 4.7% | 6.5% | $99k | 36.8% | 23.5% | 11.8% | 79.6% | 11.1% | 55.4% |
| Precinct 3000 | 9,998 | 7,218 | 25.1% | 50.4% | 18.3% | 3.4% | $88k | 25.4% | 13.3% | 17.9% | 89.4% | 4.3% | 41.9% |
| Precinct 3001 | 107 | 90 | 25.8% | 40.2% | 20.9% | 9.4% | $72k | 45.9% | 14.8% | 25.4% | 79.4% | 16.9% | 37.9% |
| Precinct 3002 | 3,208 | 2,501 | 33.6% | 51.0% | 7.3% | 5.5% | $54k | 30.8% | 12.5% | 14.0% | 78.1% | 24.1% | 48.8% |
| Precinct 3003 (part) | 2,685 | 2,168 | 30.8% | 55.6% | 7.2% | 1.5% | $82k | 21.3% | 23.0% | 11.5% | 82.8% | 14.6% | 47.5% |
| Precinct 3004 | 8,661 | 6,124 | 26.2% | 52.6% | 15.0% | 2.2% | $90k | 27.5% | 24.2% | 11.1% | 78.5% | 15.2% | 47.4% |
| Precinct 3005 | 2,025 | 1,432 | 15.9% | 64.7% | 14.4% | 1.9% | $86k | 24.2% | 19.5% | 10.2% | 91.0% | 5.8% | 59.2% |
| Precinct 3009 (part) | 6,654 | 5,002 | 20.1% | 53.9% | 14.0% | 6.9% | $74k | 32.4% | 20.0% | 16.9% | 82.6% | 9.1% | 40.8% |
| Precinct 3010 | 3,761 | 2,666 | 19.1% | 55.4% | 13.3% | 7.7% | $75k | 27.4% | 22.3% | 12.0% | 80.6% | 10.2% | 41.2% |
| Precinct 3100 | 1,017 | 752 | 22.6% | 51.8% | 18.2% | 4.7% | $74k | 21.3% | 19.8% | 13.2% | 64.0% | 17.5% | 39.4% |
| Precinct 3101 | 651 | 471 | 30.8% | 53.9% | 8.8% | 1.8% | $80k | 23.5% | 20.1% | 11.3% | 48.1% | 18.4% | 43.4% |
| Precinct 3500 | 535 | 455 | 25.6% | 39.2% | 21.4% | 9.8% | $71k | 47.2% | 14.9% | 25.9% | 78.5% | 17.8% | 37.5% |
| Precinct 3501 | 1,005 | 727 | 22.9% | 59.2% | 12.9% | 1.6% | $78k | 29.2% | 20.7% | 9.6% | 83.3% | 8.9% | 54.1% |
| Precinct 3502 | 341 | 307 | 49.3% | 38.4% | 6.2% | 1.9% | $81k | 12.4% | 17.2% | 14.2% | 80.4% | 16.6% | 27.6% |
| Precinct 3503 | 1,226 | 869 | 16.4% | 63.9% | 13.5% | 3.1% | $84k | 23.9% | 20.8% | 10.0% | 88.7% | 7.3% | 56.7% |
| Precinct 3504 | 1,367 | 793 | 6.7% | 33.9% | 59.3% | 0.0% | $75k | 21.3% | 10.4% | 14.1% | 65.7% | 10.8% | 43.3% |
| Precinct 3505 | 496 | 351 | 15.9% | 64.7% | 14.5% | 1.9% | $86k | 24.2% | 19.6% | 10.2% | 91.0% | 5.8% | 59.2% |
| Precinct 3600 | 1,344 | 1,142 | 25.6% | 39.1% | 21.5% | 9.9% | $71k | 47.3% | 14.9% | 26.0% | 78.4% | 17.9% | 37.4% |
| Precinct 3601 | 79 | 58 | 22.3% | 53.1% | 17.9% | 4.2% | $75k | 18.3% | 20.3% | 11.9% | 62.3% | 17.5% | 39.6% |
| Precinct 4000 | 403 | 324 | 52.6% | 42.5% | 0.8% | 1.1% | $93k | 30.5% | 13.5% | 12.4% | 77.9% | 9.0% | 28.1% |
| Precinct 4001 | 806 | 633 | 44.6% | 46.4% | 1.9% | 0.9% | $56k | 26.1% | 21.0% | 19.5% | 69.1% | 14.2% | 38.3% |
| Precinct 4002 | 142 | 116 | 30.9% | 53.9% | 6.7% | 3.4% | $88k | 27.0% | 28.3% | 14.7% | 80.0% | 11.6% | 45.6% |
| Precinct 4003 | 1,916 | 1,416 | 17.6% | 65.4% | 6.6% | 2.7% | $95k | 34.2% | 18.1% | 10.5% | 84.7% | 2.3% | 46.9% |
| Precinct 4004 | 6,299 | 4,589 | 27.9% | 55.7% | 7.1% | 2.5% | $97k | 31.6% | 17.7% | 13.2% | 75.5% | 5.1% | 39.2% |
| Precinct 4005 | 9,792 | 7,723 | 14.1% | 76.3% | 5.6% | 0.6% | $46k | 34.4% | 31.9% | 16.6% | 25.9% | 20.5% | 67.0% |
| Precinct 4006 | 3,596 | 2,946 | 18.9% | 50.3% | 24.2% | 2.0% | $48k | 14.3% | 21.7% | 14.2% | 49.9% | 27.0% | 44.0% |
| Precinct 4007 | 2,533 | 2,074 | 24.6% | 43.6% | 19.9% | 7.9% | $69k | 39.4% | 16.4% | 22.0% | 70.5% | 17.8% | 39.3% |
| Precinct 4008 | 34 | 27 | 51.6% | 43.4% | 1.1% | 1.3% | $94k | 30.9% | 13.5% | 12.4% | 77.5% | 8.6% | 28.4% |
| Precinct 4009 | 30 | 21 | 10.2% | 51.4% | 36.7% | 0.0% | 23.8% | 35.4% | 6.9% | 33.5% | 15.6% | 60.7% | |
| Precinct 4010 | 514 | 373 | 29.4% | 59.6% | 0.9% | 0.0% | $109k | 38.9% | 8.1% | 17.2% | 61.6% | 7.7% | 61.6% |
| Precinct 4100 | 1,137 | 919 | 16.4% | 61.7% | 10.7% | 4.4% | $53k | 17.3% | 19.1% | 14.0% | 53.6% | 19.9% | 53.9% |
| Precinct 4101 | 1,958 | 1,510 | 23.7% | 54.7% | 14.5% | 2.6% | $69k | 19.1% | 15.6% | 15.5% | 51.8% | 21.0% | 48.6% |
| Precinct 4102 | 13,457 | 9,467 | 10.6% | 73.6% | 7.3% | 1.6% | $62k | 35.6% | 19.8% | 7.1% | 39.0% | 14.4% | 70.3% |
| Precinct 4103 | 6,088 | 4,550 | 11.5% | 76.9% | 6.6% | 1.4% | $38k | 13.3% | 27.2% | 7.8% | 11.1% | 29.9% | 68.2% |
| Precinct 4104 | 3,943 | 3,162 | 20.2% | 49.4% | 24.1% | 1.9% | $36k | 9.8% | 23.1% | 16.3% | 38.5% | 27.3% | 44.6% |
| Precinct 4200 | 4,905 | 3,856 | 32.0% | 53.4% | 7.1% | 3.3% | $92k | 29.1% | 24.8% | 14.2% | 78.6% | 9.9% | 42.8% |
| Precinct 4201 | 16,914 | 12,462 | 41.6% | 45.8% | 2.6% | 0.9% | $66k | 27.1% | 19.3% | 14.7% | 68.2% | 15.1% | 36.7% |
| Precinct 4202 | 2 | 2 | 54.2% | 42.1% | 0.0% | 0.8% | $93k | 30.4% | 13.4% | 12.5% | 77.9% | 9.2% | 27.8% |
| Precinct 4500 | 445 | 329 | 17.5% | 65.4% | 6.6% | 2.7% | $95k | 34.2% | 18.1% | 10.5% | 84.9% | 2.3% | 46.8% |
| Precinct 4501 | 297 | 219 | 17.5% | 65.4% | 6.6% | 2.7% | $95k | 34.2% | 18.1% | 10.5% | 84.9% | 2.3% | 46.8% |
| Precinct 4502 | 109 | 85 | 44.9% | 48.6% | 0.3% | 0.6% | $98k | 33.3% | 11.5% | 14.2% | 72.6% | 8.6% | 39.5% |
| Precinct 4503 | 32 | 26 | 54.0% | 42.1% | 0.0% | 1.0% | $93k | 30.4% | 13.4% | 12.4% | 77.9% | 9.1% | 27.7% |
| Precinct 4504 | 29 | 23 | 54.0% | 42.1% | 0.0% | 1.0% | $93k | 30.4% | 13.4% | 12.4% | 77.9% | 9.1% | 27.7% |
| Precinct 4505 | 59 | 48 | 54.0% | 42.1% | 0.0% | 1.0% | $93k | 30.4% | 13.5% | 12.4% | 77.9% | 9.1% | 27.7% |
| Precinct 4600 | 2,920 | 2,045 | 13.3% | 67.0% | 10.4% | 1.4% | $72k | 45.6% | 22.8% | 4.8% | 39.4% | 9.2% | 63.6% |
| Precinct 4700 | 1,304 | 847 | 48.0% | 42.1% | 0.0% | 0.8% | $87k | 25.7% | 12.8% | 10.3% | 63.7% | 2.3% | 43.6% |
| Precinct 4701 | 1,491 | 1,088 | 31.1% | 54.3% | 1.1% | 0.4% | $94k | 35.1% | 10.5% | 16.0% | 65.6% | 10.5% | 53.2% |
| Precinct 4702 | 173 | 124 | 34.9% | 52.0% | 8.4% | 3.0% | $106k | 34.9% | 14.0% | 12.9% | 74.5% | 5.3% | 33.8% |
| Precinct 4703 | 954 | 705 | 17.5% | 65.4% | 6.6% | 2.7% | $95k | 34.2% | 18.1% | 10.5% | 84.9% | 2.3% | 46.8% |
| Precinct 5000 | 9,970 | 7,414 | 30.5% | 59.5% | 3.5% | 6.5% | $101k | 26.9% | 15.7% | 8.4% | 91.6% | 5.5% | 51.7% |
| Precinct 5001 | 5,423 | 4,056 | 46.0% | 38.4% | 10.5% | 3.7% | $117k | 47.4% | 13.1% | 12.8% | 94.8% | 3.9% | 30.0% |
| Precinct 5002 | 9,069 | 6,482 | 47.1% | 42.1% | 5.8% | 2.8% | $112k | 42.7% | 17.4% | 14.1% | 77.5% | 6.0% | 32.4% |
| Precinct 5003 | 2,414 | 1,726 | 32.5% | 54.1% | 7.4% | 3.7% | $96k | 38.7% | 18.8% | 12.1% | 82.9% | 10.1% | 43.0% |
| Precinct 5004 | 2,668 | 2,059 | 37.9% | 44.9% | 6.6% | 1.1% | $94k | 34.2% | 14.2% | 12.7% | 81.3% | 9.8% | 40.0% |
| Precinct 5005 | 2,602 | 1,960 | 39.6% | 46.1% | 6.5% | 2.3% | $97k | 35.4% | 17.8% | 14.5% | 87.4% | 7.2% | 36.3% |
| Precinct 5006 | 176 | 122 | 40.4% | 43.0% | 9.8% | 2.0% | $82k | 20.2% | 20.5% | 8.9% | 61.5% | 8.2% | 34.3% |
| Precinct 5007 | 209 | 149 | 36.6% | 50.9% | 8.9% | 2.0% | $98k | 35.9% | 17.5% | 10.8% | 76.4% | 7.8% | 37.5% |
| Precinct 5008 | 3,416 | 2,555 | 47.9% | 36.7% | 8.6% | 2.3% | $94k | 31.7% | 17.3% | 12.7% | 81.3% | 5.4% | 28.4% |
| Precinct 5009 | 2,628 | 2,173 | 84.2% | 10.1% | 0.9% | 0.6% | $92k | 23.0% | 21.5% | 10.4% | 84.1% | 1.9% | 9.1% |
| Precinct 5010 | 9,526 | 7,375 | 45.5% | 44.5% | 3.0% | 2.2% | $82k | 27.8% | 16.9% | 14.9% | 84.0% | 6.4% | 36.6% |
| Precinct 5011 | 2,830 | 2,175 | 75.8% | 22.8% | 0.2% | 0.1% | $72k | 18.5% | 19.8% | 13.2% | 67.0% | 18.3% | 25.0% |
| Precinct 5012 | 4,200 | 2,930 | 60.5% | 31.8% | 1.3% | 0.8% | $84k | 38.3% | 11.0% | 18.4% | 89.5% | 6.0% | 26.8% |
| Precinct 5013 | 1,026 | 686 | 53.5% | 36.9% | 1.7% | 1.1% | $97k | 50.4% | 8.2% | 18.9% | 96.3% | 2.8% | 30.7% |
| Precinct 5200 | 6,518 | 5,143 | 53.9% | 33.9% | 4.4% | 1.5% | $80k | 31.3% | 17.5% | 16.0% | 63.6% | 10.6% | 28.2% |
| Precinct 5201 | 9,315 | 6,881 | 40.0% | 46.9% | 8.0% | 0.6% | $100k | 36.5% | 18.3% | 11.9% | 86.8% | 8.0% | 36.3% |
| Precinct 5202 | 4,013 | 2,871 | 34.9% | 52.0% | 8.4% | 3.0% | $106k | 34.9% | 14.0% | 12.9% | 74.5% | 5.3% | 33.8% |
| Precinct 5203 | 2,569 | 1,904 | 47.2% | 42.0% | 6.3% | 0.7% | $88k | 29.1% | 24.4% | 11.7% | 60.0% | 8.7% | 31.4% |
| Precinct 5204 | 386 | 264 | 29.9% | 56.4% | 6.4% | 3.4% | $84k | 25.7% | 22.7% | 10.5% | 66.2% | 12.1% | 45.2% |
| Precinct 5205 | 1,729 | 1,315 | 40.7% | 48.6% | 10.4% | 0.1% | $95k | 35.1% | 17.8% | 14.0% | 91.3% | 3.1% | 38.5% |
| Precinct 5206 | 2,721 | 1,831 | 22.4% | 66.0% | 4.1% | 4.3% | $85k | 29.1% | 24.6% | 11.2% | 68.1% | 14.9% | 53.5% |
| Precinct 5500 | 194 | 148 | 44.2% | 40.2% | 11.2% | 2.9% | $107k | 46.9% | 13.2% | 12.9% | 97.3% | 4.5% | 32.2% |
| Precinct 5501 | 5,839 | 4,413 | 48.0% | 37.8% | 9.5% | 2.5% | $103k | 43.6% | 14.1% | 12.8% | 93.7% | 4.5% | 30.2% |
| Precinct 5502 | 170 | 130 | 42.2% | 40.6% | 7.5% | 3.1% | $102k | 37.8% | 15.2% | 19.3% | 91.9% | 5.0% | 29.9% |
| Precinct 5503 | 623 | 479 | 42.2% | 40.6% | 7.5% | 3.1% | $102k | 37.8% | 15.2% | 19.3% | 91.9% | 5.0% | 29.9% |
| Precinct 5504 | 39 | 26 | 53.5% | 36.9% | 1.7% | 1.1% | $97k | 50.4% | 8.2% | 18.9% | 96.3% | 2.8% | 30.7% |
| Precinct 5505 | 230 | 154 | 53.8% | 36.6% | 1.7% | 1.1% | $97k | 50.1% | 8.3% | 18.8% | 96.1% | 2.8% | 30.5% |
| Precinct 5506 | 146 | 106 | 34.3% | 52.0% | 8.0% | 3.6% | $98k | 40.1% | 17.9% | 12.2% | 85.1% | 9.2% | 41.3% |
| Precinct 5507 | 141 | 106 | 41.3% | 43.7% | 10.2% | 3.1% | $104k | 45.0% | 14.5% | 12.7% | 93.7% | 5.9% | 34.8% |
| Precinct 5508 | 66 | 53 | 54.2% | 41.8% | 0.0% | 1.0% | $92k | 30.2% | 13.4% | 12.5% | 77.8% | 9.2% | 27.5% |
| Precinct 5509 | 107 | 82 | 42.2% | 40.6% | 7.5% | 3.1% | $102k | 37.7% | 15.2% | 19.3% | 91.8% | 5.0% | 29.9% |
| Precinct 5510 | 2 | 1 | 95.0% | 1.3% | 1.3% | 0.6% | 13.8% | 18.7% | 28.3% | 100.0% | 1.9% | 0.0% | |
| Precinct 5511 | 35 | 25 | 56.2% | 22.8% | 14.7% | 0.0% | $78k | 13.3% | 17.1% | 6.9% | 56.1% | 2.3% | 18.4% |
| Precinct 5700 | 558 | 415 | 40.4% | 42.9% | 4.5% | 1.2% | $114k | 37.3% | 14.5% | 14.0% | 89.2% | 9.1% | 27.8% |
| Precinct 5701 | 450 | 352 | 32.4% | 61.9% | 0.0% | 3.6% | $78k | 22.4% | 22.8% | 9.3% | 82.4% | 5.1% | 55.8% |
| Precinct 5702 | 776 | 549 | 38.8% | 50.0% | 10.4% | 0.4% | $84k | 37.4% | 23.8% | 6.9% | 77.3% | 11.8% | 44.9% |
| Precinct 5703 | 456 | 307 | 21.5% | 67.2% | 3.8% | 4.5% | $86k | 29.6% | 24.8% | 11.3% | 68.5% | 15.3% | 54.5% |
Indian River: 38 precincts
| Precinct | Population | Voting-age pop. | % White non-Hisp. | % Hispanic | % Black | % Asian | Median income* | % Bachelor's+ | % 18-29 (of adults) | % 65+ | % Homeowners | % Below poverty | % Spanish at home (adults) |
|---|---|---|---|---|---|---|---|---|---|---|---|---|---|
| 101-Voting District | 823 | 628 | 53.7% | 18.1% | 4.4% | 4.3% | $101k | 27.0% | 12.9% | 22.7% | 85.6% | 11.8% | 16.6% |
| 102A-Voting District (Eastern Portion of 102) | 5,165 | 3,894 | 41.4% | 51.7% | 4.2% | 0.2% | $65k | 15.6% | 12.0% | 16.4% | 78.5% | 9.2% | 44.5% |
| 102B-Voting District (Western Portion of 102) | 2,971 | 2,200 | 23.7% | 58.3% | 16.7% | 0.1% | $62k | 17.9% | 29.5% | 10.3% | 85.8% | 27.4% | 45.2% |
| 103-Voting District | 1,787 | 1,580 | 80.0% | 11.4% | 4.7% | 0.1% | $81k | 35.6% | 9.4% | 44.6% | 69.1% | 10.0% | 8.4% |
| 104-Voting District | 9,075 | 7,602 | 66.3% | 22.3% | 6.3% | 1.2% | $87k | 30.6% | 11.3% | 23.0% | 88.7% | 5.7% | 17.2% |
| 105-Voting District | 1,903 | 1,819 | 91.1% | 6.2% | 0.4% | 1.4% | $62k | 29.9% | 10.1% | 46.2% | 86.8% | 11.1% | 0.5% |
| 106A-Voting District (North Portion of 106) | 3,401 | 3,132 | 90.3% | 3.5% | 2.1% | 0.6% | $64k | 28.1% | 13.7% | 36.0% | 80.7% | 13.9% | 1.9% |
| 106B-Voting District (South Portion of 106) | 4,726 | 4,063 | 80.2% | 11.5% | 3.5% | 2.1% | $56k | 22.0% | 5.6% | 43.9% | 79.3% | 13.8% | 7.1% |
| 107-Voting District | 6,805 | 5,863 | 88.0% | 5.8% | 0.9% | 3.6% | $76k | 22.5% | 8.6% | 35.2% | 88.5% | 7.7% | 2.3% |
| 108A-Voting District (Southeast Portion of 108) | 8,793 | 7,493 | 78.3% | 16.5% | 2.1% | 0.4% | $68k | 24.5% | 7.6% | 34.1% | 86.0% | 11.5% | 10.9% |
| 108B-Voting District (Southwest Portion of 108) | 2,705 | 2,581 | 85.5% | 3.0% | 6.4% | 1.7% | $59k | 29.5% | 2.0% | 58.5% | 84.5% | 8.5% | 2.1% |
| 108C-Voting District (North Half of 108) | 1,589 | 1,347 | 72.6% | 11.7% | 8.6% | 0.8% | $95k | 42.4% | 19.6% | 22.2% | 95.2% | 2.7% | 8.3% |
| 109-Voting District | 10,805 | 9,715 | 71.4% | 11.5% | 6.8% | 0.8% | $96k | 45.4% | 13.2% | 48.2% | 85.1% | 8.7% | 5.4% |
| 110A-Voting District (Eastern Portion of 110) | 3,786 | 3,719 | 93.4% | 3.8% | 1.1% | 0.8% | $122k | 60.8% | 3.7% | 63.5% | 97.2% | 7.3% | 2.5% |
| 110B-Voting District (Central Portion of 110) | 669 | 666 | 89.6% | 3.2% | 0.9% | 0.0% | $154k | 73.2% | 0.8% | 69.5% | 100.0% | 4.1% | 0.8% |
| 110C-Voting District (Western Portion of 110) | 3,761 | 3,573 | 93.5% | 2.7% | 0.2% | 2.0% | $173k | 78.4% | 1.6% | 70.9% | 96.5% | 7.8% | 1.4% |
| 111-Voting District | 3,749 | 3,443 | 89.7% | 3.2% | 1.5% | 1.9% | $139k | 68.8% | 4.6% | 47.8% | 87.7% | 8.5% | 3.6% |
| 112-Voting District | 3,253 | 2,979 | 92.3% | 2.6% | 0.0% | 0.8% | $175k | 64.4% | 1.1% | 55.5% | 96.8% | 4.5% | 2.5% |
| 113-Voting District | 3,919 | 3,319 | 82.3% | 9.3% | 4.1% | 0.7% | $68k | 33.5% | 15.0% | 32.3% | 67.2% | 12.0% | 7.9% |
| 137-Voter District | 26 | 20 | 53.7% | 18.1% | 4.4% | 4.3% | $101k | 27.0% | 12.9% | 22.7% | 85.6% | 11.8% | 16.6% |
| 138-Voters District | 205 | 157 | 53.6% | 18.2% | 4.6% | 4.3% | $100k | 26.8% | 13.0% | 22.5% | 85.5% | 11.8% | 16.5% |
| 201-Voting District | 1,099 | 968 | 88.6% | 0.2% | 9.2% | 1.3% | $59k | 27.4% | 14.6% | 47.9% | 45.1% | 6.3% | 1.3% |
| 202-Voting District | 5,170 | 3,615 | 17.6% | 12.8% | 67.3% | 0.8% | $45k | 21.0% | 23.1% | 12.2% | 52.9% | 40.1% | 8.3% |
| 203A-Voting District (South of Canal Portion of 203) | 5,504 | 4,738 | 82.3% | 15.8% | 0.5% | 0.4% | $85k | 36.3% | 8.1% | 35.0% | 70.3% | 4.4% | 7.9% |
| 203B-Voting District (North of Canal Portion of 203) | 5,679 | 4,499 | 51.0% | 18.5% | 22.8% | 1.6% | $54k | 18.8% | 19.6% | 11.9% | 53.7% | 21.0% | 10.7% |
| 204-Voting District | 2,119 | 1,894 | 62.2% | 19.2% | 4.4% | 2.8% | $46k | 22.9% | 25.2% | 25.5% | 19.2% | 25.0% | 17.2% |
| 205-Voting District | 3,315 | 2,866 | 74.9% | 15.2% | 7.6% | 0.2% | $58k | 35.3% | 15.7% | 33.5% | 62.5% | 23.0% | 9.5% |
| 206A-Voting District (Eastern Portion of 206) | 3,407 | 2,866 | 64.4% | 25.5% | 5.6% | 1.0% | $41k | 22.5% | 17.2% | 26.1% | 51.9% | 17.9% | 16.8% |
| 206B-Voting District (Central Portion of 206) | 6,550 | 5,632 | 79.9% | 11.4% | 3.0% | 1.3% | $56k | 29.0% | 12.0% | 39.0% | 74.4% | 8.9% | 6.2% |
| 206C-Voting District (Western Portion of 206) | 22,476 | 17,794 | 67.2% | 12.1% | 14.5% | 1.4% | $77k | 28.9% | 17.2% | 25.6% | 83.8% | 9.7% | 10.2% |
| 207A-Voting District (Eastern Portion of 207) | 219 | 216 | 78.1% | 12.2% | 1.5% | 3.3% | $92k | 48.5% | 12.5% | 42.3% | 83.5% | 9.4% | 7.4% |
| 207B-Voting District (Western Portion of 207) | 6,328 | 5,232 | 54.7% | 15.9% | 4.9% | 7.9% | $81k | 22.7% | 20.0% | 23.9% | 82.0% | 12.6% | 11.1% |
| 208-Voting District | 4,614 | 3,699 | 81.0% | 11.2% | 1.5% | 1.5% | $71k | 24.0% | 7.9% | 33.0% | 83.8% | 7.8% | 8.5% |
| 209A-Voting District (Eastern Portion of 209) | 8,420 | 7,177 | 83.7% | 9.9% | 1.3% | 2.6% | $96k | 38.6% | 12.4% | 33.3% | 90.6% | 5.5% | 5.9% |
| 209B-Voting District (Western Portion of 209) | 2,960 | 2,632 | 82.6% | 6.4% | 5.5% | 0.0% | $92k | 42.3% | 4.8% | 53.0% | 71.0% | 5.3% | 3.9% |
| 301-Voting District | 3,429 | 2,940 | 84.6% | 7.2% | 1.3% | 0.5% | $50k | 17.4% | 5.2% | 49.4% | 85.9% | 9.3% | 6.9% |
| 302-Voting District | 5,110 | 4,846 | 82.3% | 12.4% | 1.9% | 0.5% | $60k | 40.0% | 9.6% | 53.6% | 76.6% | 8.7% | 7.9% |
| 303-Voting District | 1,435 | 1,185 | 84.2% | 11.2% | 1.1% | 2.7% | $92k | 51.5% | 8.7% | 37.4% | 90.0% | 6.1% | 6.6% |
Orange: 20 precincts
| Precinct | Population | Voting-age pop. | % White non-Hisp. | % Hispanic | % Black | % Asian | Median income* | % Bachelor's+ | % 18-29 (of adults) | % 65+ | % Homeowners | % Below poverty | % Spanish at home (adults) |
|---|---|---|---|---|---|---|---|---|---|---|---|---|---|
| Precinct 321 (part) | 6,775 | 5,248 | 15.9% | 62.4% | 16.9% | 2.9% | $56k | 43.9% | 24.9% | 7.8% | 19.3% | 23.3% | 59.1% |
| Precinct 333 (part) | 2,160 | 1,705 | 79.5% | 10.2% | 0.2% | 6.3% | $74k | 40.9% | 12.6% | 30.5% | 79.7% | 13.4% | 9.6% |
| Precinct 334 | 6,472 | 5,033 | 77.7% | 11.9% | 1.1% | 2.0% | $113k | 56.2% | 9.3% | 21.4% | 87.2% | 7.8% | 10.2% |
| Precinct 339 | 4,139 | 3,346 | 24.7% | 61.4% | 9.4% | 2.4% | $81k | 24.5% | 29.9% | 10.4% | 48.5% | 24.1% | 54.5% |
| Precinct 341 (part) | 6,107 | 5,011 | 20.8% | 60.0% | 15.4% | 1.5% | $87k | 15.3% | 19.1% | 17.4% | 72.0% | 7.2% | 45.7% |
| Precinct 343 (part) | 3,506 | 2,813 | 24.0% | 52.9% | 12.0% | 9.4% | $89k | 53.7% | 23.3% | 8.7% | 45.8% | 6.3% | 43.9% |
| Precinct 405 | 7,209 | 5,300 | 37.7% | 50.6% | 4.9% | 1.3% | $133k | 54.1% | 14.7% | 4.6% | 60.3% | 8.6% | 45.3% |
| Precinct 416 | 8,334 | 5,881 | 36.9% | 42.3% | 8.1% | 5.3% | $122k | 55.6% | 13.0% | 7.1% | 73.3% | 6.6% | 35.2% |
| Precinct 417 | 6,060 | 4,720 | 33.3% | 53.2% | 2.2% | 9.1% | $110k | 57.3% | 24.2% | 5.0% | 68.5% | 6.2% | 37.0% |
| Precinct 418 | 4,213 | 2,970 | 33.9% | 43.3% | 8.7% | 6.0% | $120k | 57.2% | 13.5% | 7.6% | 72.4% | 6.4% | 35.4% |
| Precinct 419 | 1,982 | 1,391 | 42.8% | 46.0% | 5.1% | 1.0% | $138k | 48.1% | 7.2% | 5.0% | 71.7% | 11.2% | 44.7% |
| Precinct 420 | 13,279 | 9,198 | 17.9% | 65.5% | 8.7% | 6.1% | $117k | 50.0% | 17.8% | 6.2% | 83.5% | 1.7% | 57.7% |
| Precinct 425 (part) | 872 | 692 | 12.9% | 67.9% | 11.8% | 3.6% | $70k | 28.4% | 18.3% | 14.9% | 52.8% | 23.9% | 58.1% |
| Precinct 426 | 13,143 | 9,976 | 16.4% | 60.5% | 11.5% | 8.7% | $104k | 44.9% | 19.3% | 12.1% | 81.8% | 7.4% | 51.0% |
| Precinct 427 | 4,762 | 3,782 | 12.4% | 69.7% | 7.3% | 9.5% | $110k | 50.2% | 21.8% | 11.7% | 77.4% | 7.9% | 64.1% |
| Precinct 428 | 6,120 | 4,769 | 3.9% | 59.0% | 28.0% | 6.7% | $68k | 26.4% | 10.8% | 15.4% | 64.7% | 7.0% | 59.4% |
| Precinct 429 | 7,957 | 6,384 | 20.8% | 63.2% | 6.0% | 5.7% | $78k | 30.3% | 15.2% | 12.5% | 80.0% | 7.1% | 58.3% |
| Precinct 430 | 9,368 | 6,401 | 29.1% | 41.5% | 6.4% | 14.6% | $144k | 64.2% | 16.5% | 8.6% | 65.8% | 2.5% | 32.6% |
| Precinct 431 | 8,558 | 6,270 | 42.7% | 33.0% | 6.2% | 11.8% | $98k | 49.3% | 12.1% | 16.9% | 63.1% | 1.7% | 29.1% |
| Precinct 432 | 10,969 | 8,162 | 27.4% | 56.9% | 4.6% | 4.2% | $127k | 58.2% | 22.6% | 7.3% | 62.8% | 3.5% | 51.0% |
Highlands: 25 precincts
| Precinct | Population | Voting-age pop. | % White non-Hisp. | % Hispanic | % Black | % Asian | Median income* | % Bachelor's+ | % 18-29 (of adults) | % 65+ | % Homeowners | % Below poverty | % Spanish at home (adults) |
|---|---|---|---|---|---|---|---|---|---|---|---|---|---|
| 1 | 2,975 | 2,498 | 43.0% | 43.0% | 8.7% | 0.0% | $45k | 7.7% | 16.5% | 25.4% | 61.7% | 21.8% | 41.4% |
| 10 | 4,104 | 3,510 | 57.2% | 27.1% | 10.3% | 0.2% | $60k | 25.0% | 10.0% | 43.3% | 79.4% | 12.2% | 20.9% |
| 11 | 3,681 | 3,074 | 71.4% | 12.4% | 5.0% | 0.2% | $50k | 13.5% | 13.4% | 29.0% | 84.5% | 28.2% | 10.7% |
| 12 | 1,601 | 1,382 | 73.2% | 26.0% | 0.2% | 0.0% | $64k | 13.9% | 4.2% | 39.3% | 76.6% | 23.1% | 15.6% |
| 13 | 6,694 | 5,414 | 64.4% | 24.4% | 7.4% | 0.2% | $70k | 21.3% | 12.7% | 30.8% | 81.6% | 10.4% | 21.2% |
| 14 | 508 | 426 | 77.5% | 17.2% | 1.4% | 0.0% | $54k | 16.6% | 9.0% | 29.3% | 82.1% | 19.7% | 19.0% |
| 15 | 6,980 | 5,564 | 78.6% | 10.8% | 5.9% | 2.3% | $67k | 25.2% | 19.0% | 28.3% | 84.3% | 8.5% | 6.8% |
| 16 | 6,544 | 5,515 | 48.7% | 31.7% | 14.7% | 3.6% | $58k | 14.9% | 12.9% | 28.1% | 85.8% | 12.2% | 27.4% |
| 17 | 9,080 | 7,454 | 81.6% | 10.3% | 1.4% | 1.8% | $58k | 22.6% | 7.5% | 41.2% | 84.6% | 12.9% | 8.6% |
| 18 | 456 | 387 | 97.5% | 1.9% | 0.2% | 0.0% | $37k | 7.4% | 0.9% | 63.4% | 99.6% | 10.4% | 1.9% |
| 19 | 5,524 | 4,832 | 57.0% | 30.1% | 7.5% | 0.5% | $48k | 17.3% | 10.3% | 42.0% | 81.3% | 18.7% | 26.5% |
| 2 | 5,070 | 4,335 | 39.2% | 29.0% | 29.6% | 0.4% | $39k | 10.9% | 18.8% | 30.4% | 54.5% | 24.3% | 25.8% |
| 20 | 2,665 | 2,409 | 79.9% | 16.9% | 1.6% | 1.2% | $69k | 21.4% | 10.6% | 48.8% | 87.6% | 13.4% | 12.3% |
| 21 | 4,490 | 3,604 | 84.1% | 9.8% | 1.1% | 1.0% | $83k | 22.7% | 11.3% | 32.3% | 78.6% | 11.3% | 10.6% |
| 22 | 1,233 | 870 | 49.9% | 15.6% | 29.8% | 2.6% | $49k | 19.3% | 11.1% | 28.9% | 71.2% | 16.7% | 3.4% |
| 23 | 2,632 | 2,021 | 48.2% | 26.6% | 24.4% | 0.0% | $45k | 15.3% | 12.0% | 26.2% | 55.9% | 35.8% | 16.2% |
| 24 | 1,669 | 1,553 | 78.9% | 13.8% | 4.2% | 0.0% | $44k | 21.0% | 11.0% | 57.4% | 76.8% | 24.1% | 7.1% |
| 25 | 4,158 | 3,507 | 65.1% | 20.9% | 5.6% | 1.1% | $56k | 23.6% | 9.4% | 41.9% | 85.1% | 12.3% | 13.2% |
| 3 | 3,767 | 2,952 | 50.5% | 20.5% | 10.9% | 0.6% | $49k | 24.1% | 14.4% | 32.2% | 85.0% | 15.9% | 14.7% |
| 4 | 2,241 | 1,848 | 59.8% | 27.8% | 6.3% | 4.7% | $55k | 20.0% | 10.6% | 41.0% | 84.2% | 16.1% | 22.1% |
| 5 | 7,046 | 5,899 | 64.0% | 29.1% | 3.9% | 0.0% | $63k | 24.4% | 13.1% | 36.1% | 87.4% | 13.4% | 20.9% |
| 6 | 4,656 | 3,867 | 63.8% | 10.5% | 22.7% | 1.3% | $56k | 19.7% | 6.6% | 49.1% | 84.7% | 11.2% | 6.1% |
| 7 | 1,628 | 1,279 | 39.6% | 30.2% | 29.2% | 0.0% | $39k | 19.3% | 14.0% | 23.8% | 40.5% | 28.2% | 19.0% |
| 8 | 3,533 | 2,951 | 62.0% | 26.0% | 6.1% | 2.1% | $56k | 17.1% | 12.6% | 25.9% | 52.3% | 21.7% | 21.3% |
| 9 | 66 | 48 | 40.4% | 11.1% | 43.5% | 4.1% | $41k | 10.7% | 11.7% | 28.7% | 59.2% | 22.1% | 0.5% |
Okeechobee: 11 precincts
| Precinct | Population | Voting-age pop. | % White non-Hisp. | % Hispanic | % Black | % Asian | Median income* | % Bachelor's+ | % 18-29 (of adults) | % 65+ | % Homeowners | % Below poverty | % Spanish at home (adults) |
|---|---|---|---|---|---|---|---|---|---|---|---|---|---|
| P-01 | 3,152 | 2,379 | 80.3% | 14.6% | 2.8% | 0.1% | $84k | 18.9% | 19.6% | 10.3% | 82.6% | 7.9% | 11.4% |
| P-02 | 2,156 | 1,670 | 86.6% | 12.4% | 0.3% | 0.0% | $53k | 13.9% | 14.6% | 22.1% | 68.8% | 18.0% | 11.6% |
| P-03 | 3,610 | 2,898 | 80.6% | 15.5% | 0.2% | 2.4% | $71k | 26.3% | 20.1% | 17.1% | 89.6% | 12.9% | 11.1% |
| P-04 | 5,660 | 4,228 | 37.3% | 50.0% | 8.7% | 0.8% | $67k | 13.5% | 26.1% | 10.5% | 66.3% | 16.5% | 35.2% |
| P-05 | 2,351 | 2,097 | 89.4% | 6.8% | 0.6% | 0.4% | $42k | 4.7% | 7.8% | 45.9% | 91.3% | 19.6% | 2.9% |
| P-06 | 3,939 | 3,031 | 52.3% | 32.4% | 9.7% | 0.7% | $59k | 21.8% | 17.9% | 18.3% | 58.6% | 14.3% | 21.8% |
| P-07 | 3,078 | 2,283 | 28.4% | 20.7% | 42.5% | 0.5% | $36k | 13.2% | 23.2% | 14.2% | 49.3% | 41.6% | 17.5% |
| P-08 | 7,567 | 5,983 | 70.4% | 21.8% | 1.8% | 0.7% | $50k | 12.5% | 11.5% | 30.4% | 70.1% | 15.6% | 14.0% |
| P-09 | 4,137 | 2,928 | 49.6% | 48.3% | 0.6% | 0.1% | $55k | 19.9% | 27.1% | 11.0% | 84.8% | 25.7% | 43.3% |
| P-10 | 3,412 | 2,985 | 53.9% | 19.6% | 17.8% | 1.0% | $69k | 13.0% | 17.4% | 13.4% | 69.1% | 25.3% | 10.2% |
| P-11 | 1,857 | 1,698 | 88.3% | 10.3% | 0.3% | 0.2% | $72k | 20.1% | 4.6% | 40.0% | 82.9% | 8.4% | 11.4% |
Glades: 13 precincts
| Precinct | Population | Voting-age pop. | % White non-Hisp. | % Hispanic | % Black | % Asian | Median income* | % Bachelor's+ | % 18-29 (of adults) | % 65+ | % Homeowners | % Below poverty | % Spanish at home (adults) |
|---|---|---|---|---|---|---|---|---|---|---|---|---|---|
| 1-Voting District | 954 | 763 | 37.1% | 62.3% | 0.0% | 0.0% | $85k | 16.9% | 5.0% | 40.0% | 70.0% | 16.9% | 51.1% |
| 10-Voting District | 434 | 329 | 29.5% | 8.1% | 3.7% | 0.0% | $35k | 6.3% | 22.3% | 16.9% | 83.5% | 33.6% | 7.9% |
| 11-Voting District | 2,278 | 2,109 | 43.5% | 12.0% | 42.3% | 0.4% | $40k | 10.4% | 14.9% | 13.6% | 90.8% | 12.2% | 8.8% |
| 12-Voting District | 11 | 10 | 52.4% | 11.0% | 33.6% | 0.3% | $38k | 9.3% | 16.5% | 15.6% | 88.9% | 18.4% | 8.8% |
| 13-Voting District | 361 | 302 | 54.3% | 44.1% | 0.4% | 0.0% | $93k | 18.2% | 6.3% | 38.8% | 83.3% | 10.8% | 34.4% |
| 2-Voting District | 866 | 789 | 87.9% | 9.2% | 0.5% | 0.0% | $103k | 20.6% | 7.5% | 37.9% | 99.9% | 0.1% | 6.2% |
| 3-Voting District | 338 | 297 | 44.7% | 47.3% | 2.2% | 0.0% | $98k | 2.2% | 18.6% | 15.6% | 96.1% | 8.0% | 34.0% |
| 4-Voting District | 212 | 208 | 98.0% | 1.1% | 0.4% | 0.0% | $40k | 2.8% | 1.4% | 50.4% | 99.3% | 1.8% | 0.9% |
| 5-Voting District | 2,794 | 2,319 | 47.2% | 48.6% | 2.6% | 0.0% | $61k | 17.1% | 21.3% | 20.7% | 90.4% | 12.9% | 45.1% |
| 6-Voting District | 1,604 | 1,299 | 20.3% | 31.2% | 45.9% | 0.2% | $31k | 5.2% | 25.0% | 16.1% | 71.5% | 32.2% | 25.5% |
| 7-Voting District | 645 | 514 | 85.5% | 3.9% | 4.9% | 0.0% | $37k | 7.4% | 17.1% | 24.9% | 89.7% | 23.2% | 5.0% |
| 8-Voting District | 1,689 | 1,624 | 93.4% | 1.5% | 0.0% | 2.7% | $35k | 17.2% | 6.1% | 43.5% | 82.0% | 18.9% | 2.9% |
| 9-Voting District | 381 | 341 | 76.8% | 2.7% | 1.2% | 0.0% | $33k | 19.4% | 8.4% | 35.7% | 75.9% | 26.8% | 3.2% |
Polk: 5 precincts
| Precinct | Population | Voting-age pop. | % White non-Hisp. | % Hispanic | % Black | % Asian | Median income* | % Bachelor's+ | % 18-29 (of adults) | % 65+ | % Homeowners | % Below poverty | % Spanish at home (adults) |
|---|---|---|---|---|---|---|---|---|---|---|---|---|---|
| 533 (part) | 422 | 370 | 68.6% | 27.6% | 2.0% | 0.0% | $47k | 16.9% | 8.0% | 41.2% | 56.0% | 21.9% | 23.6% |
| 536 (part) | 798 | 733 | 88.1% | 4.5% | 4.6% | 0.0% | $64k | 27.2% | 23.5% | 30.4% | 87.2% | 10.6% | 6.9% |
| 537 | 6,117 | 5,351 | 63.4% | 23.6% | 10.0% | 0.0% | $58k | 16.6% | 17.2% | 27.6% | 78.4% | 21.2% | 16.8% |
| 539 | 2,234 | 1,934 | 76.3% | 7.4% | 10.2% | 0.4% | $58k | 15.7% | 8.8% | 46.7% | 77.4% | 24.9% | 4.9% |
| 540 | 2,943 | 2,648 | 68.9% | 9.5% | 15.8% | 0.0% | $64k | 7.9% | 10.8% | 27.9% | 83.2% | 17.8% | 9.1% |
*Median income is approximate (see note above). ACS 2020-2024 5-year.
Nonpartisan voter information. GOTV Polling does not endorse any candidate.