
Florida's 17th Congressional District
U.S. House · Florida · District 17 · General election: Tuesday, November 3, 2026
Candidates on the November 3 ballot
- Matthew MontavonDemocratic
- Michael J. QuirkNo Party Affiliation
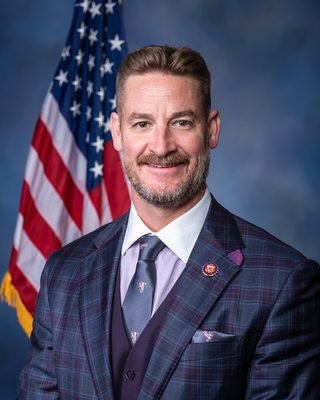 Greg SteubeRepublicanIncumbentPhoto: U.S. Congress
Source: Florida Department of State, Division of Elections, candidate listing (status: Qualified), certified list (qualifying closed 2026-06-12; primary 2026-08-18; retrieved 2026-10-30). Write-in candidates appear because the Division lists them as qualified write-in candidates. Order of names does not reflect ballot order. Incumbent tags appear only where the official list marks incumbents. Photos come from the Candidate Alerts database where one is on file; otherwise initials are shown.
Federal campaign finance filings for this seat: FEC election page (FEC registration is not the same as ballot qualification).
Certified candidates
- W. Gregory Steube RepublicanIncumbent @RepGregSteube
- Matthew Montavon Democratic
- Michael J. Quirk Independent
Certified candidate list from Candidate Alerts, as of 2026-09-24, based on Florida Department of State, Division of Elections; Florida Division of Elections. Includes candidates the database marks as on the November 3 ballot. Incumbent tags here follow the database.
Past election results
Held under the district lines in effect at the time. Those boundaries differ from the 2026 district.
| Candidate | Party | Votes | Share |
|---|---|---|---|
| Greg Steube | Republican | 291,347 | 63.9% |
| Manny Lopez | Democratic | 164,566 | 36.1% |
| Write-in | 384 | 0.1% | |
| Total | 456,297 |
Source: Florida Department of State, Division of Elections, Precinct-Level Election Results. Status: Official results (Florida Division of Elections precinct-level file, compiled from county SOE submissions)
Held under the district lines in effect at the time. Those boundaries differ from the 2026 district.
| Candidate | Party | Votes | Share |
|---|---|---|---|
| Greg Steube | Republican | 222,483 | 63.8% |
| Andrea Doria Kale | Democratic | 123,798 | 35.5% |
| Theodore "Pink Tie" Murray | NPA | 2,225 | 0.6% |
| Total | 348,506 |
Source: Florida Department of State, Division of Elections, Precinct-Level Election Results. Status: Official results (Florida Division of Elections precinct-level file, compiled from county SOE submissions)
Held under the district lines in effect at the time. Those boundaries differ from the 2026 district.
| Candidate | Party | Votes | Share |
|---|---|---|---|
| Greg Steube | Republican | 266,514 | 64.6% |
| Allen Ellison | Democratic | 140,487 | 34.1% |
| Theodore "Pink Tie" Murray | NPA | 5,396 | 1.3% |
| Total | 412,397 |
Source: Florida Department of State, Division of Elections, Precinct-Level Election Results. Status: Official results (Florida Division of Elections precinct-level file, compiled from county SOE submissions)
Certified results from state or county election authorities, as compiled in the Candidate Alerts precinct results database (public API candidatealerts.com/api/district-results). Totals are sums of certified precinct and county-level rows.
Demographics
2020 Census demographics by district are not yet published in this data set.
0 of 184 precincts are above 50%, and 8 are above 25%. Source: Census American Community Survey 2020-2024 5-year block groups, allocated to current precinct shapes by area.
Poll status
Map
Share of adults (18+) who speak Spanish at home, by precinct. Census ACS 2020-2024 5-year estimates on the current precinct layer. Hover a precinct for its value.
Florida votes on new congressional district lines in 2026. The Census 119th Congress boundary file does not reflect the new lines, so only the state outline is shown here.
Precinct map: past elections and demographics
Choose a layer above. Hover a precinct for its values.
Precinct results
Certified precinct results on current precinct shapes, grouped by county. 248 precincts. "(part)" marks a precinct only partly inside this district; its full vote is shown, so district sums are approximate and are not the official district total. Elections were held under older lines and are shown on the 2026 district.
| County | 2024 President | 2022 Governor | 2020 President | |||
|---|---|---|---|---|---|---|
| Margin | Votes | Margin | Votes | Margin | Votes | |
| Sarasota | R+16.5 | 249,272 | R+20.6 | 197,430 | R+8.8 | 243,966 |
| Charlotte | R+33.9 | 124,118 | R+41.4 | 92,706 | R+26.6 | 116,513 |
| Lee | R+22.2 | 96,778 | R+32.3 | 66,018 | R+12.7 | 108,572 |
| All counties (approx.) | R+22.2 | 470,168 | R+28.2 | 356,154 | R+14.2 | 469,051 |
Sarasota: 93 precincts
| Precinct | 2024 President | 2022 Governor | 2020 President | |||
|---|---|---|---|---|---|---|
| Margin | Votes | Margin | Votes | Margin | Votes | |
| 101 | D+42.9 | 84 | D+41.9 | 62 | D+51.2 | 86 |
| 101 | D+29.8 | 1,806 | D+33.0 | 1,587 | D+41.5 | 1,910 |
| 101 | D+34.1 | 458 | D+41.4 | 423 | D+48.9 | 659 |
| 103 | D+28.7 | 1,858 | D+21.9 | 1,213 | D+42.3 | 2,091 |
| 105 | R+7.3 | 5,451 | R+10.9 | 4,223 | R+0.7 | 5,528 |
| 113 | R+24.4 | 406 | R+29.5 | 373 | R+18.4 | 441 |
| 115 | D+49.0 | 3,254 | D+50.3 | 2,090 | D+61.3 | 3,926 |
| 117 | R+14.5 | 1,056 | R+23.1 | 744 | R+14.8 | 1,075 |
| 119 | R+0.3 | 1,880 | D+2.2 | 1,288 | D+15.9 | 2,121 |
| 121 | D+10.8 | 3,014 | D+2.3 | 2,795 | D+9.7 | 3,126 |
| 123 | D+10.3 | 1,479 | D+3.9 | 988 | D+17.6 | 1,701 |
| 123 | D+0.0 | 1,211 | D+0.5 | 868 | D+17.3 | 985 |
| 125 | D+6.9 | 2,472 | D+4.9 | 1,984 | D+15.2 | 2,964 |
| 127 | R+17.6 | 6,326 | R+21.4 | 4,877 | R+11.2 | 6,534 |
| 131 | R+20.1 | 437 | R+19.0 | 378 | R+8.8 | 478 |
| 201 | R+10.1 | 3,775 | R+15.8 | 3,572 | R+1.7 | 3,902 |
| 203 | D+0.1 | 2,146 | R+3.1 | 1,853 | D+10.2 | 2,005 |
| 205 | D+17.3 | 683 | D+13.1 | 609 | D+24.9 | 646 |
| 205 | D+12.9 | 832 | D+7.8 | 566 | D+20.0 | 744 |
| 209 | D+16.6 | 3,946 | D+10.8 | 3,370 | D+23.6 | 4,050 |
| 211 | R+10.8 | 1,150 | R+16.1 | 1,081 | R+1.6 | 1,264 |
| 211 | R+8.7 | 1,007 | R+16.0 | 891 | R+9.0 | 1,037 |
| 215 | D+4.8 | 2,745 | D+0.8 | 2,065 | D+12.0 | 3,080 |
| 217 | R+11.8 | 838 | R+15.7 | 702 | R+8.0 | 961 |
| 217 | R+9.1 | 4,007 | R+11.2 | 3,406 | R+3.1 | 4,339 |
| 221 | R+20.2 | 6,152 | R+26.0 | 4,604 | R+13.0 | 6,634 |
| 223 | D+1.2 | 1,604 | R+4.3 | 1,398 | D+6.5 | 1,660 |
| 223 | D+3.3 | 909 | D+4.4 | 742 | D+12.5 | 1,027 |
| 227 | D+2.5 | 2,452 | D+2.5 | 1,971 | D+10.6 | 2,677 |
| 227 | R+11.2 | 2,652 | R+16.6 | 2,074 | R+6.5 | 2,852 |
| 231 | R+11.0 | 6,337 | R+12.6 | 5,185 | R+5.6 | 6,880 |
| 301 (part) | R+29.9 | 2,470 | R+33.9 | 1,642 | R+16.6 | 1,344 |
| 305 | R+20.0 | 3,045 | R+25.2 | 2,632 | R+12.8 | 2,926 |
| 305 | R+14.4 | 2,458 | R+14.4 | 1,950 | R+11.1 | 2,478 |
| 307 (part) | R+26.3 | 5,733 | R+32.3 | 4,685 | R+23.6 | 5,290 |
| 309 (part) | R+40.6 | 3,601 | R+42.1 | 2,247 | R+30.4 | 3,164 |
| 309 (part) | R+43.4 | 3,945 | R+44.7 | 4,938 | R+29.7 | 6,780 |
| 309 (part) | R+36.4 | 3,407 | - | - | - | - |
| 313 (part) | R+34.1 | 6,652 | R+42.9 | 7,413 | R+26.3 | 9,719 |
| 313 (part) | R+41.3 | 5,233 | - | - | - | - |
| 315 | R+29.5 | 1,471 | R+35.2 | 1,234 | R+22.7 | 1,506 |
| 317 | R+34.8 | 2,370 | R+39.5 | 1,485 | R+25.7 | 2,223 |
| 321 | R+22.5 | 4,541 | R+28.6 | 3,890 | R+20.0 | 4,088 |
| 323 | R+35.0 | 849 | R+44.4 | 728 | R+28.2 | 981 |
| 325 | R+53.5 | 650 | R+65.0 | 469 | R+53.4 | 646 |
| 327 | R+24.9 | 3,532 | R+32.3 | 2,898 | R+19.5 | 3,700 |
| 329 | R+32.8 | 2,432 | R+39.6 | 1,639 | R+24.7 | 2,465 |
| 329 | R+30.7 | 2,466 | R+30.0 | 1,637 | R+18.7 | 2,557 |
| 331 | R+38.7 | 4,556 | R+42.9 | 2,955 | R+28.2 | 4,351 |
| 333 | R+19.4 | 654 | R+24.8 | 601 | R+15.7 | 654 |
| 335 | R+25.9 | 889 | R+38.7 | 798 | R+23.9 | 975 |
| 337 | R+27.0 | 659 | R+30.8 | 629 | R+22.8 | 742 |
| 341 | R+15.1 | 403 | R+13.4 | 373 | R+3.4 | 494 |
| 401 | R+25.0 | 312 | R+23.3 | 301 | R+9.3 | 388 |
| 401 | R+19.4 | 922 | R+20.6 | 838 | R+5.5 | 1,046 |
| 405 | R+1.6 | 4,577 | R+4.6 | 3,784 | D+2.7 | 4,878 |
| 407 | R+7.6 | 3,699 | R+11.2 | 2,773 | R+1.5 | 3,921 |
| 409 | R+17.2 | 4,435 | R+22.0 | 3,470 | R+10.9 | 4,631 |
| 411 | R+22.3 | 2,967 | R+27.1 | 2,671 | R+11.8 | 3,348 |
| 411 | R+11.9 | 1,085 | R+16.4 | 957 | R+6.9 | 1,181 |
| 413 | R+10.8 | 4,773 | R+15.0 | 3,985 | R+4.7 | 5,161 |
| 415 | R+7.5 | 4,662 | R+12.7 | 4,067 | R+5.1 | 4,830 |
| 417 | R+6.2 | 4,875 | R+15.9 | 6,791 | R+4.5 | 7,960 |
| 417 | R+8.0 | 4,919 | R+1.9 | 1,232 | D+5.2 | 1,666 |
| 423 | R+0.1 | 3,718 | R+3.0 | 3,051 | D+4.6 | 4,007 |
| 427 | R+13.4 | 67 | R+49.2 | 63 | R+31.1 | 61 |
| 427 | R+22.6 | 381 | R+38.1 | 341 | R+21.8 | 408 |
| 429 | R+13.5 | 3,100 | R+20.6 | 2,820 | R+10.1 | 1,922 |
| 430 | R+20.2 | 3,185 | - | - | R+14.1 | 1,343 |
| 431 (part) | R+31.2 | 3,277 | R+36.9 | 2,442 | R+25.3 | 2,735 |
| 433 | R+18.2 | 1,162 | R+27.3 | 997 | R+12.9 | 1,117 |
| 437 | R+40.3 | 670 | R+41.6 | 433 | R+38.6 | 588 |
| 501 | R+18.2 | 3,515 | R+25.0 | 5,312 | R+15.6 | 2,177 |
| 505 | R+31.7 | 1,626 | R+33.8 | 1,386 | R+25.7 | 1,655 |
| 507 | R+26.3 | 3,127 | R+34.5 | 2,626 | R+22.0 | 3,181 |
| 509 | R+24.2 | 1,263 | R+28.4 | 964 | R+16.3 | 1,306 |
| 511 | R+12.6 | 2,594 | R+18.7 | 2,371 | R+7.0 | 2,602 |
| 513 | R+0.7 | 734 | R+2.4 | 616 | D+7.0 | 717 |
| 515 | R+16.3 | 1,273 | R+22.6 | 1,099 | R+13.7 | 1,390 |
| 519 | R+4.9 | 2,184 | R+9.6 | 1,963 | R+0.8 | 2,222 |
| 521 | R+6.4 | 1,033 | R+14.4 | 914 | R+11.0 | 1,089 |
| 523 | R+13.9 | 977 | R+19.9 | 866 | R+8.9 | 1,035 |
| 525 | R+19.1 | 2,366 | R+24.0 | 2,284 | R+15.7 | 2,446 |
| 527 | R+29.0 | 2,111 | R+30.9 | 3,734 | R+19.2 | 4,649 |
| 529 | R+28.6 | 3,268 | R+32.9 | 2,598 | R+22.1 | 3,481 |
| 531 | R+21.2 | 1,040 | R+22.8 | 823 | R+15.4 | 1,086 |
| 533 | R+29.4 | 2,295 | R+32.6 | 1,753 | R+21.6 | 2,388 |
| 535 | R+19.7 | 6,484 | R+23.7 | 5,539 | R+14.6 | 6,665 |
| 537 | R+28.6 | 4,213 | R+34.7 | 3,262 | R+23.4 | 4,444 |
| 537 | R+24.8 | 4,382 | R+32.9 | 3,884 | R+22.8 | 4,006 |
| 541 | R+30.8 | 8,423 | R+37.1 | 6,018 | R+21.2 | 5,500 |
| 543 | R+23.8 | 3,596 | R+30.1 | 1,197 | R+20.9 | 1,357 |
| 545 | R+24.0 | 5,539 | R+30.6 | 4,380 | R+21.1 | 4,913 |
Charlotte: 98 precincts
| Precinct | 2024 President | 2022 Governor | 2020 President | |||
|---|---|---|---|---|---|---|
| Margin | Votes | Margin | Votes | Margin | Votes | |
| 1 - East Elementary School | R+37.4 | 454 | R+46.5 | 357 | R+30.4 | 467 |
| 10 - Port Charlotte Middle Sch | R+28.1 | 755 | R+31.9 | 476 | R+16.5 | 823 |
| 11 - Myakka River Elementary S | R+49.2 | 1,990 | R+52.1 | 1,399 | R+39.4 | 1,702 |
| 12 - Deep Creek Elementary Sch | R+37.7 | 2,552 | R+43.2 | 1,834 | R+27.0 | 2,356 |
| 13 - East Elementary School | R+55.0 | 1,703 | R+58.7 | 1,262 | R+47.4 | 1,585 |
| 14 - Home Owners of Alligator | R+39.1 | 1,738 | R+44.8 | 1,376 | R+34.4 | 1,821 |
| 14.1 - Home Owners of Alligato | - | 0 | - | - | - | - |
| 14.1 - Homeowners of Alligator | - | - | R+100.0 | 2 | - | - |
| 15 - Meadow Park Elementary Sc | R+33.8 | 1,873 | R+38.5 | 1,355 | R+26.7 | 1,971 |
| 16 - Peace River Elementary Sc | R+21.6 | 783 | R+22.7 | 490 | R+8.4 | 910 |
| 17 - Port Charlotte Middle Sch | R+12.8 | 1,107 | R+22.9 | 869 | R+6.8 | 1,470 |
| 18 - Mac V. Horton West County | R+36.6 | 1,469 | R+41.7 | 1,130 | R+29.9 | 1,527 |
| 19 - Charlotte Harbor Event an | R+71.1 | 45 | R+34.2 | 76 | R+16.8 | 814 |
| 19.1 - Charlotte Harbor Event | R+15.5 | 699 | - | - | - | - |
| 19.1 - Charlotte Harbor Event | - | - | R+22.8 | 496 | - | - |
| 19.2 - Charlotte Harbor Event | R+23.1 | 39 | - | - | - | - |
| 19.2 - Charlotte Harbor Event | - | - | R+39.4 | 33 | - | - |
| 2 - East Elementary School | R+39.3 | 473 | R+44.0 | 411 | R+31.4 | 564 |
| 20 - Meadow Park Elementary Sc | R+39.6 | 1,412 | R+41.1 | 1,062 | R+31.3 | 1,573 |
| 21 - Meadow Park Elementary Sc | R+27.0 | 968 | R+29.5 | 677 | R+19.5 | 957 |
| 22 - Port Charlotte Middle Sch | R+28.0 | 3,033 | R+31.7 | 2,096 | R+19.0 | 2,991 |
| 23 - Mac V. Horton West County | R+28.1 | 761 | R+45.3 | 698 | R+23.9 | 858 |
| 24 - Peace River Elementary Sc | R+24.4 | 1,337 | R+32.8 | 949 | R+16.9 | 1,450 |
| 25 - Liberty Elementary School | R+25.0 | 1,919 | R+34.5 | 980 | R+21.3 | 1,453 |
| 26 - Centennial Park Recreatio | R+36.3 | 965 | R+48.9 | 542 | R+15.5 | 843 |
| 27 - Mac V. Horton West County | R+27.6 | 2,314 | R+37.0 | 1,980 | R+24.2 | 2,574 |
| 28 - Charlotte Harbor Event an | R+39.3 | 1,833 | R+47.5 | 1,643 | R+32.2 | 1,899 |
| 29 - Punta Gorda Isles Civic A | R+39.7 | 1,009 | R+46.3 | 947 | R+37.2 | 3,219 |
| 29.1 - Punta Gorda Isles Civic | R+37.8 | 1,348 | - | - | - | - |
| 29.1 - Punta Gorda Isles Civic | - | - | R+45.1 | 1,256 | - | - |
| 29.2 - Punta Gorda Isles Civic | R+50.1 | 722 | - | - | - | - |
| 29.2 - Punta Gorda Isles Civic | - | - | R+57.9 | 665 | - | - |
| 3 - Charlotte Harbor Event and | R+12.5 | 32 | R+36.8 | 19 | D+4.9 | 492 |
| 3.1 - Charlotte Harbor Event a | D+10.7 | 384 | - | - | - | - |
| 3.1 - Charlotte Harbor Event a | - | - | R+3.1 | 288 | - | - |
| 30 - East Elementary School | R+47.1 | 819 | R+50.3 | 646 | R+41.5 | 857 |
| 31 - East Elementary School | R+57.4 | 2,464 | R+59.8 | 1,656 | R+48.5 | 2,330 |
| 32 - Babcock Ranch Field House | R+29.6 | 4,668 | R+41.8 | 2,092 | R+27.9 | 1,341 |
| 33 - Myakka River Elementary S | R+36.1 | 1,633 | R+42.4 | 1,211 | R+26.0 | 1,636 |
| 34 - Isles Yacht Club | R+26.1 | 1,423 | R+38.9 | 1,394 | R+28.0 | 1,588 |
| 35 - Punta Gorda Isles Civic A | R+45.7 | 453 | R+46.7 | 368 | R+26.7 | 890 |
| 35.1 - Punta Gorda Isles Civic | R+23.7 | 380 | - | - | - | - |
| 35.1 - Punta Gorda Isles Civic | - | - | R+44.0 | 325 | - | - |
| 36 - Peace River Elementary Sc | R+23.8 | 1,880 | R+28.6 | 1,299 | R+9.2 | 1,860 |
| 36.1 - Peace River Elementary | D+100.0 | 1 | - | - | - | - |
| 38 - Port Charlotte Middle Sch | R+16.8 | 1,791 | R+25.1 | 1,240 | R+8.2 | 1,813 |
| 39 - Liberty Elementary School | R+24.6 | 1,969 | R+32.3 | 1,288 | R+15.2 | 1,972 |
| 4 - Charlotte Harbor Event and | R+30.5 | 331 | R+39.4 | 312 | R+19.0 | 347 |
| 41 - Isles Yacht Club | R+37.3 | 1,695 | R+50.3 | 1,574 | R+35.6 | 1,736 |
| 41.1 - Isles Yacht Club | - | - | - | 0 | - | - |
| 42 - South Punta Gorda Heights | R+49.7 | 1,320 | R+53.5 | 884 | R+36.3 | 2,860 |
| 42.1 - South Punta Gorda Heigh | R+37.4 | 1,676 | - | - | - | - |
| 42.1 - South Punta Gorda Heigh | - | - | R+46.0 | 1,453 | - | - |
| 43 - Meadow Park Elementary Sc | R+26.7 | 2,030 | R+33.9 | 1,441 | R+15.7 | 2,059 |
| 44 - Meadow Park Elementary Sc | R+38.0 | 3,370 | R+45.1 | 2,659 | R+29.8 | 3,345 |
| 45 - Tringali Community Center | R+36.9 | 2,276 | R+42.6 | 1,768 | R+29.9 | 2,292 |
| 46 - Holy Trinity Greek Orthod | R+21.7 | 2,933 | R+34.4 | 2,395 | R+21.9 | 2,853 |
| 47 - L.A. Ainger Middle School | R+34.8 | 5,975 | R+41.8 | 4,874 | R+29.1 | 5,497 |
| 48 - Deep Creek Elementary Sch | R+23.4 | 2,104 | R+28.4 | 1,597 | R+15.2 | 2,115 |
| 49 - Deep Creek Elementary Sch | R+27.5 | 1,391 | R+36.9 | 1,018 | R+18.9 | 1,277 |
| 5 - Peace River Elementary Sch | R+19.5 | 1,583 | R+34.7 | 1,186 | R+14.7 | 1,578 |
| 52 - Centennial Park Recreatio | R+30.5 | 2,801 | R+37.9 | 1,985 | R+22.0 | 2,800 |
| 53 - Tringali Community Center | R+41.6 | 1,861 | R+50.3 | 1,311 | R+35.5 | 1,732 |
| 54 - Liberty Elementary School | R+28.3 | 452 | R+38.7 | 302 | R+22.3 | 399 |
| 54.1 - Liberty Elementary Scho | R+5.4 | 627 | - | - | R+15.5 | 679 |
| 54.1 - Mid-County Regional Lib | - | - | R+25.5 | 560 | - | - |
| 55 - American Legion Post #113 | R+32.0 | 2,519 | R+44.1 | 2,133 | R+30.1 | 2,522 |
| 56 - Holy Trinity Greek Orthod | R+19.9 | 1,253 | R+23.5 | 1,293 | R+5.6 | 1,849 |
| 56.1 - Holy Trinity Greek Orth | R+17.7 | 610 | - | - | - | - |
| 57 - Meadow Park Elementary Sc | R+35.8 | 520 | R+46.7 | 456 | R+35.5 | 521 |
| 58 - Centennial Park Recreatio | R+39.8 | 4,371 | R+47.3 | 2,172 | R+33.6 | 2,543 |
| 6 - Centennial Park Recreation | R+43.7 | 1,053 | R+45.2 | 817 | R+30.3 | 2,383 |
| 6.1 - Centennial Park Recreati | R+29.9 | 1,359 | - | - | - | - |
| 6.1 - Charlotte County Fairgro | - | - | R+39.0 | 1,283 | - | - |
| 60 - South County Regional Par | R+42.6 | 176 | R+59.4 | 143 | R+26.0 | 519 |
| 60.1 - South County Regional P | R+21.3 | 268 | - | - | - | - |
| 60.1 - South County Regional P | - | - | R+31.6 | 263 | - | - |
| 61 - Myakka River Elementary S | R+41.2 | 1,462 | R+46.3 | 1,100 | R+36.7 | 1,321 |
| 63 - Holy Trinity Greek Orthod | R+22.4 | 4,505 | R+31.2 | 3,446 | R+14.9 | 4,441 |
| 64 - Congregational United Chu | R+35.4 | 3,065 | R+37.9 | 277 | R+32.5 | 3,159 |
| 64.1 - Congregational United C | - | - | R+48.2 | 2,634 | - | - |
| 66 - South County Regional Par | R+34.2 | 1,101 | R+45.7 | 934 | R+24.2 | 1,167 |
| 66.1 - South County Regional P | R+21.4 | 271 | - | - | - | - |
| 66.1 - South County Regional P | - | - | R+29.3 | 75 | - | - |
| 67 - South Punta Gorda Heights | R+46.8 | 282 | R+45.4 | 196 | R+33.2 | 274 |
| 68 - South Punta Gorda Heights | R+46.2 | 2,160 | R+57.2 | 1,358 | R+43.2 | 1,249 |
| 68.1 - Burnt Store Presbyteria | - | - | - | 0 | - | - |
| 68.1 - South Punta Gorda Heigh | R+100.0 | 1 | - | - | - | - |
| 69 - South Punta Gorda Heights | R+50.1 | 984 | R+43.4 | 468 | R+38.5 | 558 |
| 7 - American Legion Post #113 | R+36.8 | 2,775 | R+45.5 | 2,255 | R+30.7 | 2,544 |
| 75 - Port Charlotte Middle Sch | R+22.2 | 2,317 | R+27.5 | 1,780 | R+14.5 | 2,507 |
| 76 - Mid-County Regional Libra | - | - | R+34.9 | 307 | R+13.5 | 550 |
| 77 - L.A. Ainger Middle School | R+50.9 | 5,564 | R+56.7 | 4,024 | R+42.6 | 4,205 |
| 78 - American Legion Post #113 | R+25.1 | 275 | R+46.1 | 256 | R+26.4 | 314 |
| 8 - Mac V. Horton West County | R+35.2 | 894 | R+34.4 | 758 | R+25.6 | 962 |
| 80 - Tringali Community Center | R+39.3 | 1,936 | R+43.4 | 1,422 | R+31.0 | 1,861 |
| 9 - Peace River Elementary Sch | R+40.3 | 559 | R+36.9 | 650 | R+29.1 | 889 |
| 9.1 - Peace River Elementary S | R+13.0 | 215 | - | - | - | - |
Lee: 57 precincts
| Precinct | 2024 President | 2022 Governor | 2020 President | |||
|---|---|---|---|---|---|---|
| Margin | Votes | Margin | Votes | Margin | Votes | |
| 202 - Gulf Coast Church of Christ | R+24.9 | 10,925 | R+36.1 | 9,318 | - | - |
| 203 - Daniels Road Baptist Church (part) | R+26.1 | 2,839 | R+33.3 | 2,103 | - | - |
| 208 - Summit Church - Gateway | R+30.0 | 3,686 | R+40.3 | 1,989 | - | - |
| 209 - Gateway Trinity Lutheran Church | R+27.1 | 4,203 | R+37.2 | 2,991 | - | - |
| 210 - Christ Community Church | R+15.4 | 5,966 | R+31.6 | 3,986 | - | - |
| 216 - Boy Scout Conference Center | R+5.9 | 3,945 | R+18.2 | 2,445 | - | - |
| 217 - St. Hillary's Episcopal Church | R+9.6 | 3,728 | R+18.1 | 2,822 | - | - |
| 405 - North Fort Myers Recreation Center | R+35.9 | 2,573 | R+39.9 | 1,841 | - | - |
| 406 - Faith Assembly of God - North Campus | R+29.6 | 1,918 | R+35.9 | 1,478 | - | - |
| 407 - North Fort Myers Church of the Nazarene | R+40.5 | 4,588 | R+46.9 | 3,042 | - | - |
| 408 - Herons Glen Golf and Country Club (part) | R+26.1 | 6,550 | R+33.7 | 5,402 | - | - |
| 415 - The Housing Authority of the City of Fort Myers | D+12.8 | 4,486 | D+8.7 | 2,876 | - | - |
| 416 - Riverside Community Center | D+15.6 | 4,318 | D+5.6 | 3,126 | - | - |
| 417 - Schandler Hall Community Park, Suarez Hall | D+32.5 | 2,813 | D+23.5 | 1,672 | - | - |
| 501 - St. Raphael's Catholic Church (part) | R+18.9 | 5,735 | R+25.4 | 2,550 | - | - |
| 502 - Buckingham Presbyterian Church | R+61.2 | 1,409 | R+64.9 | 962 | - | - |
| 503 - Iglesia Peniel | R+45.3 | 2,389 | R+54.8 | 1,799 | - | - |
| 504 - East County Regional Library | R+4.1 | 3,656 | R+12.7 | 2,003 | - | - |
| 505 - New Life Assembly of God (part) | R+0.8 | 2,476 | R+19.2 | 1,288 | - | - |
| 512 - Sonshine Christian Academy | R+35.3 | 7,236 | R+46.2 | 4,656 | - | - |
| 513 - Lee Civic Center, Davidson House | R+54.6 | 5,503 | R+64.4 | 3,656 | - | - |
| 514 - Russel Park Community Center | R+10.2 | 933 | R+18.1 | 568 | - | - |
| 516 - Alva Community Center | R+62.9 | 2,197 | R+70.6 | 1,555 | - | - |
| 517 - Bethlehem Lutheran Church | R+40.9 | 2,706 | R+51.3 | 1,890 | - | - |
| PCT. 001 | - | - | - | - | R+59.4 | 2,118 |
| PCT. 002 | - | - | - | - | R+33.6 | 3,120 |
| PCT. 003 (part) | - | - | - | - | D+14.1 | 2,868 |
| PCT. 004 | - | - | - | - | D+12.1 | 3,975 |
| PCT. 005 | - | - | - | - | R+35.2 | 4,785 |
| PCT. 006 | - | - | - | - | D+0.7 | 1,479 |
| PCT. 007 | - | - | - | - | D+59.1 | 2,619 |
| PCT. 008 | - | - | - | - | D+45.7 | 3,014 |
| PCT. 009 | - | - | - | - | D+11.1 | 3,324 |
| PCT. 010 | - | - | - | - | R+9.0 | 3,289 |
| PCT. 013 (part) | - | - | - | - | R+19.6 | 3,517 |
| PCT. 032 | - | - | - | - | D+39.1 | 3,880 |
| PCT. 036 | - | - | - | - | R+22.8 | 10,536 |
| PCT. 037 | - | - | - | - | R+26.8 | 2,102 |
| PCT. 038 | - | - | - | - | R+27.2 | 3,137 |
| PCT. 039 | - | - | - | - | R+29.5 | 3,125 |
| PCT. 042 (part) | - | - | - | - | D+16.9 | 2,771 |
| PCT. 045 | - | - | - | - | R+44.0 | 2,363 |
| PCT. 046 | - | - | - | - | D+2.0 | 3,640 |
| PCT. 047 | - | - | - | - | D+6.6 | 3,564 |
| PCT. 048 (part) | - | - | - | - | D+1.7 | 3,334 |
| PCT. 054 | - | - | - | - | R+54.3 | 1,329 |
| PCT. 060 (part) | - | - | - | - | R+27.5 | 3,053 |
| PCT. 065 | - | - | - | - | R+23.6 | 3,538 |
| PCT. 067 | - | - | - | - | R+59.2 | 3,327 |
| PCT. 068 | - | - | - | - | R+37.7 | 3,013 |
| PCT. 075 | - | - | - | - | R+21.9 | 4,280 |
| PCT. 076 | - | - | - | - | R+20.2 | 2,342 |
| PCT. 079 (part) | - | - | - | - | R+10.7 | 3,474 |
| PCT. 085 (part) | - | - | - | - | R+22.0 | 2,709 |
| PCT. 089 (part) | - | - | - | - | R+13.0 | 2,473 |
| PCT. 096 (part) | - | - | - | - | R+20.3 | 3,176 |
| PCT. 106 (part) | - | - | - | - | R+23.3 | 3,298 |
2024 President (Harris / Walz vs. Trump / Vance). Source: Florida Department of State, Division of Elections, Precinct-Level Election Results. Official results (Florida Division of Elections precinct-level file, compiled from county SOE submissions).
2022 Governor (Crist / Hernandez vs. DeSantis / Nuñez). Source: Florida Department of State, Division of Elections, Precinct-Level Election Results. Official results (Florida Division of Elections precinct-level file, compiled from county SOE submissions).
2020 President (Biden / Harris vs. Trump / Pence). Source: Florida Department of State, Division of Elections, Precinct-Level Election Results. Official results (Florida Division of Elections precinct-level file, compiled from county SOE submissions).
Precinct demographics
Demographics are Census American Community Survey (ACS) 2020-2024 5-year estimates for block groups, assigned to precincts by area share. They describe the resident population, not registered or likely voters, and include non-citizens. ACS margins of error are not shown; small precincts carry large error. Area weighting assumes people are spread evenly within each block group, so large rural precincts are the least reliable. Median income is a household-weighted average of block-group medians, an approximation.
| Area | Population | Voting-age pop. | % White non-Hisp. | % Hispanic | % Black | % Asian | Median income* | % Bachelor's+ | % 18-29 (of adults) | % 65+ | % Homeowners | % Below poverty | % Spanish at home (adults) |
|---|---|---|---|---|---|---|---|---|---|---|---|---|---|
| District | 788,465 | 671,314 | 72.3% | 14.6% | 7.3% | 1.7% | $80k | 33.1% | 12.3% | 35.3% | 75.0% | 10.7% | 10.2% |
| Sarasota (in district) | 379,885 | 329,001 | 79.5% | 10.9% | 4.2% | 1.9% | $84k | 40.0% | 10.8% | 38.9% | 75.3% | 9.2% | 7.2% |
| Lee (in district) | 206,054 | 163,587 | 50.2% | 27.7% | 15.1% | 1.8% | $77k | 25.6% | 17.9% | 23.4% | 64.3% | 15.0% | 21.7% |
| Charlotte (in district) | 202,526 | 178,726 | 81.3% | 8.2% | 5.0% | 1.3% | $75k | 27.0% | 9.7% | 40.6% | 83.8% | 9.0% | 5.2% |
Sarasota: 93 precincts
| Precinct | Population | Voting-age pop. | % White non-Hisp. | % Hispanic | % Black | % Asian | Median income* | % Bachelor's+ | % 18-29 (of adults) | % 65+ | % Homeowners | % Below poverty | % Spanish at home (adults) |
|---|---|---|---|---|---|---|---|---|---|---|---|---|---|
| Precinct 101 (part) | 614 | 586 | 74.9% | 11.1% | 7.8% | 3.0% | $57k | 34.0% | 40.2% | 21.0% | 58.6% | 19.3% | 7.4% |
| Precinct 103 | 6,108 | 4,922 | 40.3% | 31.2% | 18.9% | 0.7% | $77k | 30.7% | 20.1% | 21.7% | 63.4% | 7.4% | 23.0% |
| Precinct 105 | 9,335 | 7,864 | 67.8% | 21.2% | 4.2% | 0.2% | $86k | 40.0% | 13.9% | 30.0% | 69.6% | 10.8% | 11.0% |
| Precinct 109 | 1,733 | 1,637 | 85.1% | 3.0% | 7.6% | 1.5% | $84k | 66.3% | 13.6% | 36.9% | 71.3% | 14.9% | 2.8% |
| Precinct 111 | 1,425 | 1,356 | 74.3% | 11.5% | 7.7% | 3.0% | $56k | 32.6% | 39.7% | 21.8% | 58.4% | 19.2% | 7.4% |
| Precinct 113 | 420 | 375 | 75.6% | 13.5% | 1.5% | 2.2% | $53k | 33.1% | 14.4% | 54.2% | 58.6% | 5.6% | 6.6% |
| Precinct 115 | 10,712 | 7,959 | 28.0% | 18.5% | 49.2% | 1.8% | $50k | 11.8% | 32.2% | 15.2% | 41.0% | 33.5% | 14.2% |
| Precinct 117 | 2,659 | 2,377 | 63.3% | 21.7% | 11.4% | 0.2% | $66k | 28.0% | 19.1% | 33.3% | 86.5% | 9.4% | 17.8% |
| Precinct 119 | 4,341 | 3,636 | 44.6% | 44.0% | 6.9% | 0.5% | $88k | 17.7% | 20.6% | 20.2% | 81.6% | 8.4% | 38.8% |
| Precinct 121 | 5,288 | 5,015 | 88.7% | 6.9% | 0.4% | 0.1% | $73k | 50.0% | 9.4% | 61.0% | 75.0% | 10.8% | 4.8% |
| Precinct 123 | 4,325 | 3,582 | 47.3% | 43.2% | 3.1% | 2.3% | $62k | 24.8% | 22.1% | 11.1% | 34.5% | 12.4% | 28.3% |
| Precinct 125 | 7,825 | 6,282 | 50.9% | 32.9% | 13.9% | 1.0% | $68k | 30.4% | 24.6% | 20.2% | 47.5% | 7.1% | 23.9% |
| Precinct 127 | 10,131 | 8,612 | 77.2% | 13.3% | 3.8% | 2.1% | $80k | 41.5% | 13.0% | 29.2% | 55.4% | 11.3% | 8.0% |
| Precinct 129 | 2,067 | 1,688 | 78.8% | 8.7% | 9.9% | 0.4% | $69k | 32.5% | 16.2% | 22.0% | 70.0% | 6.0% | 6.1% |
| Precinct 131 | 981 | 886 | 76.0% | 17.5% | 1.3% | 0.0% | $51k | 27.6% | 16.2% | 33.2% | 63.8% | 10.0% | 12.9% |
| Precinct 201 | 2,526 | 2,501 | 94.7% | 2.4% | 1.6% | 0.5% | $167k | 68.0% | 0.1% | 77.3% | 93.3% | 6.9% | 2.3% |
| Precinct 203 | 2,498 | 2,380 | 88.0% | 3.3% | 4.1% | 1.7% | $91k | 69.0% | 5.4% | 60.1% | 48.7% | 11.4% | 2.3% |
| Precinct 205 | 160 | 158 | 90.1% | 1.2% | 5.2% | 0.3% | $96k | 68.8% | 5.2% | 77.8% | 65.6% | 8.4% | 3.2% |
| Precinct 207 | 1,645 | 1,474 | 82.1% | 6.8% | 4.0% | 3.4% | $81k | 61.1% | 8.5% | 33.6% | 9.6% | 16.7% | 2.4% |
| Precinct 209 | 5,768 | 5,208 | 79.1% | 11.2% | 3.4% | 3.1% | $91k | 55.6% | 13.5% | 38.7% | 66.7% | 7.1% | 7.9% |
| Precinct 211 | 2,131 | 2,075 | 91.8% | 3.7% | 1.1% | 3.4% | $208k | 72.6% | 0.6% | 73.7% | 85.8% | 3.3% | 1.6% |
| Precinct 213 | 379 | 363 | 91.8% | 3.9% | 1.1% | 3.1% | $159k | 65.3% | 2.7% | 69.4% | 78.9% | 3.4% | 2.4% |
| Precinct 215 | 6,003 | 5,265 | 74.0% | 18.7% | 4.4% | 0.6% | $69k | 33.8% | 17.1% | 31.1% | 60.8% | 13.5% | 11.6% |
| Precinct 217 | 1,958 | 1,519 | 58.0% | 20.3% | 18.0% | 0.7% | $61k | 32.0% | 13.6% | 24.2% | 64.4% | 33.1% | 13.6% |
| Precinct 219 | 6,652 | 5,709 | 83.3% | 8.5% | 1.6% | 1.2% | $87k | 39.8% | 9.4% | 33.2% | 81.0% | 7.2% | 5.0% |
| Precinct 221 | 12,412 | 9,754 | 76.1% | 14.3% | 5.0% | 1.4% | $90k | 27.9% | 16.2% | 18.6% | 71.2% | 12.7% | 13.1% |
| Precinct 223 | 2,468 | 1,903 | 83.4% | 10.2% | 0.6% | 2.5% | $132k | 63.2% | 4.5% | 28.6% | 89.6% | 10.5% | 6.2% |
| Precinct 225 | 1,538 | 1,340 | 74.9% | 20.4% | 0.6% | 0.5% | $94k | 56.1% | 5.0% | 31.2% | 82.2% | 7.4% | 17.4% |
| Precinct 227 | 4,202 | 3,430 | 84.9% | 9.6% | 0.9% | 0.8% | $76k | 45.0% | 10.8% | 28.4% | 74.0% | 5.3% | 7.5% |
| Precinct 229 | 4,873 | 4,180 | 75.7% | 13.9% | 0.7% | 0.9% | $76k | 35.0% | 10.0% | 26.5% | 73.0% | 7.7% | 8.8% |
| Precinct 231 | 10,958 | 9,327 | 79.7% | 8.8% | 2.5% | 2.5% | $73k | 41.6% | 13.0% | 33.0% | 72.2% | 6.7% | 7.8% |
| Precinct 301 (part) | 682 | 658 | 85.5% | 6.8% | 1.4% | 3.8% | $110k | 61.6% | 3.0% | 64.7% | 97.5% | 9.1% | 5.8% |
| Precinct 305 | 5,001 | 4,741 | 91.8% | 3.3% | 2.1% | 0.2% | $77k | 45.8% | 2.7% | 63.7% | 80.3% | 4.5% | 3.3% |
| Precinct 307 (part) | 5,073 | 4,479 | 83.8% | 6.8% | 2.5% | 3.4% | $83k | 46.0% | 8.0% | 49.4% | 76.9% | 12.0% | 2.8% |
| Precinct 309 (part) | 2,795 | 2,330 | 74.5% | 16.8% | 2.6% | 2.3% | $91k | 24.6% | 21.7% | 18.5% | 86.4% | 6.4% | 14.8% |
| Precinct 311 (part) | 2,497 | 2,171 | 74.4% | 15.7% | 2.4% | 1.7% | $80k | 24.2% | 21.1% | 19.1% | 87.9% | 5.4% | 13.9% |
| Precinct 312 (part) | 3,243 | 2,625 | 75.9% | 11.5% | 6.9% | 2.0% | $91k | 27.2% | 24.0% | 19.9% | 71.2% | 5.8% | 8.8% |
| Precinct 313 (part) | 3,647 | 2,874 | 77.8% | 13.3% | 4.7% | 0.6% | $79k | 32.8% | 14.2% | 25.6% | 77.4% | 6.9% | 10.8% |
| Precinct 314 (part) | 5,426 | 4,112 | 72.5% | 12.4% | 7.3% | 4.3% | $87k | 33.2% | 20.7% | 14.9% | 75.8% | 5.7% | 8.0% |
| Precinct 315 | 1,206 | 1,043 | 80.8% | 2.8% | 2.7% | 6.8% | $97k | 51.1% | 15.5% | 41.4% | 81.5% | 11.5% | 0.6% |
| Precinct 317 | 3,774 | 3,084 | 74.3% | 17.2% | 6.2% | 0.4% | $94k | 22.0% | 16.7% | 21.5% | 75.6% | 5.7% | 16.9% |
| Precinct 321 | 5,806 | 5,414 | 90.6% | 4.4% | 1.2% | 1.2% | $97k | 47.4% | 6.2% | 61.9% | 90.0% | 5.8% | 1.8% |
| Precinct 323 | 4,433 | 3,930 | 83.2% | 11.7% | 1.6% | 1.5% | $92k | 37.4% | 8.3% | 50.2% | 86.0% | 3.6% | 5.3% |
| Precinct 325 | 1,140 | 860 | 75.6% | 19.7% | 0.2% | 0.0% | $46k | 30.8% | 14.8% | 19.4% | 60.1% | 30.5% | 12.5% |
| Precinct 327 | 7,962 | 6,591 | 77.9% | 6.9% | 5.5% | 5.8% | $74k | 29.9% | 13.4% | 42.7% | 74.2% | 4.7% | 3.4% |
| Precinct 329 | 3,605 | 3,059 | 76.1% | 11.5% | 0.8% | 8.7% | $82k | 23.8% | 11.2% | 35.1% | 87.4% | 6.0% | 6.5% |
| Precinct 331 | 7,657 | 5,889 | 81.1% | 10.3% | 3.4% | 1.9% | $81k | 28.1% | 11.8% | 22.1% | 80.4% | 8.5% | 5.8% |
| Precinct 333 | 1,244 | 964 | 81.9% | 7.7% | 0.5% | 0.0% | $79k | 27.5% | 6.2% | 46.1% | 93.3% | 27.5% | 0.0% |
| Precinct 335 | 1,227 | 1,225 | 97.0% | 0.7% | 0.1% | 0.1% | $52k | 19.2% | 0.1% | 84.9% | 97.7% | 12.4% | 0.2% |
| Precinct 337 | 1,020 | 1,018 | 92.6% | 4.4% | 0.0% | 1.6% | $50k | 23.8% | 0.1% | 90.6% | 98.1% | 7.3% | 4.2% |
| Precinct 339 | 5,839 | 4,782 | 70.3% | 21.9% | 0.9% | 3.4% | $60k | 23.3% | 9.4% | 34.5% | 79.8% | 13.3% | 13.8% |
| Precinct 341 | 797 | 756 | 95.3% | 1.5% | 2.6% | 0.1% | $58k | 11.7% | 10.0% | 48.8% | 70.8% | 10.8% | 0.0% |
| Precinct 401 | 424 | 357 | 89.2% | 1.6% | 0.0% | 6.1% | $163k | 73.6% | 7.0% | 32.1% | 85.8% | 3.7% | 2.4% |
| Precinct 403 | 1,341 | 1,135 | 86.4% | 3.5% | 0.0% | 5.3% | $133k | 70.5% | 6.1% | 35.9% | 85.8% | 7.0% | 2.6% |
| Precinct 405 | 7,198 | 6,041 | 85.8% | 8.0% | 1.9% | 2.1% | $85k | 47.2% | 9.5% | 34.7% | 78.3% | 9.2% | 4.0% |
| Precinct 407 | 7,794 | 6,695 | 73.1% | 20.9% | 1.0% | 1.0% | $65k | 33.2% | 13.4% | 34.2% | 59.5% | 12.7% | 12.9% |
| Precinct 409 | 7,677 | 6,176 | 76.7% | 13.2% | 1.0% | 6.8% | $91k | 46.4% | 6.9% | 29.3% | 80.7% | 7.2% | 6.4% |
| Precinct 411 | 3,884 | 3,647 | 92.6% | 3.9% | 0.0% | 1.1% | $112k | 66.6% | 2.8% | 55.8% | 92.7% | 7.6% | 1.3% |
| Precinct 413 | 9,035 | 7,436 | 94.2% | 1.7% | 1.5% | 0.4% | $72k | 34.0% | 10.2% | 34.9% | 67.9% | 10.1% | 1.0% |
| Precinct 415 | 6,681 | 5,974 | 91.3% | 4.7% | 1.9% | 0.2% | $92k | 55.6% | 7.5% | 42.7% | 74.5% | 9.8% | 1.2% |
| Precinct 417 | 5,172 | 4,208 | 82.5% | 7.1% | 4.3% | 4.2% | $93k | 52.2% | 1.7% | 43.3% | 76.7% | 5.1% | 4.1% |
| Precinct 421 | 1,726 | 1,657 | 95.9% | 2.1% | 0.5% | 0.8% | $98k | 67.3% | 3.5% | 59.0% | 89.4% | 3.9% | 0.9% |
| Precinct 423 | 6,849 | 6,097 | 86.4% | 9.5% | 1.5% | 0.0% | $90k | 45.7% | 8.1% | 43.6% | 59.3% | 2.6% | 7.7% |
| Precinct 425 | 8,364 | 7,645 | 82.2% | 9.9% | 0.6% | 3.8% | $119k | 54.4% | 9.1% | 45.6% | 70.1% | 6.7% | 5.7% |
| Precinct 427 | 240 | 177 | 84.0% | 7.6% | 0.0% | 0.0% | $109k | 70.2% | 0.2% | 35.0% | 99.4% | 25.6% | 3.8% |
| Precinct 429 | 3,686 | 3,500 | 89.0% | 5.2% | 1.2% | 0.7% | $72k | 53.5% | 7.7% | 60.6% | 76.7% | 9.4% | 3.3% |
| Precinct 430 | 2,950 | 2,688 | 90.2% | 0.9% | 4.2% | 3.3% | $117k | 55.5% | 6.2% | 47.5% | 84.0% | 6.6% | 1.2% |
| Precinct 431 (part) | 1,199 | 1,057 | 87.7% | 5.7% | 1.0% | 1.2% | $126k | 47.0% | 7.2% | 45.0% | 96.9% | 3.9% | 2.6% |
| Precinct 433 | 1,820 | 1,709 | 87.8% | 1.5% | 0.0% | 3.6% | $60k | 34.8% | 1.8% | 59.4% | 96.2% | 6.2% | 0.7% |
| Precinct 437 | 1,410 | 1,325 | 88.3% | 2.2% | 0.0% | 0.0% | $114k | 24.0% | 16.5% | 47.1% | 72.8% | 1.2% | 0.4% |
| Precinct 501 | 5,540 | 4,904 | 85.2% | 3.2% | 4.1% | 4.3% | $96k | 50.8% | 5.2% | 45.6% | 87.1% | 6.6% | 2.4% |
| Precinct 503 | 850 | 814 | 93.5% | 0.9% | 0.0% | 0.3% | $174k | 60.2% | 2.8% | 50.6% | 85.1% | 3.0% | 0.2% |
| Precinct 505 | 2,263 | 2,091 | 90.4% | 2.5% | 0.0% | 1.8% | $131k | 54.7% | 4.2% | 51.1% | 90.8% | 3.7% | 0.0% |
| Precinct 507 | 4,381 | 3,797 | 81.2% | 4.4% | 0.8% | 4.1% | $81k | 45.7% | 5.3% | 44.8% | 79.3% | 11.2% | 3.1% |
| Precinct 509 | 1,907 | 1,788 | 75.9% | 10.8% | 5.1% | 4.7% | $54k | 31.6% | 13.8% | 35.6% | 70.3% | 15.5% | 7.2% |
| Precinct 511 | 4,051 | 3,811 | 90.8% | 3.4% | 0.6% | 1.2% | $74k | 47.5% | 2.8% | 64.5% | 72.3% | 9.3% | 1.3% |
| Precinct 513 | 1,140 | 1,102 | 91.2% | 6.4% | 0.5% | 0.4% | $60k | 56.3% | 0.3% | 73.6% | 76.9% | 6.3% | 5.7% |
| Precinct 515 | 1,867 | 1,823 | 85.5% | 3.7% | 1.0% | 6.7% | $55k | 28.3% | 5.3% | 65.9% | 85.3% | 13.5% | 2.1% |
| Precinct 517 | 3,437 | 3,121 | 82.9% | 8.6% | 1.7% | 1.0% | $67k | 25.3% | 5.4% | 49.1% | 85.8% | 9.7% | 6.4% |
| Precinct 519 | 3,161 | 3,038 | 89.7% | 7.4% | 0.2% | 0.0% | $74k | 48.2% | 5.6% | 60.0% | 69.8% | 7.0% | 4.2% |
| Precinct 521 | 1,828 | 1,673 | 85.5% | 9.3% | 0.6% | 0.7% | $66k | 39.7% | 1.6% | 57.7% | 70.3% | 11.3% | 6.2% |
| Precinct 523 | 1,845 | 1,772 | 90.9% | 4.5% | 0.0% | 1.2% | $61k | 37.3% | 0.7% | 68.5% | 88.7% | 4.5% | 2.5% |
| Precinct 525 | 4,028 | 3,979 | 95.4% | 2.0% | 0.5% | 1.8% | $103k | 39.6% | 1.3% | 70.0% | 81.0% | 4.7% | 1.6% |
| Precinct 527 | 3,426 | 3,159 | 94.5% | 2.9% | 0.1% | 0.4% | $81k | 42.3% | 7.6% | 51.0% | 91.4% | 9.0% | 4.1% |
| Precinct 529 | 5,702 | 4,635 | 81.5% | 13.1% | 0.0% | 2.8% | $83k | 25.3% | 11.6% | 32.3% | 78.2% | 6.6% | 3.7% |
| Precinct 531 | 1,535 | 1,264 | 86.8% | 8.5% | 0.0% | 2.0% | $61k | 26.4% | 6.0% | 27.2% | 81.4% | 14.7% | 6.3% |
| Precinct 533 | 4,504 | 3,778 | 79.6% | 17.7% | 0.1% | 1.0% | $90k | 32.7% | 12.3% | 31.4% | 75.1% | 8.7% | 10.2% |
| Precinct 535 | 8,076 | 7,129 | 93.3% | 2.2% | 0.3% | 1.3% | $84k | 40.7% | 5.8% | 49.3% | 90.0% | 5.5% | 2.6% |
| Precinct 537 | 8,450 | 7,029 | 91.4% | 3.8% | 0.6% | 0.8% | $73k | 24.0% | 11.6% | 26.0% | 86.6% | 16.6% | 4.4% |
| Precinct 539 | 5,479 | 5,240 | 95.0% | 2.8% | 0.0% | 0.9% | $90k | 46.1% | 3.9% | 64.4% | 96.8% | 3.9% | 3.2% |
| Precinct 541 | 9,920 | 9,323 | 91.6% | 3.1% | 0.6% | 2.1% | $103k | 49.0% | 4.0% | 57.1% | 94.4% | 3.7% | 1.3% |
| Precinct 543 | 5,666 | 5,392 | 92.6% | 2.9% | 0.2% | 0.9% | $71k | 36.8% | 8.7% | 50.7% | 85.0% | 8.5% | 1.3% |
| Precinct 545 | 5,171 | 4,849 | 94.7% | 0.9% | 0.1% | 1.1% | $75k | 36.8% | 5.7% | 62.3% | 83.0% | 5.4% | 0.9% |
Lee: 24 precincts
| Precinct | Population | Voting-age pop. | % White non-Hisp. | % Hispanic | % Black | % Asian | Median income* | % Bachelor's+ | % 18-29 (of adults) | % 65+ | % Homeowners | % Below poverty | % Spanish at home (adults) |
|---|---|---|---|---|---|---|---|---|---|---|---|---|---|
| Precinct 202 | 12,127 | 10,784 | 77.6% | 9.7% | 4.4% | 1.8% | $114k | 52.1% | 6.2% | 50.5% | 91.9% | 5.1% | 6.5% |
| Precinct 203 (part) | 2,126 | 1,863 | 74.5% | 14.6% | 3.1% | 2.9% | $91k | 39.0% | 14.8% | 35.5% | 69.1% | 6.6% | 10.3% |
| Precinct 208 | 5,467 | 4,264 | 69.8% | 14.7% | 11.2% | 1.7% | $114k | 46.4% | 15.0% | 18.2% | 79.4% | 2.1% | 9.5% |
| Precinct 209 | 6,581 | 5,492 | 71.3% | 5.2% | 2.4% | 3.3% | $111k | 50.4% | 13.6% | 32.0% | 95.8% | 5.1% | 3.5% |
| Precinct 210 | 12,251 | 10,353 | 54.2% | 21.7% | 11.7% | 3.9% | $90k | 40.7% | 22.2% | 22.7% | 41.4% | 7.4% | 16.9% |
| Precinct 216 | 12,942 | 10,111 | 48.8% | 24.1% | 17.0% | 2.4% | $65k | 31.2% | 18.0% | 19.7% | 33.5% | 18.9% | 18.0% |
| Precinct 217 | 5,705 | 4,161 | 65.6% | 11.4% | 11.2% | 0.4% | $75k | 36.2% | 9.5% | 20.4% | 72.4% | 15.0% | 8.4% |
| Precinct 405 | 5,953 | 4,908 | 69.1% | 27.1% | 1.0% | 0.4% | $45k | 8.6% | 15.5% | 23.8% | 72.8% | 19.3% | 16.3% |
| Precinct 406 | 2,889 | 2,179 | 84.4% | 10.9% | 1.6% | 0.4% | $57k | 22.3% | 6.7% | 35.0% | 84.1% | 10.7% | 7.2% |
| Precinct 407 | 11,339 | 9,658 | 82.0% | 12.3% | 2.7% | 0.0% | $47k | 11.6% | 10.4% | 35.1% | 76.9% | 23.4% | 7.7% |
| Precinct 408 (part) | 8,074 | 7,901 | 94.5% | 1.9% | 0.4% | 2.0% | $63k | 25.3% | 1.4% | 75.7% | 95.3% | 8.7% | 1.4% |
| Precinct 415 | 17,721 | 14,335 | 26.7% | 34.9% | 29.9% | 2.8% | $56k | 22.4% | 25.1% | 12.3% | 27.9% | 20.0% | 31.3% |
| Precinct 416 | 8,900 | 7,446 | 23.8% | 19.6% | 49.2% | 1.1% | $48k | 16.6% | 20.7% | 15.2% | 36.1% | 21.9% | 12.3% |
| Precinct 417 | 15,195 | 11,094 | 12.8% | 57.4% | 27.9% | 0.4% | $48k | 6.0% | 31.6% | 9.5% | 35.2% | 29.0% | 49.2% |
| Precinct 501 (part) | 10,836 | 8,212 | 24.1% | 54.6% | 16.4% | 1.1% | $80k | 12.4% | 23.5% | 9.9% | 75.4% | 14.6% | 48.3% |
| Precinct 502 | 4,515 | 3,697 | 59.2% | 28.0% | 6.2% | 2.6% | $118k | 37.0% | 15.8% | 26.5% | 87.9% | 5.5% | 20.7% |
| Precinct 503 | 4,974 | 3,880 | 63.6% | 27.6% | 5.9% | 0.9% | $80k | 15.0% | 15.7% | 27.5% | 77.4% | 4.7% | 19.6% |
| Precinct 504 | 12,899 | 8,954 | 21.1% | 43.1% | 28.5% | 2.1% | $78k | 13.8% | 24.0% | 10.5% | 75.4% | 15.6% | 43.0% |
| Precinct 505 (part) | 11,578 | 7,341 | 11.7% | 49.2% | 31.3% | 0.7% | $63k | 10.2% | 30.2% | 7.4% | 34.0% | 27.1% | 40.0% |
| Precinct 512 | 8,820 | 7,280 | 72.0% | 16.8% | 4.7% | 3.5% | $113k | 39.5% | 10.8% | 33.9% | 86.3% | 4.4% | 12.5% |
| Precinct 513 | 8,870 | 7,189 | 79.2% | 14.4% | 0.0% | 1.7% | $101k | 25.8% | 19.1% | 24.5% | 87.5% | 11.8% | 14.6% |
| Precinct 514 | 5,032 | 3,651 | 31.4% | 52.0% | 15.4% | 0.2% | $63k | 12.9% | 19.5% | 14.8% | 60.8% | 20.4% | 42.3% |
| Precinct 516 | 5,227 | 3,966 | 68.8% | 20.1% | 4.2% | 3.1% | $86k | 23.3% | 14.3% | 22.6% | 91.2% | 7.3% | 19.8% |
| Precinct 517 | 6,033 | 4,869 | 64.1% | 26.6% | 2.3% | 2.5% | $75k | 18.8% | 18.8% | 20.7% | 60.4% | 14.9% | 17.0% |
Charlotte: 67 precincts
| Precinct | Population | Voting-age pop. | % White non-Hisp. | % Hispanic | % Black | % Asian | Median income* | % Bachelor's+ | % 18-29 (of adults) | % 65+ | % Homeowners | % Below poverty | % Spanish at home (adults) |
|---|---|---|---|---|---|---|---|---|---|---|---|---|---|
| 1-Voting District | 365 | 350 | 75.5% | 2.6% | 0.1% | 0.4% | $37k | 19.6% | 24.1% | 41.6% | 56.3% | 12.1% | 1.5% |
| 10-Voting District | 2,117 | 1,768 | 61.6% | 21.7% | 6.5% | 3.6% | $60k | 13.4% | 16.2% | 21.2% | 81.3% | 20.5% | 16.8% |
| 11-Voting District | 2,830 | 2,511 | 88.7% | 4.9% | 1.5% | 1.7% | $62k | 24.9% | 10.0% | 40.6% | 91.2% | 17.7% | 3.0% |
| 12-Voting District | 4,193 | 3,520 | 84.6% | 5.9% | 5.9% | 1.4% | $79k | 26.1% | 12.7% | 26.0% | 87.8% | 9.8% | 3.3% |
| 13-Voting District | 3,554 | 3,061 | 85.1% | 4.3% | 6.4% | 0.9% | $87k | 24.2% | 9.0% | 30.9% | 94.1% | 4.8% | 2.0% |
| 14-Voting District | 2,821 | 2,444 | 78.6% | 15.4% | 0.8% | 1.0% | $66k | 12.8% | 7.1% | 40.5% | 88.9% | 23.5% | 3.9% |
| 15-Voting District | 3,475 | 3,090 | 77.5% | 7.8% | 9.9% | 0.9% | $61k | 20.4% | 12.3% | 39.3% | 83.9% | 8.9% | 6.3% |
| 16-Voting District | 2,316 | 1,926 | 66.6% | 10.0% | 20.9% | 0.1% | $54k | 18.0% | 27.0% | 14.0% | 63.6% | 14.1% | 7.2% |
| 17-Voting District | 3,453 | 2,988 | 64.3% | 16.8% | 2.7% | 1.0% | $28k | 14.0% | 10.3% | 38.1% | 54.2% | 12.1% | 16.2% |
| 18-Voting District | 2,726 | 2,544 | 91.6% | 3.6% | 2.5% | 0.1% | $60k | 29.0% | 7.1% | 51.5% | 79.8% | 13.2% | 3.7% |
| 19-Voting District | 999 | 887 | 81.9% | 2.1% | 10.9% | 0.0% | $68k | 34.0% | 14.4% | 40.0% | 61.5% | 10.0% | 1.8% |
| 2-Voting District | 633 | 547 | 89.8% | 4.2% | 1.4% | 0.5% | $57k | 26.9% | 4.9% | 55.0% | 83.6% | 8.7% | 3.0% |
| 20-Voting District | 3,622 | 3,276 | 70.9% | 19.1% | 3.8% | 2.4% | $57k | 22.3% | 20.2% | 25.4% | 75.7% | 18.5% | 6.1% |
| 21-Voting District | 1,830 | 1,595 | 74.1% | 17.0% | 5.2% | 1.5% | $54k | 18.0% | 11.8% | 37.3% | 78.7% | 3.5% | 14.9% |
| 22-Voting District | 4,938 | 4,150 | 81.5% | 10.5% | 4.2% | 1.0% | $61k | 25.7% | 22.6% | 32.4% | 93.0% | 8.6% | 4.8% |
| 23-Voting District | 1,178 | 1,124 | 94.6% | 2.9% | 0.0% | 0.6% | $159k | 51.2% | 4.6% | 59.5% | 91.6% | 1.8% | 2.3% |
| 24-Voting District | 2,932 | 2,408 | 87.3% | 6.9% | 4.8% | 0.0% | $67k | 17.6% | 11.6% | 30.4% | 81.3% | 13.4% | 2.8% |
| 25-Voting District | 4,140 | 3,408 | 74.0% | 11.7% | 5.2% | 0.3% | $64k | 15.0% | 10.8% | 23.2% | 86.6% | 16.5% | 6.8% |
| 26-Voting District | 1,394 | 1,140 | 72.3% | 5.4% | 17.1% | 2.0% | $55k | 19.9% | 7.9% | 36.3% | 59.2% | 12.6% | 4.5% |
| 27-Voting District | 3,532 | 3,424 | 96.2% | 1.0% | 0.7% | 0.0% | $48k | 20.5% | 6.0% | 64.4% | 87.2% | 16.2% | 0.9% |
| 28-Voting District | 2,720 | 2,641 | 96.3% | 0.8% | 0.8% | 0.0% | $107k | 38.2% | 3.4% | 50.2% | 89.0% | 6.1% | 1.2% |
| 29-Voting District | 3,938 | 3,744 | 94.7% | 0.7% | 0.0% | 3.6% | $83k | 36.1% | 5.8% | 63.4% | 89.7% | 4.4% | 0.1% |
| 3-Voting District | 957 | 799 | 64.1% | 3.8% | 21.1% | 1.2% | $45k | 21.9% | 21.8% | 29.4% | 53.7% | 16.6% | 3.1% |
| 30-Voting District | 1,555 | 1,459 | 76.8% | 4.9% | 0.0% | 1.0% | $47k | 27.2% | 13.8% | 42.4% | 71.6% | 8.1% | 2.9% |
| 31-Voting District | 4,756 | 3,840 | 86.0% | 8.6% | 0.9% | 0.9% | $93k | 32.8% | 10.4% | 27.4% | 91.9% | 6.3% | 7.2% |
| 32-Voting District | 4,965 | 4,283 | 72.3% | 10.8% | 12.8% | 1.0% | $129k | 28.9% | 13.9% | 17.1% | 90.1% | 8.5% | 5.7% |
| 33-Voting District | 3,709 | 3,429 | 89.4% | 4.4% | 0.5% | 2.7% | $80k | 26.6% | 13.2% | 45.2% | 85.8% | 6.7% | 0.4% |
| 34-Voting District | 2,006 | 1,823 | 90.9% | 0.6% | 0.0% | 0.0% | $109k | 54.1% | 1.1% | 62.5% | 89.0% | 2.3% | 1.4% |
| 35-Voting District | 1,186 | 1,148 | 94.1% | 0.5% | 0.0% | 1.7% | $70k | 28.7% | 9.0% | 54.7% | 82.2% | 6.2% | 0.3% |
| 36-Voting District | 4,021 | 3,343 | 66.0% | 12.7% | 18.4% | 1.6% | $75k | 19.2% | 9.4% | 33.0% | 86.8% | 10.4% | 9.1% |
| 38-Voting District | 3,859 | 3,299 | 64.7% | 19.8% | 9.4% | 1.2% | $68k | 22.2% | 12.2% | 26.7% | 86.9% | 13.1% | 11.8% |
| 39-Voting District | 3,402 | 2,922 | 65.2% | 13.1% | 16.5% | 1.9% | $84k | 18.6% | 13.3% | 37.7% | 91.3% | 5.2% | 11.9% |
| 4-Voting District | 416 | 384 | 98.0% | 1.4% | 0.6% | 0.0% | $87k | 44.8% | 6.3% | 50.3% | 66.5% | 3.5% | 0.8% |
| 41-Voting District | 1,782 | 1,753 | 88.0% | 7.3% | 0.0% | 0.0% | $113k | 57.2% | 2.5% | 59.2% | 96.3% | 5.5% | 7.1% |
| 42-Voting District | 4,088 | 3,723 | 84.1% | 10.5% | 0.1% | 0.5% | $66k | 27.4% | 5.6% | 47.5% | 88.7% | 4.4% | 9.7% |
| 43-Voting District | 5,514 | 4,928 | 70.2% | 20.0% | 4.2% | 3.4% | $75k | 24.6% | 11.4% | 39.4% | 83.1% | 5.6% | 16.8% |
| 44-Voting District | 4,391 | 3,917 | 78.2% | 5.0% | 5.6% | 2.2% | $81k | 23.3% | 5.5% | 38.7% | 92.2% | 2.7% | 2.5% |
| 45-Voting District | 2,904 | 2,642 | 80.2% | 7.7% | 0.0% | 4.6% | $66k | 19.5% | 8.3% | 46.1% | 87.2% | 9.7% | 4.5% |
| 46-Voting District | 3,464 | 3,254 | 87.5% | 6.1% | 1.0% | 2.1% | $70k | 34.7% | 2.3% | 64.3% | 88.7% | 9.2% | 4.1% |
| 47-Voting District | 6,319 | 5,796 | 95.9% | 2.1% | 0.5% | 0.1% | $81k | 31.1% | 4.2% | 56.2% | 90.7% | 4.0% | 2.0% |
| 48-Voting District | 3,899 | 3,120 | 67.1% | 14.2% | 17.0% | 0.0% | $47k | 25.2% | 11.7% | 40.7% | 68.3% | 11.5% | 5.4% |
| 49-Voting District | 2,399 | 2,032 | 75.7% | 6.7% | 2.6% | 1.6% | $66k | 23.6% | 6.9% | 31.9% | 61.5% | 5.6% | 11.1% |
| 5-Voting District | 4,134 | 3,619 | 79.1% | 9.7% | 5.4% | 0.6% | $57k | 27.6% | 11.3% | 47.5% | 62.3% | 15.7% | 7.7% |
| 52-Voting District | 6,203 | 5,283 | 84.9% | 5.6% | 4.6% | 0.7% | $61k | 16.5% | 10.4% | 34.0% | 91.9% | 8.9% | 4.5% |
| 53-Voting District | 3,290 | 3,021 | 92.2% | 5.1% | 0.0% | 0.9% | $73k | 15.2% | 14.0% | 27.2% | 80.5% | 12.0% | 1.5% |
| 54-Voting District | 1,644 | 1,587 | 95.2% | 1.2% | 3.1% | 0.1% | $54k | 30.5% | 7.2% | 63.3% | 86.5% | 6.9% | 0.2% |
| 55-Voting District | 3,855 | 3,676 | 93.5% | 1.3% | 0.0% | 1.2% | $63k | 40.2% | 1.4% | 57.8% | 79.5% | 8.5% | 0.8% |
| 56-Voting District | 4,015 | 3,418 | 64.4% | 12.1% | 13.1% | 1.8% | $73k | 21.8% | 8.5% | 35.0% | 64.8% | 4.1% | 11.3% |
| 57-Voting District | 761 | 699 | 75.4% | 20.8% | 0.4% | 1.8% | $99k | 43.2% | 8.4% | 47.2% | 95.2% | 4.6% | 11.0% |
| 58-Voting District | 5,515 | 4,350 | 75.8% | 15.4% | 3.7% | 0.9% | $82k | 23.7% | 11.0% | 27.3% | 91.5% | 6.7% | 8.8% |
| 6-Voting District | 3,905 | 3,468 | 86.0% | 5.7% | 2.7% | 0.9% | $92k | 35.9% | 5.1% | 53.9% | 94.1% | 6.0% | 3.5% |
| 60-Voting District | 1,693 | 1,417 | 59.9% | 3.0% | 25.1% | 0.0% | $39k | 14.9% | 26.5% | 26.1% | 53.1% | 17.7% | 3.3% |
| 61-Voting District | 2,683 | 2,416 | 80.9% | 8.0% | 2.3% | 5.6% | $90k | 22.2% | 8.5% | 40.1% | 92.5% | 10.8% | 0.1% |
| 63-Voting District | 7,747 | 6,882 | 80.5% | 6.9% | 9.5% | 2.0% | $84k | 24.9% | 12.3% | 40.5% | 84.9% | 2.3% | 3.9% |
| 64-Voting District | 3,460 | 3,351 | 94.6% | 1.6% | 0.0% | 1.0% | $98k | 48.7% | 3.8% | 65.7% | 95.0% | 10.2% | 2.2% |
| 66-Voting District | 3,344 | 2,652 | 71.7% | 8.6% | 9.8% | 6.8% | $71k | 35.0% | 7.4% | 29.9% | 60.6% | 14.5% | 4.2% |
| 67-Voting District | 831 | 730 | 89.6% | 7.0% | 0.0% | 0.3% | $77k | 28.9% | 8.0% | 45.0% | 98.9% | 7.3% | 1.5% |
| 68-Voting District | 811 | 774 | 96.0% | 2.7% | 0.0% | 0.1% | $70k | 26.8% | 4.2% | 61.1% | 97.2% | 3.8% | 0.6% |
| 69-Voting District | 1,476 | 1,297 | 89.6% | 7.0% | 0.0% | 0.3% | $77k | 28.9% | 8.0% | 45.2% | 98.8% | 7.3% | 1.5% |
| 7-Voting District | 4,572 | 4,250 | 95.1% | 2.9% | 0.4% | 0.4% | $87k | 39.6% | 6.2% | 51.6% | 86.1% | 7.3% | 0.7% |
| 75-Voting District | 3,410 | 2,920 | 69.9% | 10.4% | 11.4% | 2.1% | $84k | 25.2% | 8.1% | 33.4% | 88.6% | 3.9% | 6.6% |
| 76-Voting District | 1,431 | 1,275 | 74.7% | 19.4% | 2.7% | 0.0% | $43k | 13.5% | 19.4% | 24.1% | 76.9% | 17.6% | 13.4% |
| 77-Voting District | 5,164 | 4,606 | 91.7% | 2.0% | 0.3% | 0.8% | $104k | 36.1% | 4.8% | 45.8% | 94.4% | 4.8% | 2.2% |
| 78-Voting District | 151 | 147 | 90.0% | 3.6% | 0.0% | 4.1% | $68k | 44.6% | 1.3% | 34.8% | 96.2% | 4.0% | 1.5% |
| 8-Voting District | 1,962 | 1,906 | 96.0% | 1.8% | 0.0% | 1.0% | $108k | 32.5% | 6.5% | 54.4% | 89.4% | 13.6% | 1.0% |
| 80-Voting District | 3,160 | 2,682 | 88.2% | 6.1% | 1.5% | 0.9% | $63k | 14.6% | 12.9% | 36.7% | 79.9% | 8.6% | 3.7% |
| 9-Voting District | 2,012 | 1,863 | 77.3% | 16.3% | 3.5% | 1.2% | $63k | 33.1% | 9.8% | 53.7% | 62.6% | 16.7% | 8.2% |
*Median income is approximate (see note above). ACS 2020-2024 5-year.
Nonpartisan voter information. GOTV Polling does not endorse any candidate.