
Missouri's 1st Congressional District
U.S. House · Missouri · District 1 · General election: Tuesday, November 3, 2026
Candidates on the November 3 ballot
- Paul Berry IIIRepublican
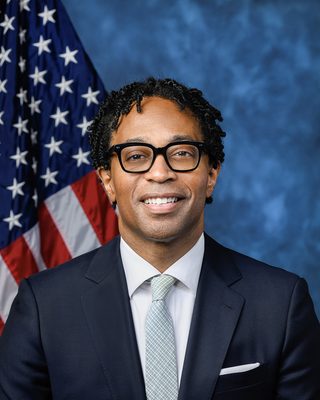 Wesley BellDemocraticPhoto: U.S. Congress
- Tom SchmitzLibertarian
Source: Missouri Secretary of State, Certification of Candidates and Party Emblems, 2026 General Election, certified list (2026-08-25; retrieved 2026-10-30). Order of names does not reflect ballot order. Incumbent tags appear only where the official list marks incumbents. Photos come from the Candidate Alerts database where one is on file; otherwise initials are shown.
Federal campaign finance filings for this seat: FEC election page (FEC registration is not the same as ballot qualification).
Certified candidates
- Wesley Bell DemocraticIncumbent @RepWesleyBellMO
- Tom Schmitz Libertarian
- Paul Berry Republican
Certified candidate list from Candidate Alerts, as of 2026-09-24, based on Missouri Secretary of State. Includes candidates the database marks as on the November 3 ballot. Incumbent tags here follow the database.
Past election results
Demographics
2020 Census demographics by district are not yet published in this data set.
1 of 943 precincts are above 50%, and 2 are above 25%. Source: Census American Community Survey 2020-2024 5-year block groups, allocated to current precinct shapes by area. Area coverage is good for 85.5% of precincts; treat the rest as approximate.
Poll status
Map
Share of adults (18+) who speak Spanish at home, by precinct. Census ACS 2020-2024 5-year estimates on the current precinct layer. Hover a precinct for its value.
District shown in red: U.S. Census Bureau cartographic boundary file for the 119th Congress (cb_2024_us_cd119_500k). These are the lines in effect for 2026 in this state per the Candidate Alerts district registry.
Precinct map: past elections and demographics
Choose a layer above. Hover a precinct for its values.
Precinct results
Precinct demographics
Demographics are Census American Community Survey (ACS) 2020-2024 5-year estimates for block groups, assigned to precincts by area share. They describe the resident population, not registered or likely voters, and include non-citizens. ACS margins of error are not shown; small precincts carry large error. Area weighting assumes people are spread evenly within each block group, so large rural precincts are the least reliable. Median income is a household-weighted average of block-group medians, an approximation.
| Area | Population | Voting-age pop. | % White non-Hisp. | % Hispanic | % Black | % Asian | Median income* | % Bachelor's+ | % 18-29 (of adults) | % 65+ | % Homeowners | % Below poverty | % Spanish at home (adults) |
|---|---|---|---|---|---|---|---|---|---|---|---|---|---|
| District | 762,180 | 601,642 | 41.3% | 4.8% | 45.0% | 3.7% | $72k | 38.4% | 22.2% | 16.2% | 54.0% | 16.8% | 3.2% |
| St. Louis (in district) | 474,058 | 366,313 | 39.4% | 4.4% | 46.7% | 3.8% | $76k | 36.7% | 22.0% | 16.7% | 60.3% | 14.5% | 3.3% |
| St. Louis (in district) | 288,122 | 235,329 | 44.4% | 5.3% | 42.1% | 3.5% | $65k | 41.1% | 22.4% | 15.5% | 45.3% | 20.6% | 3.0% |
Precinct-level demographics (943 precincts) are on the county pages linked above.
*Median income is approximate (see note above). ACS 2020-2024 5-year.
Nonpartisan voter information. GOTV Polling does not endorse any candidate.