
Missouri's 4th Congressional District
U.S. House · Missouri · District 4 · General election: Tuesday, November 3, 2026
Candidates on the November 3 ballot
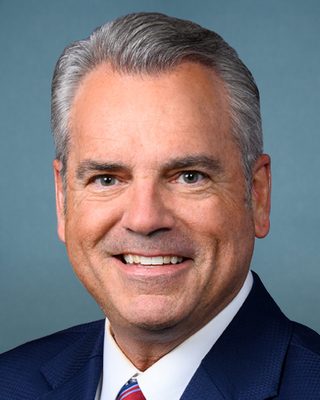 Mark AlfordRepublicanPhoto: U.S. Congress
- Jordan HerreraDemocratic
- Thomas HolbrookLibertarian
Source: Missouri Secretary of State, Certification of Candidates and Party Emblems, 2026 General Election, certified list (2026-08-25; retrieved 2026-10-30). Order of names does not reflect ballot order. Incumbent tags appear only where the official list marks incumbents. Photos come from the Candidate Alerts database where one is on file; otherwise initials are shown.
Federal campaign finance filings for this seat: FEC election page (FEC registration is not the same as ballot qualification).
Certified candidates
- Mark Alford RepublicanIncumbent @RepMarkAlford
- Jordan Herrera Democratic
- Thomas Holbrook Libertarian
Certified candidate list from Candidate Alerts, as of 2026-09-24, based on Missouri Secretary of State. Includes candidates the database marks as on the November 3 ballot. Incumbent tags here follow the database.
Past election results
Partial coverage: totals include only the counties loaded from certified sources (24 counties missing), so they are not the official district total.
| Candidate | Party | Votes | Share |
|---|---|---|---|
| Jeanette Cass | 17,694 | 50.1% | |
| Mark Alford | 16,611 | 47.0% | |
| Thomas Holbrook | 1,035 | 2.9% | |
| Total | 35,340 |
Source: Missouri local election authorities, official precinct results; per-county provenance in election_contest_sources. Status: Official county precinct results; each loaded county reconciles exactly to that county's official final report (no statewide certified district figures loaded). Partial coverage: see per-county provenance.
Partial coverage: totals include only the counties loaded from certified sources (23 counties missing), so they are not the official district total.
| Candidate | Party | Votes | Share |
|---|---|---|---|
| Jack Truman | 12,938 | 50.9% | |
| Mark Alford | 11,690 | 46.0% | |
| Randy Langkraehr | 766 | 3.0% | |
| Total | 25,394 |
Source: Missouri local election authorities, official precinct results; per-county provenance in election_contest_sources. Status: Official county precinct results; each loaded county reconciles exactly to that county's official final report (no statewide certified district figures loaded). Partial coverage: see per-county provenance.
Held under the district lines in effect at the time. Those boundaries differ from the 2026 district.
Partial coverage: totals include only the counties loaded from certified sources, so they are not the official district total.
| Candidate | Party | Votes | Share |
|---|---|---|---|
| Lindsey Simmons | Democratic | 45,540 | 51.3% |
| Vicky Hartzler | Republican | 40,809 | 45.9% |
| Steven K. Koonse | Libertarian | 2,495 | 2.8% |
| Total | 88,844 |
Source: Missouri local election authorities, official precinct results; per-county provenance in election_contest_sources. Status: Official county precinct results; each loaded county reconciles exactly to that county's official final report (no statewide certified district figures loaded). Partial coverage: see per-county provenance.
Certified results from state or county election authorities, as compiled in the Candidate Alerts precinct results database (public API candidatealerts.com/api/district-results). Totals are sums of certified precinct and county-level rows.
Demographics
2020 Census demographics by district are not yet published in this data set.
0 of 458 precincts are above 50%, and 0 are above 25%. Source: Census American Community Survey 2020-2024 5-year block groups, allocated to current precinct shapes by area.
Poll status
Map
Share of adults (18+) who speak Spanish at home, by precinct. Census ACS 2020-2024 5-year estimates on the current precinct layer. Hover a precinct for its value.
District shown in red: U.S. Census Bureau cartographic boundary file for the 119th Congress (cb_2024_us_cd119_500k). These are the lines in effect for 2026 in this state per the Candidate Alerts district registry.
Precinct map: past elections and demographics
Choose a layer above. Hover a precinct for its values.
Precinct results
Precinct demographics
Demographics are Census American Community Survey (ACS) 2020-2024 5-year estimates for block groups, assigned to precincts by area share. They describe the resident population, not registered or likely voters, and include non-citizens. ACS margins of error are not shown; small precincts carry large error. Area weighting assumes people are spread evenly within each block group, so large rural precincts are the least reliable. Median income is a household-weighted average of block-group medians, an approximation.
| Area | Population | Voting-age pop. | % White non-Hisp. | % Hispanic | % Black | % Asian | Median income* | % Bachelor's+ | % 18-29 (of adults) | % 65+ | % Homeowners | % Below poverty | % Spanish at home (adults) |
|---|---|---|---|---|---|---|---|---|---|---|---|---|---|
| District | 792,535 | 610,738 | 84.0% | 5.2% | 4.3% | 1.1% | $72k | 25.5% | 21.4% | 18.0% | 70.9% | 13.2% | 2.5% |
| Cass (in district) | 110,751 | 84,708 | 83.6% | 5.5% | 4.6% | 0.8% | $93k | 29.7% | 17.5% | 17.9% | 75.6% | 6.2% | 2.0% |
| Boone (in district) | 88,404 | 69,404 | 72.7% | 4.8% | 12.6% | 3.2% | $72k | 41.9% | 27.8% | 14.2% | 57.7% | 16.4% | 2.7% |
| Jackson (in district) | 82,214 | 60,131 | 81.4% | 6.4% | 5.3% | 1.5% | $95k | 32.6% | 16.0% | 14.7% | 71.1% | 7.8% | 3.3% |
| Johnson (in district) | 54,765 | 42,651 | 83.7% | 5.2% | 4.3% | 1.5% | $71k | 29.1% | 33.5% | 13.1% | 63.5% | 11.8% | 2.2% |
| Pulaski (in district) | 53,912 | 42,123 | 68.5% | 11.5% | 10.1% | 2.1% | $68k | 25.8% | 41.4% | 9.7% | 61.2% | 12.7% | 6.8% |
| Pettis (in district) | 43,111 | 32,296 | 82.2% | 9.9% | 2.4% | 0.7% | $63k | 18.4% | 19.0% | 17.4% | 69.2% | 15.5% | 5.5% |
| Laclede (in district) | 36,202 | 27,271 | 90.4% | 3.0% | 0.6% | 0.7% | $57k | 16.3% | 17.6% | 18.3% | 68.4% | 18.2% | 1.1% |
| Lafayette (in district) | 33,020 | 25,439 | 89.7% | 3.5% | 1.6% | 0.4% | $82k | 26.2% | 17.5% | 19.3% | 75.7% | 9.3% | 2.3% |
| Polk (in district) | 32,510 | 24,906 | 91.0% | 3.0% | 0.7% | 0.8% | $61k | 22.6% | 22.4% | 18.3% | 71.5% | 16.3% | 1.3% |
| Camden (in district) | 32,358 | 26,414 | 91.3% | 3.5% | 1.0% | 0.7% | $64k | 22.8% | 13.4% | 27.0% | 81.9% | 13.5% | 1.9% |
| Saline (in district) | 23,228 | 18,126 | 75.3% | 12.6% | 4.9% | 0.6% | $63k | 22.6% | 26.7% | 17.2% | 69.8% | 16.4% | 6.9% |
| Webster (in district) | 22,341 | 16,983 | 90.6% | 1.8% | 1.5% | 0.2% | $78k | 19.6% | 22.5% | 18.1% | 78.9% | 12.5% | 0.7% |
| Henry (in district) | 22,327 | 17,351 | 91.3% | 3.0% | 0.8% | 0.2% | $62k | 16.3% | 15.9% | 22.4% | 75.0% | 14.3% | 1.1% |
| Morgan (in district) | 21,685 | 16,733 | 91.9% | 2.6% | 0.2% | 0.4% | $56k | 16.6% | 15.0% | 24.0% | 79.7% | 18.3% | 0.6% |
| Benton (in district) | 20,110 | 16,629 | 91.6% | 2.0% | 1.0% | 0.2% | $52k | 15.0% | 11.1% | 31.4% | 83.9% | 19.9% | 1.1% |
| Vernon (in district) | 19,512 | 14,848 | 92.7% | 2.7% | 0.9% | 0.8% | $56k | 16.6% | 18.0% | 20.6% | 71.4% | 18.7% | 1.5% |
| Dallas (in district) | 17,523 | 13,390 | 93.1% | 2.3% | 0.2% | 0.0% | $56k | 16.4% | 15.6% | 21.0% | 75.9% | 20.5% | 0.2% |
| Bates (in district) | 16,200 | 12,505 | 91.7% | 2.6% | 2.1% | 0.4% | $65k | 14.8% | 17.9% | 19.3% | 74.9% | 15.9% | 0.9% |
| Cedar (in district) | 14,613 | 11,103 | 92.1% | 2.2% | 0.5% | 0.0% | $53k | 19.0% | 15.8% | 23.1% | 74.1% | 17.0% | 0.5% |
| Barton (in district) | 11,670 | 8,936 | 89.9% | 3.0% | 0.2% | 0.4% | $53k | 17.4% | 16.7% | 21.4% | 68.1% | 20.2% | 0.9% |
| Howard (in district) | 10,286 | 8,111 | 86.0% | 2.3% | 5.7% | 0.2% | $69k | 28.0% | 24.0% | 20.0% | 78.6% | 12.1% | 0.6% |
| St. Clair (in district) | 9,575 | 7,539 | 92.8% | 2.2% | 0.8% | 0.2% | $54k | 14.7% | 13.9% | 25.6% | 76.0% | 14.7% | 0.7% |
| Hickory (in district) | 8,581 | 7,092 | 93.4% | 1.8% | 0.1% | 0.5% | $41k | 12.8% | 10.8% | 32.3% | 82.5% | 19.8% | 0.3% |
| Dade (in district) | 7,638 | 6,050 | 92.0% | 2.3% | 0.4% | 0.1% | $55k | 15.1% | 13.1% | 24.6% | 77.0% | 12.6% | 0.8% |
Cass: 47 precincts
| Precinct | Population | Voting-age pop. | % White non-Hisp. | % Hispanic | % Black | % Asian | Median income* | % Bachelor's+ | % 18-29 (of adults) | % 65+ | % Homeowners | % Below poverty | % Spanish at home (adults) |
|---|---|---|---|---|---|---|---|---|---|---|---|---|---|
| No. 1 - Sherman | 1,017 | 786 | 96.0% | 2.6% | 0.1% | 0.3% | $79k | 19.8% | 22.3% | 17.8% | 81.8% | 7.6% | 0.6% |
| No. 10 - Grand River | 3,437 | 2,708 | 90.4% | 1.6% | 1.0% | 0.0% | $92k | 17.8% | 11.6% | 19.6% | 90.7% | 2.5% | 0.2% |
| No. 11 - Grand River, Ward 1 | 1,701 | 1,477 | 93.3% | 0.7% | 0.0% | 0.5% | $49k | 15.7% | 14.3% | 23.7% | 57.8% | 5.6% | 2.7% |
| No. 12 - Grand River, Ward 2 | 2,202 | 1,682 | 90.6% | 5.9% | 0.0% | 0.4% | $77k | 19.8% | 18.3% | 15.2% | 55.8% | 9.1% | 3.8% |
| No. 13 - Grand River, Ward 3 | 2,860 | 2,049 | 90.7% | 2.5% | 1.2% | 0.2% | $64k | 9.5% | 19.0% | 11.9% | 61.1% | 3.5% | 1.8% |
| No. 14 - Grand River, Ward 4 | 1,833 | 1,266 | 91.4% | 3.0% | 0.4% | 0.1% | $83k | 15.2% | 22.9% | 16.6% | 79.9% | 1.3% | 0.7% |
| No. 15 - Camp Branch | 693 | 533 | 88.9% | 3.6% | 0.0% | 0.0% | $96k | 14.0% | 17.1% | 22.3% | 79.4% | 3.4% | 0.1% |
| No. 16 - Camp Branch | 969 | 713 | 94.2% | 2.7% | 0.4% | 0.0% | $93k | 20.7% | 13.4% | 17.8% | 97.4% | 14.9% | 9.6% |
| No. 17 - Index | 442 | 344 | 89.3% | 4.1% | 0.0% | 0.0% | $104k | 15.8% | 15.6% | 22.7% | 83.5% | 3.2% | 0.1% |
| No. 18 - Index | 630 | 462 | 94.4% | 2.6% | 0.4% | 0.0% | $91k | 20.6% | 13.5% | 17.6% | 97.3% | 15.3% | 9.9% |
| No. 19 - Polk | 2,533 | 1,994 | 91.5% | 3.9% | 0.6% | 0.0% | $120k | 34.4% | 16.7% | 16.4% | 94.5% | 3.4% | 0.6% |
| No. 2 - Dayton | 728 | 563 | 96.4% | 1.2% | 0.3% | 0.1% | $102k | 20.0% | 15.9% | 20.6% | 86.8% | 6.5% | 0.3% |
| No. 20 - Pleasant Hill | 2,519 | 1,970 | 84.7% | 8.4% | 0.3% | 0.5% | $91k | 41.0% | 22.9% | 17.8% | 62.9% | 4.2% | 2.9% |
| No. 21 - Pleasant Hill | 2,314 | 1,755 | 89.9% | 0.8% | 0.6% | 0.5% | $113k | 31.9% | 19.9% | 16.7% | 91.3% | 6.8% | 0.2% |
| No. 22 - Pleasant Hill | 2,323 | 1,914 | 89.0% | 7.6% | 0.0% | 1.1% | $65k | 22.7% | 33.6% | 17.2% | 51.9% | 7.8% | 6.8% |
| No. 23 - Pleasant Hill | 2,413 | 1,878 | 85.9% | 8.3% | 0.5% | 0.5% | $99k | 27.9% | 25.8% | 16.6% | 79.9% | 5.6% | 7.6% |
| No. 24 - Peculiar | 2,821 | 2,194 | 99.4% | 0.4% | 0.0% | 0.0% | $122k | 27.1% | 15.5% | 16.7% | 90.9% | 9.9% | 0.0% |
| No. 25 - West Peculiar | 3,563 | 2,724 | 85.2% | 3.0% | 6.4% | 0.1% | $102k | 33.7% | 9.1% | 20.3% | 86.3% | 2.7% | 0.4% |
| No. 26 - West Peculiar | 4,747 | 3,308 | 81.0% | 9.2% | 2.8% | 0.0% | $104k | 26.3% | 20.8% | 13.6% | 77.7% | 4.3% | 1.1% |
| No. 27 - Union | 1,811 | 1,401 | 84.8% | 9.8% | 4.6% | 0.3% | $85k | 30.0% | 11.1% | 18.7% | 80.4% | 4.1% | 5.6% |
| No. 28 - Big Creek | 3,305 | 2,576 | 91.2% | 1.3% | 1.2% | 0.0% | $142k | 51.3% | 10.5% | 19.7% | 98.0% | 1.2% | 0.5% |
| No. 29 - Big Creek | 2,506 | 2,068 | 89.4% | 1.0% | 4.3% | 0.2% | $128k | 62.7% | 12.0% | 25.4% | 96.6% | 1.9% | 0.1% |
| No. 3 - Garden City | 856 | 624 | 87.7% | 1.8% | 0.0% | 0.0% | $67k | 6.8% | 22.9% | 21.1% | 64.6% | 4.2% | 0.2% |
| No. 30 - Raymore | 5,466 | 4,115 | 85.5% | 3.7% | 4.2% | 0.7% | $102k | 29.7% | 15.0% | 18.2% | 80.9% | 9.4% | 1.4% |
| No. 31 - Raymore, Ward 3 | 1,913 | 1,663 | 83.8% | 3.5% | 5.4% | 0.0% | $92k | 34.5% | 12.2% | 39.2% | 64.5% | 5.5% | 1.1% |
| No. 32 - Raymore, Ward 2 | 1,932 | 1,366 | 80.6% | 12.7% | 1.1% | 1.9% | $97k | 39.8% | 17.1% | 12.7% | 83.2% | 4.9% | 0.8% |
| No. 33 - Raymore, Ward 2 | 2,110 | 1,730 | 77.2% | 5.7% | 4.4% | 6.6% | $107k | 44.9% | 14.6% | 27.0% | 92.1% | 3.4% | 0.7% |
| No. 34 - Raymore, Wards 3 & 4 | 5,429 | 4,273 | 76.9% | 4.0% | 8.1% | 0.7% | $124k | 37.1% | 19.1% | 16.7% | 86.5% | 5.0% | 1.1% |
| No. 35 - Raymore, Ward 4 | 2,504 | 1,815 | 88.2% | 4.2% | 2.6% | 0.3% | $84k | 27.8% | 17.6% | 18.7% | 66.0% | 9.7% | 1.5% |
| No. 36 - Kansas City | 2,697 | 2,252 | 82.1% | 9.3% | 2.1% | 0.9% | $102k | 38.4% | 14.7% | 20.7% | 95.4% | 6.5% | 3.4% |
| No. 37 - Mt Pleasant | 831 | 665 | 82.6% | 7.8% | 3.5% | 2.9% | $91k | 26.9% | 11.3% | 18.5% | 98.6% | 6.7% | 6.7% |
| No. 38 - Mt Pleasant, NE Ward 1 | 2,317 | 1,999 | 88.6% | 1.6% | 0.7% | 3.3% | $98k | 46.3% | 30.2% | 9.4% | 80.4% | 2.1% | 0.2% |
| No. 39 - Mt Pleasant, NE Ward 1 | 3,425 | 2,461 | 82.9% | 1.7% | 3.0% | 3.6% | $73k | 33.4% | 19.8% | 15.2% | 65.9% | 7.7% | 1.2% |
| No. 4 - Austin | 486 | 377 | 96.6% | 0.0% | 0.5% | 0.0% | $119k | 20.1% | 10.8% | 22.9% | 90.8% | 5.7% | 0.0% |
| No. 40 - Mt Pleasant, NW Ward 2 | 3,235 | 2,697 | 79.3% | 6.3% | 11.2% | 0.2% | $77k | 34.1% | 13.9% | 25.8% | 71.4% | 8.0% | 2.4% |
| No. 41 - Mt Pleasant, NW Ward 2 | 2,738 | 1,826 | 75.1% | 14.6% | 2.6% | 0.1% | $76k | 18.1% | 22.7% | 13.6% | 59.8% | 9.4% | 0.7% |
| No. 42 - Mt Pleasant, SW Ward 3 | 3,829 | 2,657 | 70.1% | 15.2% | 2.8% | 2.0% | $70k | 16.5% | 20.0% | 12.5% | 64.1% | 12.1% | 3.5% |
| No. 43 - Mt Pleasant, SW Ward 3 | 1,257 | 1,005 | 89.1% | 4.4% | 2.1% | 0.0% | $79k | 19.7% | 21.8% | 12.5% | 76.1% | 5.1% | 0.2% |
| No. 44 - Mt Pleasant, SW Ward 4 | 3,984 | 3,168 | 70.1% | 5.4% | 22.4% | 0.0% | $65k | 21.0% | 24.0% | 16.6% | 33.5% | 15.7% | 2.1% |
| No. 45 - Mt Pleasant, SE Ward 4 | 3,301 | 2,609 | 75.7% | 6.1% | 9.8% | 0.0% | $59k | 20.8% | 18.9% | 16.3% | 49.9% | 11.0% | 2.4% |
| No. 46 - Mt Pleasant | 2,067 | 1,599 | 72.9% | 8.3% | 10.3% | 0.7% | $77k | 25.3% | 10.2% | 26.9% | 76.5% | 9.4% | 3.7% |
| No. 47 - Raymore, Ward 1 | 6,759 | 4,813 | 65.6% | 11.4% | 17.5% | 0.5% | $110k | 41.2% | 16.2% | 14.1% | 76.3% | 3.7% | 3.4% |
| No. 5 - Austin | 1,958 | 1,369 | 92.3% | 1.2% | 0.5% | 2.3% | $90k | 24.8% | 16.3% | 19.0% | 78.2% | 3.9% | 1.0% |
| No. 6 - Everett | 388 | 347 | 86.1% | 5.8% | 0.0% | 1.3% | $86k | 20.9% | 18.9% | 27.2% | 96.1% | 4.3% | 1.3% |
| No. 7 - Coldwater | 1,197 | 918 | 87.9% | 4.1% | 0.0% | 3.4% | $67k | 21.1% | 17.9% | 20.7% | 74.8% | 5.0% | 0.4% |
| No. 8 - West Dolan | 963 | 674 | 94.9% | 3.9% | 0.0% | 0.2% | $116k | 19.7% | 11.2% | 19.0% | 95.3% | 2.1% | 2.6% |
| No. 9 - Dolan | 1,742 | 1,322 | 95.5% | 1.2% | 0.3% | 0.7% | $94k | 22.9% | 9.3% | 17.0% | 81.4% | 3.3% | 1.2% |
Boone: 53 precincts
| Precinct | Population | Voting-age pop. | % White non-Hisp. | % Hispanic | % Black | % Asian | Median income* | % Bachelor's+ | % 18-29 (of adults) | % 65+ | % Homeowners | % Below poverty | % Spanish at home (adults) |
|---|---|---|---|---|---|---|---|---|---|---|---|---|---|
| 11 | 380 | 304 | 84.6% | 3.2% | 0.0% | 0.0% | $79k | 41.9% | 18.8% | 23.6% | 88.5% | 8.5% | 0.0% |
| Voting District 07 | 3,354 | 2,509 | 82.8% | 4.6% | 1.1% | 0.1% | $100k | 30.5% | 10.9% | 19.2% | 92.1% | 8.1% | 1.5% |
| Voting District 08 | 2,707 | 1,988 | 88.5% | 3.8% | 0.8% | 0.4% | $93k | 28.0% | 22.1% | 15.8% | 78.6% | 6.7% | 1.0% |
| Voting District 09 | 4,080 | 3,192 | 90.6% | 3.1% | 0.1% | 0.0% | $69k | 35.1% | 22.9% | 19.2% | 74.9% | 11.5% | 0.0% |
| Voting District 10 | 911 | 732 | 81.0% | 3.6% | 0.0% | 0.0% | $79k | 37.9% | 20.9% | 21.1% | 84.9% | 8.0% | 0.0% |
| Voting District 12 | 263 | 218 | 86.5% | 5.3% | 0.3% | 0.0% | $46k | 20.0% | 31.6% | 17.9% | 46.6% | 19.7% | 0.0% |
| Voting District 15 | 1,895 | 1,481 | 82.9% | 2.0% | 4.6% | 1.4% | $84k | 31.0% | 15.5% | 18.3% | 81.2% | 9.8% | 1.2% |
| Voting District 16 | 3,330 | 2,227 | 90.9% | 3.1% | 1.7% | 0.4% | $80k | 34.4% | 19.2% | 14.4% | 80.4% | 15.3% | 1.5% |
| Voting District 17 | 2,296 | 1,662 | 85.3% | 3.6% | 3.6% | 3.6% | $72k | 42.0% | 21.7% | 15.3% | 74.2% | 18.6% | 2.9% |
| Voting District 18 | 1,343 | 1,047 | 89.2% | 1.0% | 1.0% | 4.1% | $99k | 49.1% | 12.6% | 22.5% | 90.4% | 7.1% | 3.0% |
| Voting District 19 | 738 | 605 | 97.0% | 0.4% | 0.6% | 0.1% | $140k | 59.6% | 7.4% | 24.2% | 91.0% | 3.9% | 0.4% |
| Voting District 1A | 2,351 | 1,943 | 60.6% | 1.8% | 28.1% | 1.4% | $38k | 24.3% | 44.8% | 5.1% | 10.0% | 45.7% | 0.7% |
| Voting District 1C | 1,597 | 1,367 | 75.6% | 4.1% | 9.2% | 0.8% | $54k | 54.6% | 21.4% | 13.8% | 47.5% | 23.4% | 1.3% |
| Voting District 1D | 2,669 | 1,950 | 40.2% | 5.3% | 41.7% | 5.4% | $36k | 27.7% | 42.7% | 6.0% | 15.5% | 45.8% | 3.1% |
| Voting District 1F | 475 | 436 | 75.1% | 5.8% | 4.6% | 3.1% | $53k | 48.7% | 26.6% | 24.8% | 49.2% | 6.8% | 0.4% |
| Voting District 1G | 1,146 | 949 | 71.7% | 6.2% | 9.6% | 0.9% | $47k | 48.1% | 19.0% | 24.6% | 64.3% | 28.7% | 2.1% |
| Voting District 1J | 1,684 | 1,511 | 64.5% | 3.6% | 23.6% | 2.6% | $35k | 46.1% | 41.2% | 9.9% | 21.2% | 27.5% | 3.1% |
| Voting District 1K | 1,235 | 1,088 | 86.8% | 3.4% | 0.0% | 5.9% | $59k | 63.2% | 40.1% | 17.3% | 42.8% | 7.8% | 0.0% |
| Voting District 1L | 322 | 312 | 84.5% | 0.0% | 0.0% | 12.0% | $50k | 64.3% | 56.5% | 3.1% | 14.1% | 7.6% | 0.0% |
| Voting District 1M | 1,697 | 1,679 | 75.7% | 5.1% | 8.1% | 6.8% | $20k | 32.6% | 84.2% | 1.1% | 0.7% | 73.3% | 1.0% |
| Voting District 20 | 2,739 | 2,112 | 68.4% | 3.7% | 13.2% | 6.7% | $85k | 47.8% | 12.9% | 21.6% | 77.1% | 14.1% | 2.0% |
| Voting District 21 | 1,877 | 1,378 | 71.4% | 6.2% | 9.9% | 8.3% | $92k | 68.5% | 23.1% | 11.4% | 61.3% | 15.6% | 1.4% |
| Voting District 22 | 3,166 | 2,445 | 65.3% | 13.2% | 10.2% | 4.6% | $82k | 49.8% | 25.6% | 8.2% | 77.9% | 9.6% | 8.3% |
| Voting District 23 | 834 | 676 | 74.2% | 8.4% | 10.3% | 1.5% | $75k | 43.7% | 18.4% | 23.7% | 81.1% | 18.2% | 3.6% |
| Voting District 24 | 3,571 | 2,765 | 79.3% | 2.9% | 7.1% | 4.3% | $88k | 44.8% | 19.4% | 18.4% | 79.9% | 11.7% | 1.1% |
| Voting District 2A | 1,243 | 1,104 | 73.6% | 6.0% | 15.5% | 0.3% | $86k | 55.2% | 19.7% | 17.5% | 80.7% | 5.0% | 2.7% |
| Voting District 2B | 1,447 | 1,043 | 73.2% | 4.1% | 15.1% | 1.2% | $76k | 42.3% | 17.9% | 18.1% | 71.4% | 15.0% | 4.7% |
| Voting District 2C | 2,208 | 1,376 | 62.9% | 1.0% | 22.9% | 1.8% | $103k | 35.6% | 12.2% | 12.1% | 89.0% | 2.8% | 0.1% |
| Voting District 2D | 2,496 | 1,826 | 60.8% | 9.8% | 18.4% | 4.9% | $81k | 44.9% | 17.3% | 13.0% | 49.5% | 7.2% | 4.3% |
| Voting District 2F | 1,985 | 1,441 | 72.2% | 14.9% | 6.3% | 3.1% | $124k | 69.4% | 25.8% | 10.0% | 78.5% | 2.1% | 15.7% |
| Voting District 2G | 659 | 587 | 70.1% | 4.8% | 18.7% | 0.8% | $70k | 45.7% | 21.4% | 18.9% | 56.1% | 13.8% | 1.3% |
| Voting District 2H | 1,594 | 1,240 | 64.6% | 3.8% | 25.2% | 0.1% | $72k | 30.5% | 19.1% | 10.9% | 57.3% | 20.6% | 0.0% |
| Voting District 2I | 1,070 | 802 | 59.6% | 19.8% | 10.4% | 5.7% | $103k | 60.6% | 22.5% | 7.6% | 84.9% | 3.3% | 15.1% |
| Voting District 2J | 1,214 | 1,038 | 64.1% | 15.1% | 15.1% | 3.8% | $65k | 40.6% | 36.0% | 11.1% | 46.2% | 14.2% | 14.1% |
| Voting District 2K | 1,302 | 1,020 | 79.1% | 3.7% | 6.0% | 6.4% | $87k | 69.0% | 20.1% | 23.8% | 81.1% | 10.5% | 0.0% |
| Voting District 2L | 1,012 | 873 | 71.1% | 6.9% | 14.2% | 3.3% | $64k | 29.1% | 14.5% | 28.2% | 11.1% | 16.8% | 0.1% |
| Voting District 39 | 2,118 | 1,614 | 88.6% | 2.7% | 1.9% | 2.6% | $86k | 28.3% | 15.5% | 17.3% | 84.4% | 7.0% | 2.1% |
| Voting District 3A | 2,172 | 1,702 | 60.1% | 1.5% | 20.4% | 12.6% | $76k | 42.5% | 24.3% | 11.8% | 67.2% | 10.4% | 1.6% |
| Voting District 3B | 3,307 | 2,517 | 48.9% | 4.9% | 38.8% | 1.7% | $64k | 26.9% | 28.3% | 17.0% | 45.8% | 11.4% | 3.4% |
| Voting District 3C | 2,946 | 2,133 | 53.4% | 4.3% | 28.6% | 1.6% | $47k | 35.3% | 28.1% | 16.0% | 37.8% | 19.0% | 2.4% |
| Voting District 3D | 2,518 | 2,158 | 71.6% | 2.2% | 10.9% | 9.8% | $37k | 49.4% | 41.7% | 6.9% | 22.2% | 32.1% | 1.4% |
| Voting District 3F | 2,695 | 2,186 | 70.4% | 3.2% | 17.5% | 0.0% | $67k | 42.3% | 28.9% | 10.8% | 47.7% | 9.0% | 2.4% |
| Voting District 3G | 210 | 170 | 50.6% | 0.9% | 16.7% | 26.2% | $78k | 38.3% | 31.3% | 12.2% | 57.8% | 6.6% | 1.1% |
| Voting District 3H | 1,227 | 1,024 | 68.4% | 5.5% | 18.3% | 3.7% | $43k | 43.9% | 32.9% | 13.1% | 35.7% | 10.0% | 2.4% |
| Voting District 3I | 160 | 133 | 60.8% | 12.5% | 22.3% | 1.7% | $51k | 39.1% | 30.1% | 21.0% | 50.9% | 20.6% | 5.5% |
| Voting District 3J | 89 | 69 | 78.2% | 6.7% | 2.5% | 6.1% | $77k | 47.3% | 19.0% | 18.9% | 85.6% | 12.9% | 4.9% |
| Voting District 3L | 94 | 69 | 67.2% | 1.8% | 23.7% | 3.2% | $78k | 52.3% | 28.5% | 9.4% | 75.0% | 21.5% | 1.2% |
| Voting District 3N | 522 | 404 | 76.8% | 4.9% | 13.5% | 0.6% | $56k | 31.9% | 36.6% | 7.7% | 16.4% | 12.8% | 4.3% |
| Voting District 40 | 1,099 | 855 | 58.1% | 4.8% | 24.1% | 3.5% | $64k | 27.2% | 17.7% | 12.5% | 57.2% | 22.8% | 0.2% |
| Voting District 41 | 2,502 | 1,995 | 77.1% | 4.3% | 11.1% | 1.2% | $67k | 42.3% | 29.0% | 11.2% | 49.4% | 10.0% | 3.2% |
| Voting District 45 | 534 | 405 | 66.7% | 2.2% | 25.3% | 1.3% | $77k | 39.8% | 23.6% | 9.4% | 64.3% | 19.5% | 0.1% |
| Voting District 4F | 848 | 659 | 90.1% | 4.7% | 0.1% | 2.6% | $237k | 82.9% | 34.0% | 9.7% | 79.0% | 17.4% | 4.6% |
| Voting District 6A | 2,474 | 2,383 | 81.4% | 3.5% | 3.1% | 5.8% | $35k | 55.9% | 78.9% | 7.3% | 20.1% | 51.4% | 3.3% |
Jackson: 58 precincts
| Precinct | Population | Voting-age pop. | % White non-Hisp. | % Hispanic | % Black | % Asian | Median income* | % Bachelor's+ | % 18-29 (of adults) | % 65+ | % Homeowners | % Below poverty | % Spanish at home (adults) |
|---|---|---|---|---|---|---|---|---|---|---|---|---|---|
| Prairie 52 Voting District | 2,664 | 1,848 | 70.7% | 2.8% | 9.4% | 6.8% | $103k | 37.9% | 9.3% | 14.1% | 58.8% | 10.1% | 0.8% |
| Prairie 56 Voting District | 11 | 9 | 96.6% | 1.0% | 0.0% | 1.0% | $159k | 53.7% | 7.5% | 29.7% | 94.0% | 3.0% | 0.3% |
| Prarie 58 Voting District | 84 | 63 | 75.0% | 12.4% | 0.6% | 1.8% | $174k | 47.6% | 10.7% | 26.2% | 98.0% | 1.2% | 16.8% |
| Prarie 61 Voting District | 66 | 57 | 95.4% | 0.2% | 0.0% | 0.8% | $115k | 48.7% | 6.9% | 19.4% | 96.1% | 3.0% | 0.5% |
| Prarie 63 Voting District | 17 | 13 | 75.1% | 12.2% | 0.8% | 1.8% | $174k | 47.5% | 10.7% | 26.3% | 98.0% | 1.2% | 16.5% |
| Sni-A-Bar 05 Voting District | 1,796 | 1,398 | 83.1% | 4.1% | 5.5% | 0.5% | $115k | 53.9% | 8.5% | 16.6% | 91.4% | 2.1% | 0.1% |
| Sni-A-Bar 07 Voting District | 2,996 | 2,266 | 69.6% | 12.4% | 9.1% | 0.7% | $102k | 46.3% | 11.9% | 10.2% | 80.9% | 11.5% | 4.0% |
| Sni-A-Bar 08 Voting District | 3,308 | 2,274 | 86.7% | 7.8% | 1.5% | 1.5% | $92k | 46.1% | 14.4% | 17.7% | 79.4% | 7.3% | 2.4% |
| Sni-A-Bar 09 Voting District | 947 | 738 | 93.6% | 4.4% | 0.5% | 0.2% | $102k | 36.5% | 22.0% | 16.7% | 88.0% | 5.9% | 2.1% |
| Sni-A-Bar 10 Voting District | 1,311 | 860 | 87.2% | 2.1% | 0.5% | 2.0% | $104k | 45.4% | 6.7% | 12.8% | 87.0% | 8.9% | 1.5% |
| Sni-A-Bar 11 Voting District | 1,466 | 1,008 | 86.1% | 5.9% | 7.2% | 0.1% | $128k | 47.3% | 20.4% | 10.8% | 98.7% | 11.8% | 3.1% |
| Sni-A-Bar 12 Voting District | 2,329 | 1,717 | 82.4% | 4.6% | 0.5% | 6.0% | $138k | 54.1% | 16.7% | 16.3% | 89.7% | 1.4% | 3.6% |
| Sni-A-Bar 13 Voting District | 2,132 | 1,527 | 84.2% | 8.5% | 0.4% | 0.6% | $93k | 29.3% | 11.4% | 14.8% | 51.9% | 6.6% | 8.0% |
| Sni-A-Bar 14 Voting District | 2,051 | 1,627 | 83.8% | 7.6% | 4.3% | 1.1% | $123k | 33.5% | 10.4% | 11.9% | 93.3% | 6.0% | 5.1% |
| Sni-A-Bar 15 Voting District | 1,556 | 1,153 | 64.4% | 5.7% | 26.5% | 0.0% | $82k | 22.4% | 18.1% | 20.4% | 45.0% | 4.9% | 1.9% |
| Sni-A-Bar 16 Voting District | 1,672 | 1,163 | 85.0% | 4.7% | 9.1% | 0.0% | $78k | 16.8% | 14.8% | 26.6% | 57.8% | 1.7% | 2.7% |
| Sni-A-Bar 20 Voting District | 2,718 | 2,057 | 67.8% | 13.9% | 16.3% | 0.0% | $68k | 20.8% | 24.9% | 10.9% | 26.9% | 4.9% | 2.3% |
| Sni-A-Bar 21 Voting District | 3,111 | 2,133 | 75.0% | 4.2% | 9.5% | 3.2% | $74k | 27.9% | 14.5% | 12.6% | 64.4% | 5.4% | 2.9% |
| Sni-A-Bar 23 Voting District | 2,502 | 1,822 | 84.9% | 4.6% | 6.2% | 0.3% | $62k | 24.3% | 10.1% | 16.5% | 69.4% | 21.4% | 2.6% |
| Sni-A-Bar 29 Voting District | 2,906 | 2,021 | 66.2% | 13.7% | 8.7% | 1.7% | $74k | 25.1% | 20.2% | 10.9% | 65.4% | 18.2% | 12.9% |
| Sni-A-Bar 30 Voting District | 3,246 | 2,500 | 81.3% | 2.4% | 9.2% | 0.2% | $67k | 25.2% | 19.2% | 10.5% | 68.0% | 2.4% | 4.7% |
| Sni-A-Bar 31 Voting District | 1,782 | 1,275 | 80.2% | 1.2% | 6.7% | 4.2% | $97k | 31.1% | 9.5% | 15.6% | 63.2% | 9.6% | 0.0% |
| Sni-A-Bar 32 Voting District | 2,017 | 1,479 | 80.6% | 7.3% | 4.3% | 0.4% | $93k | 45.1% | 29.5% | 16.2% | 76.8% | 2.6% | 5.0% |
| Sni-A-Bar 33 Voting District | 1,287 | 881 | 73.1% | 2.6% | 7.5% | 4.1% | $132k | 40.7% | 10.7% | 14.5% | 72.1% | 6.4% | 1.6% |
| Sni-A-Bar 37 Voting District | 3,371 | 2,217 | 79.0% | 1.5% | 11.9% | 1.8% | $110k | 34.4% | 9.5% | 11.8% | 83.4% | 3.4% | 1.7% |
| Sni-A-Bar 38 Voting District | 3,838 | 2,594 | 70.6% | 23.6% | 1.8% | 0.2% | $87k | 25.6% | 16.8% | 12.0% | 84.5% | 21.6% | 4.3% |
| Sni-A-Bar 39 Voting District | 3,279 | 2,630 | 88.2% | 3.9% | 4.0% | 0.0% | $68k | 19.9% | 19.2% | 24.7% | 48.8% | 12.7% | 1.5% |
| Sni-A-Bar 40 Voting District | 2,303 | 1,726 | 86.9% | 5.2% | 3.4% | 1.1% | $103k | 33.4% | 12.8% | 14.0% | 87.3% | 5.5% | 0.8% |
| Sni-A-Bar 41 Voting District | 1,895 | 1,435 | 79.0% | 13.3% | 1.9% | 0.0% | $70k | 31.0% | 24.2% | 7.3% | 47.5% | 6.8% | 9.8% |
| Sni-A-Bar 42 Voting District | 3,230 | 2,195 | 82.3% | 7.0% | 2.5% | 1.0% | $111k | 25.3% | 26.0% | 7.7% | 54.4% | 2.3% | 2.1% |
| Sni-A-Bar 43 Voting District | 467 | 386 | 88.0% | 4.0% | 0.2% | 2.7% | $69k | 27.4% | 9.3% | 21.9% | 95.5% | 6.5% | 0.0% |
| Sni-A-Bar 44 Voting District | 2,164 | 1,581 | 83.8% | 3.7% | 8.2% | 1.2% | $100k | 18.3% | 24.0% | 11.5% | 67.4% | 4.5% | 2.9% |
| Sni-A-Bar 45 Voting District | 2,372 | 1,857 | 88.5% | 5.3% | 1.4% | 0.4% | $81k | 14.7% | 15.5% | 19.9% | 69.2% | 8.7% | 2.2% |
| Sni-A-Bar 46 Voting District | 1,363 | 1,155 | 91.9% | 0.2% | 3.5% | 0.9% | $71k | 16.8% | 34.9% | 11.7% | 75.4% | 7.9% | 0.2% |
| Sni-A-Bar 47 Voting District | 1,532 | 1,056 | 92.7% | 2.7% | 1.0% | 0.9% | $78k | 18.7% | 28.1% | 10.3% | 40.1% | 14.3% | 0.7% |
| Sni-A-Bar 48 Voting District | 1,183 | 852 | 92.2% | 4.0% | 0.5% | 1.1% | $78k | 15.9% | 24.2% | 12.4% | 50.0% | 9.1% | 1.7% |
| Sni-A-Bar 49 Voting District | 372 | 259 | 95.8% | 1.7% | 0.0% | 0.0% | $93k | 14.2% | 16.3% | 13.3% | 71.2% | 7.7% | 5.0% |
| Sni-A-Bar 50 Voting District | 417 | 308 | 90.7% | 3.0% | 3.5% | 0.3% | $121k | 36.7% | 12.2% | 14.8% | 94.1% | 3.9% | 0.4% |
| Sni-A-Bar 51 Voting District | 627 | 490 | 91.5% | 1.3% | 1.5% | 0.7% | $115k | 32.5% | 14.6% | 19.2% | 95.6% | 2.6% | 0.5% |
| Sni-A-Bar 52 Voting District | 2 | 1 | 99.4% | 0.0% | 0.0% | 0.0% | $97k | 35.9% | 10.5% | 20.1% | 96.9% | 0.0% | 0.0% |
| Sni-A-Bar 83 Voting District | 31 | 21 | 88.5% | 4.1% | 7.4% | 0.0% | $76k | 12.1% | 12.4% | 28.2% | 60.2% | 1.0% | 2.6% |
| Van Buren 01 Voting District | 143 | 103 | 71.7% | 9.5% | 5.1% | 9.2% | $125k | 50.1% | 12.6% | 16.8% | 79.7% | 4.9% | 5.9% |
| Van Buren 02 Voting District | 834 | 672 | 89.1% | 5.0% | 0.2% | 1.2% | $163k | 51.8% | 8.5% | 28.5% | 95.3% | 2.4% | 5.6% |
| Van Buren 03 Voting District | 359 | 296 | 93.4% | 2.6% | 0.2% | 1.2% | $160k | 52.9% | 7.9% | 29.0% | 94.3% | 2.9% | 2.3% |
| Van Buren 04 Voting District | 1 | 1 | 91.7% | 0.8% | 3.8% | 1.5% | $153k | 45.2% | 8.8% | 31.6% | 98.1% | 2.3% | 0.0% |
| Van Buren 07 Voting District | 374 | 281 | 75.8% | 12.0% | 0.7% | 1.7% | $174k | 47.8% | 10.5% | 26.4% | 97.9% | 1.2% | 16.1% |
| Van Buren 08 Voting District | 302 | 258 | 95.3% | 0.2% | 0.0% | 0.8% | $115k | 48.7% | 6.9% | 19.4% | 96.1% | 3.0% | 0.5% |
| Van Buren 09 Voting District | 209 | 169 | 89.4% | 4.8% | 0.2% | 1.2% | $163k | 51.8% | 8.5% | 28.5% | 95.3% | 2.4% | 5.4% |
| Van Buren 10 Voting District | 368 | 250 | 85.8% | 3.0% | 0.2% | 5.0% | $120k | 34.2% | 12.0% | 12.0% | 91.0% | 5.2% | 0.8% |
| Van Buren 11 Voting District | 772 | 563 | 88.6% | 2.2% | 0.2% | 3.8% | $118k | 39.2% | 10.3% | 14.1% | 92.8% | 4.6% | 0.7% |
| Van Buren 12 Voting District | 1,089 | 797 | 73.5% | 8.8% | 4.7% | 8.4% | $120k | 48.4% | 12.0% | 17.1% | 79.6% | 5.6% | 5.4% |
| Van Buren 13 Voting District | 1,171 | 876 | 81.3% | 9.4% | 0.5% | 1.3% | $158k | 45.9% | 10.4% | 22.7% | 96.6% | 2.5% | 12.1% |
| Van Buren 14 Voting District | 427 | 365 | 95.3% | 0.2% | 0.0% | 0.8% | $115k | 48.7% | 6.9% | 19.4% | 96.1% | 3.0% | 0.5% |
| Van Buren 15 Voting District | 260 | 209 | 93.7% | 0.0% | 0.4% | 0.0% | $82k | 30.1% | 5.2% | 20.2% | 79.6% | 13.9% | 0.0% |
| Van Buren 16 Voting District | 154 | 114 | 96.4% | 2.6% | 0.0% | 0.0% | $121k | 40.1% | 10.3% | 13.9% | 92.4% | 6.5% | 1.1% |
| Van Buren 17 Voting District | 499 | 401 | 93.7% | 0.0% | 0.4% | 0.0% | $82k | 30.2% | 5.2% | 20.2% | 79.7% | 13.9% | 0.0% |
| Van Buren 18 Voting District | 239 | 175 | 96.4% | 2.6% | 0.0% | 0.0% | $123k | 40.5% | 10.5% | 13.7% | 93.0% | 6.2% | 1.1% |
| Van Buren 19 Voting District | 2,594 | 1,948 | 92.3% | 2.0% | 0.1% | 2.0% | $119k | 41.4% | 9.8% | 14.8% | 93.5% | 4.9% | 0.8% |
Johnson: 20 precincts
| Precinct | Population | Voting-age pop. | % White non-Hisp. | % Hispanic | % Black | % Asian | Median income* | % Bachelor's+ | % 18-29 (of adults) | % 65+ | % Homeowners | % Below poverty | % Spanish at home (adults) |
|---|---|---|---|---|---|---|---|---|---|---|---|---|---|
| Centerview Voting District | 1,882 | 1,529 | 91.0% | 2.1% | 1.4% | 0.3% | $77k | 29.9% | 19.9% | 26.3% | 83.7% | 5.1% | 0.7% |
| Chilhowee Voting District | 1,273 | 910 | 97.2% | 1.0% | 0.4% | 0.0% | $76k | 16.9% | 18.4% | 9.9% | 86.2% | 4.9% | 0.0% |
| Columbus Voting District | 1,666 | 1,260 | 94.0% | 1.1% | 0.2% | 1.1% | $84k | 19.9% | 10.9% | 16.5% | 92.3% | 4.6% | 0.5% |
| Hazel Hill Voting District | 1,444 | 1,056 | 89.4% | 1.2% | 1.5% | 4.3% | $63k | 23.4% | 13.5% | 16.8% | 94.6% | 14.1% | 0.0% |
| Jefferson Voting District | 565 | 476 | 94.0% | 0.2% | 0.2% | 0.7% | $60k | 31.4% | 14.3% | 24.2% | 75.5% | 11.7% | 1.9% |
| Kingsville Voting District | 1,343 | 952 | 86.1% | 2.5% | 4.2% | 0.0% | $84k | 19.6% | 9.8% | 14.4% | 89.4% | 6.9% | 1.3% |
| Knob Noster Voting District | 8,649 | 6,252 | 74.4% | 8.5% | 7.6% | 1.1% | $62k | 31.6% | 45.2% | 5.6% | 42.7% | 14.1% | 5.1% |
| Lowland Voting District | 755 | 473 | 98.0% | 0.2% | 0.6% | 0.0% | $88k | 25.5% | 13.1% | 11.9% | 92.9% | 11.9% | 0.2% |
| Montserrat Voting District | 1,720 | 1,454 | 91.3% | 4.2% | 1.9% | 1.2% | $70k | 24.5% | 41.3% | 11.9% | 59.5% | 10.9% | 1.7% |
| North Holden Voting District | 1,838 | 1,387 | 81.7% | 7.4% | 6.3% | 0.0% | $81k | 20.2% | 14.7% | 13.5% | 74.8% | 10.6% | 6.7% |
| Pittsville Voting District | 4,699 | 3,737 | 90.6% | 4.1% | 0.6% | 0.1% | $83k | 23.4% | 11.3% | 23.4% | 97.5% | 4.1% | 2.2% |
| Post Oak Voting District | 2,164 | 1,562 | 93.2% | 1.7% | 0.1% | 0.2% | $96k | 24.3% | 17.1% | 18.6% | 86.0% | 6.4% | 0.4% |
| Rose Hill Voting District | 1,103 | 800 | 87.7% | 5.6% | 0.1% | 0.0% | $73k | 8.1% | 12.8% | 17.4% | 90.6% | 10.5% | 0.0% |
| Simpson Voting District | 726 | 468 | 97.6% | 0.6% | 0.3% | 0.8% | $86k | 26.3% | 12.2% | 12.8% | 90.7% | 12.2% | 0.0% |
| South Holden Voting District | 1,635 | 1,249 | 87.6% | 4.2% | 3.5% | 0.0% | $68k | 23.6% | 10.6% | 16.4% | 74.8% | 18.6% | 1.6% |
| Warrensburg Northeast Voting District | 4,622 | 3,779 | 85.1% | 3.2% | 3.3% | 2.9% | $59k | 37.2% | 30.5% | 21.6% | 48.0% | 12.1% | 0.9% |
| Warrensburg Northwest Voting District | 4,331 | 3,334 | 81.1% | 7.5% | 6.8% | 1.2% | $68k | 34.7% | 27.0% | 15.9% | 43.9% | 9.4% | 4.8% |
| Warrensburg Southeast No. 1 Voting District | 4,701 | 3,630 | 74.8% | 11.2% | 4.0% | 2.2% | $83k | 33.9% | 29.0% | 8.1% | 69.1% | 7.9% | 0.4% |
| Warrensburg Southeast No. 2 Voting District | 4,575 | 4,004 | 75.4% | 5.0% | 9.8% | 4.2% | $58k | 30.4% | 66.9% | 6.1% | 40.0% | 24.3% | 1.1% |
| Warrensburg Southwest Voting District | 5,073 | 4,337 | 85.0% | 3.3% | 4.6% | 2.4% | $56k | 48.8% | 67.0% | 6.0% | 43.2% | 24.5% | 2.1% |
Pulaski: 8 precincts
| Precinct | Population | Voting-age pop. | % White non-Hisp. | % Hispanic | % Black | % Asian | Median income* | % Bachelor's+ | % 18-29 (of adults) | % 65+ | % Homeowners | % Below poverty | % Spanish at home (adults) |
|---|---|---|---|---|---|---|---|---|---|---|---|---|---|
| Big Piney Voting District | 1,360 | 1,279 | 66.5% | 9.4% | 8.4% | 3.1% | $50k | 19.6% | 45.1% | 14.0% | 78.7% | 8.2% | 6.4% |
| Crocker Voting District | 2,895 | 2,312 | 90.4% | 2.0% | 0.1% | 0.0% | $68k | 19.9% | 30.4% | 14.6% | 81.4% | 15.2% | 0.1% |
| Dixon Voting District | 4,321 | 3,488 | 94.4% | 1.4% | 0.3% | 0.0% | $62k | 15.4% | 30.4% | 13.6% | 78.9% | 14.4% | 0.3% |
| Laquey Voting District | 4,591 | 3,225 | 73.3% | 8.4% | 11.7% | 1.1% | $70k | 17.6% | 19.5% | 15.5% | 75.7% | 22.8% | 2.0% |
| Richland Voting District | 2,530 | 1,894 | 82.3% | 6.3% | 2.2% | 1.5% | $40k | 15.6% | 20.2% | 18.2% | 76.6% | 21.7% | 2.2% |
| St. Robert Voting District | 27,565 | 22,213 | 57.2% | 17.3% | 13.1% | 3.2% | $69k | 28.2% | 54.5% | 5.6% | 45.4% | 9.9% | 11.3% |
| Swedeborg Voting District | 486 | 414 | 89.2% | 1.9% | 0.1% | 0.0% | $67k | 22.7% | 15.4% | 22.2% | 84.5% | 10.1% | 0.0% |
| Waynesville Voting District | 10,163 | 7,297 | 75.5% | 6.3% | 10.7% | 1.4% | $77k | 34.5% | 26.0% | 11.6% | 64.4% | 10.0% | 2.2% |
Pettis: 26 precincts
| Precinct | Population | Voting-age pop. | % White non-Hisp. | % Hispanic | % Black | % Asian | Median income* | % Bachelor's+ | % 18-29 (of adults) | % 65+ | % Homeowners | % Below poverty | % Spanish at home (adults) |
|---|---|---|---|---|---|---|---|---|---|---|---|---|---|
| 1st Ward 1st Precinct | 1,147 | 907 | 62.7% | 19.1% | 4.9% | 0.4% | $46k | 8.8% | 20.2% | 18.5% | 69.8% | 22.1% | 5.6% |
| 1st Ward 2nd Precinct | 1,441 | 1,075 | 88.5% | 5.1% | 2.4% | 0.5% | $56k | 17.8% | 21.8% | 13.3% | 74.6% | 18.3% | 2.1% |
| 1st Ward 3rd Precinct | 2,086 | 1,675 | 82.6% | 3.8% | 6.2% | 2.5% | $40k | 19.8% | 18.7% | 23.3% | 29.4% | 23.7% | 0.3% |
| 2nd Ward 1st Precinct | 2,046 | 1,639 | 67.2% | 12.5% | 11.1% | 0.1% | $50k | 7.4% | 32.4% | 16.0% | 36.9% | 21.6% | 6.5% |
| 2nd Ward 2nd Precinct | 1,570 | 1,181 | 70.9% | 23.2% | 1.2% | 0.0% | $53k | 8.6% | 15.4% | 16.1% | 77.0% | 19.5% | 14.7% |
| 2nd Ward 3rd Precinct | 1,143 | 955 | 84.0% | 8.5% | 3.3% | 0.0% | $51k | 8.9% | 27.6% | 8.0% | 27.7% | 18.8% | 6.2% |
| 3rd Ward 1st Precinct | 2,009 | 1,465 | 80.2% | 7.2% | 3.6% | 3.5% | $59k | 17.9% | 15.5% | 15.5% | 69.4% | 11.4% | 2.1% |
| 3rd Ward 2nd Precinct | 1,596 | 1,114 | 55.4% | 30.7% | 6.4% | 1.5% | $58k | 21.6% | 27.9% | 9.5% | 61.3% | 20.7% | 17.1% |
| 3rd Ward 3rd Precinct | 1,233 | 846 | 61.3% | 23.1% | 2.4% | 0.0% | $50k | 16.2% | 18.2% | 12.7% | 69.9% | 23.4% | 10.7% |
| 4th Ward 1st Precinct | 1,647 | 1,259 | 66.5% | 19.7% | 4.7% | 2.6% | $58k | 16.5% | 25.8% | 11.6% | 59.8% | 13.7% | 15.0% |
| 4th Ward 2nd Precinct | 1,336 | 1,001 | 86.1% | 5.7% | 3.2% | 0.6% | $63k | 32.3% | 22.4% | 22.2% | 80.6% | 9.7% | 4.7% |
| 4th Ward 3rd Precinct | 2,049 | 1,556 | 67.1% | 25.9% | 1.2% | 0.3% | $56k | 6.5% | 28.5% | 10.2% | 64.0% | 18.7% | 16.1% |
| Bowling Green Voting District | 753 | 493 | 97.3% | 0.5% | 0.1% | 0.0% | $96k | 16.7% | 21.7% | 11.7% | 94.8% | 17.0% | 0.2% |
| Cedar Voting District | 1,141 | 740 | 74.2% | 14.2% | 2.3% | 0.1% | $52k | 20.5% | 17.6% | 15.3% | 67.3% | 34.4% | 5.4% |
| Dresden Voting District | 981 | 774 | 90.4% | 7.3% | 0.0% | 0.4% | $67k | 19.6% | 22.2% | 17.9% | 70.5% | 10.9% | 4.0% |
| Flat Creek Voting District | 2,294 | 1,719 | 96.5% | 0.1% | 0.1% | 0.0% | $69k | 22.8% | 12.0% | 22.7% | 84.3% | 11.2% | 0.1% |
| Green Ridge/Elk Fork/Washington Voting District | 3,016 | 2,296 | 95.0% | 2.7% | 0.3% | 0.3% | $72k | 21.9% | 13.6% | 20.5% | 89.0% | 13.2% | 1.0% |
| Houstonia Voting District | 384 | 329 | 98.0% | 0.3% | 0.1% | 0.2% | $58k | 19.6% | 12.6% | 24.2% | 92.1% | 6.7% | 0.4% |
| Hughesville Voting District | 513 | 437 | 97.7% | 0.4% | 0.0% | 0.1% | $57k | 19.7% | 12.4% | 24.5% | 92.2% | 8.1% | 0.4% |
| La Monte/Blackwater Voting District | 2,100 | 1,633 | 69.2% | 23.9% | 0.5% | 1.8% | $77k | 16.0% | 19.8% | 15.3% | 79.5% | 10.6% | 16.4% |
| Longwood/Heath Creek Voting District | 1,741 | 1,182 | 93.2% | 2.0% | 0.0% | 0.0% | $81k | 20.6% | 17.9% | 15.8% | 95.4% | 22.0% | 0.3% |
| Prairie Voting District | 2,783 | 2,005 | 95.5% | 2.4% | 0.5% | 0.1% | $91k | 32.6% | 12.3% | 21.8% | 72.4% | 6.3% | 1.5% |
| Sedalia East Voting District | 2,524 | 1,852 | 88.2% | 6.6% | 1.4% | 0.0% | $63k | 13.3% | 19.4% | 17.6% | 73.1% | 15.4% | 3.1% |
| Sedalia West Voting District | 2,039 | 1,507 | 89.3% | 5.5% | 3.5% | 0.5% | $75k | 30.3% | 17.2% | 22.0% | 73.6% | 6.5% | 5.2% |
| Smithton E & W/Lake Creek Voting District | 2,754 | 2,063 | 89.7% | 3.6% | 0.6% | 0.2% | $70k | 17.8% | 11.3% | 20.3% | 77.4% | 13.9% | 0.8% |
| Smithton W BP Voting District | 783 | 590 | 92.2% | 1.1% | 0.8% | 0.2% | $82k | 13.3% | 16.0% | 19.3% | 84.5% | 13.0% | 2.0% |
Laclede: 24 precincts
| Precinct | Population | Voting-age pop. | % White non-Hisp. | % Hispanic | % Black | % Asian | Median income* | % Bachelor's+ | % 18-29 (of adults) | % 65+ | % Homeowners | % Below poverty | % Spanish at home (adults) |
|---|---|---|---|---|---|---|---|---|---|---|---|---|---|
| Competition Voting District | 750 | 629 | 96.9% | 1.8% | 0.0% | 0.0% | $66k | 12.8% | 12.4% | 16.7% | 87.1% | 12.3% | 0.0% |
| Conway 1 Voting District | 64 | 47 | 86.6% | 11.0% | 1.2% | 0.0% | $49k | 19.5% | 14.8% | 19.1% | 73.6% | 11.5% | 0.6% |
| Conway 2 Voting District | 1,299 | 989 | 89.2% | 7.5% | 0.8% | 0.0% | $49k | 18.3% | 10.6% | 24.0% | 77.8% | 13.7% | 0.5% |
| Delto Voting District | 405 | 350 | 96.7% | 1.9% | 0.0% | 0.0% | $58k | 6.2% | 12.4% | 16.8% | 88.9% | 6.2% | 0.0% |
| East Lebanon 1 Voting District | 2,512 | 2,006 | 87.4% | 4.5% | 1.4% | 1.0% | $37k | 12.4% | 22.1% | 19.9% | 32.4% | 30.1% | 0.6% |
| East Lebanon 2A Voting District | 1,291 | 1,041 | 82.6% | 13.8% | 0.0% | 0.0% | $47k | 6.2% | 14.2% | 16.6% | 59.9% | 27.4% | 4.2% |
| East Lebanon 2B Voting District | 4,443 | 3,292 | 93.3% | 0.3% | 0.1% | 2.3% | $53k | 32.2% | 20.3% | 21.3% | 75.4% | 18.4% | 0.1% |
| East Lebanon 2C Voting District | 1,210 | 879 | 91.3% | 2.9% | 0.8% | 0.0% | $59k | 20.1% | 17.1% | 18.2% | 77.8% | 9.6% | 0.6% |
| Eldridge Voting District | 1,220 | 911 | 79.6% | 0.3% | 0.0% | 0.8% | $73k | 12.6% | 35.1% | 17.6% | 63.3% | 30.4% | 0.1% |
| Friendship Voting District | 969 | 786 | 80.6% | 5.1% | 0.4% | 0.2% | $50k | 18.5% | 15.9% | 19.6% | 79.1% | 18.0% | 1.6% |
| Gasconade Voting District | 1,314 | 1,031 | 95.0% | 1.0% | 0.2% | 0.7% | $69k | 18.9% | 16.6% | 20.8% | 87.6% | 19.5% | 0.1% |
| Maysmith R2 Voting District | 773 | 558 | 82.6% | 0.0% | 0.5% | 0.6% | $54k | 5.2% | 20.2% | 18.5% | 80.7% | 19.8% | 0.1% |
| Maysmith R4 Voting District | 315 | 229 | 83.4% | 0.0% | 0.5% | 0.7% | $55k | 5.9% | 20.7% | 18.9% | 81.6% | 20.3% | 0.1% |
| Nebo Voting District | 671 | 500 | 97.4% | 1.1% | 0.0% | 0.0% | $57k | 26.8% | 7.7% | 28.0% | 85.7% | 6.0% | 0.0% |
| Oakland Voting District | 1,436 | 1,042 | 93.1% | 2.1% | 0.1% | 0.4% | $61k | 17.6% | 15.7% | 19.9% | 87.8% | 14.1% | 0.4% |
| Phillipsburg 1 Voting District | 1,764 | 1,288 | 95.4% | 2.5% | 0.2% | 0.0% | $46k | 10.0% | 9.1% | 22.0% | 81.0% | 27.9% | 0.7% |
| Phillipsburg 2 Voting District | 173 | 127 | 97.4% | 0.6% | 0.8% | 0.0% | $47k | 9.7% | 14.0% | 19.1% | 74.7% | 28.9% | 0.7% |
| Sleeper Voting District | 1,081 | 896 | 80.5% | 5.6% | 0.1% | 0.2% | $48k | 18.1% | 14.7% | 20.5% | 81.6% | 17.2% | 1.6% |
| Spring Hollow 1 Voting District | 3,243 | 2,518 | 90.8% | 2.0% | 1.2% | 0.0% | $62k | 8.2% | 14.3% | 22.6% | 79.6% | 17.4% | 0.7% |
| Spring Hollow 2 Voting District | 1,323 | 911 | 85.9% | 1.0% | 3.1% | 0.3% | $72k | 17.6% | 20.7% | 13.8% | 67.3% | 15.9% | 1.6% |
| Washington Voting District | 1,063 | 899 | 95.4% | 1.0% | 0.1% | 0.0% | $55k | 17.9% | 14.4% | 19.6% | 82.4% | 5.6% | 0.0% |
| West Lebanon 1 Voting District | 1,304 | 1,145 | 85.9% | 4.1% | 1.0% | 3.7% | $40k | 10.5% | 20.1% | 15.7% | 29.5% | 28.3% | 0.6% |
| West Lebanon 1D Voting District | 1,959 | 1,364 | 90.4% | 2.9% | 1.4% | 1.8% | $78k | 22.4% | 5.0% | 17.7% | 80.3% | 12.2% | 1.3% |
| West Lebanon 2 Voting District | 5,621 | 3,833 | 94.2% | 3.5% | 0.1% | 0.2% | $63k | 14.7% | 24.6% | 10.0% | 53.7% | 14.4% | 3.6% |
Lafayette: 20 precincts
| Precinct | Population | Voting-age pop. | % White non-Hisp. | % Hispanic | % Black | % Asian | Median income* | % Bachelor's+ | % 18-29 (of adults) | % 65+ | % Homeowners | % Below poverty | % Spanish at home (adults) |
|---|---|---|---|---|---|---|---|---|---|---|---|---|---|
| 1st Higginsville & W. Davis Voting District | 3,747 | 3,075 | 89.0% | 3.3% | 3.4% | 0.8% | $77k | 26.3% | 16.8% | 21.0% | 75.5% | 4.1% | 1.3% |
| 2nd North Higginsville & 3rd & JKV Voting District | 1,288 | 1,035 | 66.7% | 2.6% | 6.0% | 0.0% | $114k | 38.9% | 24.8% | 25.1% | 85.5% | 8.7% | 2.9% |
| Alma & E. Davis Voting District | 947 | 715 | 82.8% | 1.3% | 3.1% | 9.2% | $74k | 34.3% | 16.1% | 18.6% | 87.4% | 6.4% | 0.0% |
| Aullville Voting District | 546 | 442 | 94.5% | 2.6% | 0.4% | 0.0% | $79k | 29.4% | 8.6% | 19.6% | 90.2% | 3.0% | 0.8% |
| Bates City Voting District | 1,020 | 908 | 95.6% | 3.6% | 0.2% | 0.0% | $51k | 14.9% | 9.1% | 15.5% | 80.8% | 10.1% | 3.4% |
| Concordia Voting District | 2,744 | 2,082 | 90.5% | 4.8% | 0.5% | 0.0% | $63k | 27.5% | 14.2% | 21.4% | 62.9% | 12.9% | 1.0% |
| Corder Voting District | 849 | 647 | 96.4% | 0.2% | 0.3% | 0.1% | $95k | 22.2% | 28.3% | 19.0% | 75.4% | 10.2% | 0.0% |
| Dover Voting District | 744 | 613 | 63.9% | 3.0% | 6.6% | 0.0% | $117k | 42.2% | 26.1% | 24.7% | 88.0% | 6.7% | 2.9% |
| E Odessa Voting District | 4,165 | 3,187 | 91.7% | 1.3% | 0.2% | 0.0% | $99k | 29.5% | 22.1% | 17.3% | 87.1% | 6.2% | 2.3% |
| Ferguson School Voting District | 2,529 | 1,971 | 95.5% | 0.8% | 0.6% | 0.1% | $109k | 27.8% | 21.6% | 18.6% | 86.5% | 12.4% | 0.0% |
| Lake Lafayette 1-2 Voting District | 45 | 38 | 94.0% | 6.0% | 0.0% | 0.0% | $116k | 32.9% | 21.8% | 17.6% | 100.0% | 1.4% | 7.0% |
| Lexington Rural Voting District | 3,432 | 2,494 | 92.2% | 7.1% | 0.4% | 0.0% | $79k | 24.4% | 9.4% | 18.5% | 77.6% | 9.5% | 4.3% |
| Lexington Wards No. 1 & 2 | 756 | 489 | 98.1% | 1.4% | 0.4% | 0.0% | $46k | 11.1% | 20.0% | 14.2% | 35.0% | 30.1% | 1.0% |
| Lexington Wards No. 3 & 4 | 1,789 | 1,283 | 83.0% | 14.2% | 2.5% | 0.0% | $56k | 20.0% | 21.0% | 10.0% | 56.9% | 13.5% | 12.6% |
| Mayview Voting District | 634 | 512 | 86.8% | 1.4% | 5.7% | 0.1% | $90k | 19.8% | 7.8% | 24.2% | 82.0% | 9.3% | 0.0% |
| N Odessa Voting District | 3,446 | 2,657 | 93.7% | 1.4% | 0.8% | 0.0% | $86k | 26.4% | 17.6% | 17.9% | 65.9% | 7.8% | 0.5% |
| Napoleon Voting District | 391 | 331 | 92.0% | 2.2% | 0.0% | 0.0% | $86k | 20.5% | 16.0% | 27.8% | 82.2% | 5.1% | 0.3% |
| S. Odessa I & II Voting District | 2,011 | 1,493 | 94.4% | 2.3% | 0.4% | 0.0% | $97k | 27.1% | 19.0% | 19.9% | 93.1% | 12.0% | 2.2% |
| Waverly 1st,2nd,East & West Voting District | 1,007 | 693 | 80.2% | 6.6% | 4.6% | 0.0% | $57k | 23.3% | 18.3% | 20.5% | 56.9% | 8.9% | 4.0% |
| Wellington Voting District | 933 | 775 | 94.0% | 1.2% | 0.4% | 0.0% | $76k | 15.8% | 12.0% | 30.2% | 77.4% | 8.9% | 1.6% |
Polk: 22 precincts
| Precinct | Population | Voting-age pop. | % White non-Hisp. | % Hispanic | % Black | % Asian | Median income* | % Bachelor's+ | % 18-29 (of adults) | % 65+ | % Homeowners | % Below poverty | % Spanish at home (adults) |
|---|---|---|---|---|---|---|---|---|---|---|---|---|---|
| Campbell Voting District | 770 | 479 | 97.2% | 0.5% | 0.3% | 0.0% | $56k | 5.0% | 20.3% | 7.6% | 83.4% | 32.0% | 0.1% |
| Cliquot Voting District | 690 | 430 | 77.5% | 3.0% | 4.1% | 0.0% | $76k | 26.6% | 8.7% | 12.2% | 92.0% | 10.4% | 0.2% |
| East Looney Voting District | 1,284 | 961 | 89.9% | 3.6% | 0.6% | 0.0% | $69k | 12.0% | 14.7% | 16.7% | 86.8% | 10.3% | 1.8% |
| East Madison Voting District | 929 | 755 | 95.3% | 1.2% | 0.0% | 0.7% | $54k | 10.6% | 17.6% | 17.8% | 70.3% | 15.3% | 0.7% |
| Flemington Voting District | 633 | 409 | 72.8% | 6.6% | 4.2% | 0.0% | $65k | 23.0% | 5.3% | 14.2% | 84.1% | 11.7% | 0.1% |
| Jackson Voting District | 772 | 609 | 92.3% | 0.5% | 0.0% | 0.0% | $59k | 12.5% | 9.2% | 21.4% | 78.9% | 14.7% | 0.3% |
| Jefferson Voting District | 554 | 387 | 86.7% | 1.5% | 2.1% | 0.0% | $67k | 27.0% | 9.2% | 18.5% | 87.4% | 17.5% | 1.0% |
| Johnson Voting District | 1,860 | 1,336 | 83.4% | 9.7% | 1.1% | 0.0% | $44k | 9.6% | 11.3% | 17.5% | 68.2% | 29.1% | 0.1% |
| McKinley Voting District | 677 | 519 | 93.0% | 1.8% | 0.3% | 0.3% | $59k | 24.2% | 15.5% | 22.2% | 84.4% | 25.7% | 1.1% |
| Mooney Voting District | 3,586 | 2,875 | 91.7% | 2.7% | 0.3% | 0.0% | $92k | 25.3% | 23.1% | 10.6% | 85.6% | 8.1% | 1.1% |
| North Benton Voting District | 619 | 507 | 87.1% | 6.7% | 0.1% | 1.1% | $45k | 19.2% | 28.3% | 21.7% | 83.5% | 31.2% | 0.1% |
| North Greene Voting District | 368 | 287 | 92.4% | 2.5% | 0.0% | 0.4% | $55k | 21.7% | 17.3% | 21.6% | 83.8% | 28.4% | 1.0% |
| Northeast Marion Voting District | 4,559 | 3,372 | 89.6% | 3.2% | 0.5% | 0.0% | $66k | 31.7% | 22.6% | 21.5% | 65.2% | 17.5% | 2.0% |
| Northwest Marion Voting District | 2,369 | 1,865 | 93.9% | 4.0% | 0.1% | 0.1% | $65k | 23.9% | 22.9% | 18.4% | 75.1% | 17.1% | 3.6% |
| South Benton Voting District | 1,404 | 1,070 | 95.0% | 0.0% | 0.0% | 1.8% | $74k | 14.3% | 26.9% | 14.7% | 77.6% | 12.8% | 0.0% |
| South Greene Voting District | 521 | 430 | 86.7% | 7.0% | 0.0% | 1.2% | $42k | 17.8% | 29.1% | 21.5% | 83.2% | 32.7% | 0.0% |
| Southeast Marion Voting District | 3,755 | 2,954 | 89.1% | 2.8% | 2.0% | 3.5% | $53k | 35.8% | 36.7% | 14.6% | 48.9% | 13.0% | 2.0% |
| Southwest Marion Voting District | 4,430 | 3,441 | 95.0% | 2.0% | 0.5% | 0.6% | $48k | 28.7% | 28.0% | 23.9% | 63.6% | 16.6% | 1.7% |
| Union Voting District | 687 | 587 | 93.6% | 2.3% | 0.0% | 0.5% | $51k | 9.5% | 13.1% | 30.1% | 81.7% | 14.1% | 0.1% |
| West Looney Voting District | 788 | 581 | 97.0% | 0.2% | 0.1% | 1.5% | $62k | 11.7% | 9.7% | 19.6% | 83.3% | 10.2% | 0.1% |
| West Madison Voting District | 436 | 350 | 95.5% | 1.2% | 0.0% | 0.6% | $52k | 9.6% | 17.2% | 18.5% | 72.4% | 16.5% | 0.5% |
| Wishart Voting District | 820 | 701 | 94.1% | 0.5% | 0.2% | 3.6% | $62k | 7.8% | 17.9% | 25.8% | 66.3% | 12.4% | 0.2% |
Camden: 20 precincts
| Precinct | Population | Voting-age pop. | % White non-Hisp. | % Hispanic | % Black | % Asian | Median income* | % Bachelor's+ | % 18-29 (of adults) | % 65+ | % Homeowners | % Below poverty | % Spanish at home (adults) |
|---|---|---|---|---|---|---|---|---|---|---|---|---|---|
| Barnumton Voting District | 1,035 | 954 | 95.6% | 0.6% | 0.6% | 0.0% | $59k | 20.4% | 7.8% | 52.5% | 91.0% | 9.6% | 1.1% |
| Camdenton 1 Voting District | 4,324 | 3,231 | 90.3% | 6.1% | 0.6% | 0.2% | $70k | 17.9% | 25.4% | 13.3% | 72.6% | 19.6% | 4.0% |
| Camdenton 2 Voting District | 2,959 | 2,328 | 81.9% | 13.7% | 0.1% | 1.5% | $70k | 30.1% | 16.0% | 22.8% | 77.9% | 11.7% | 4.2% |
| Camdenton 3 Voting District | 3,050 | 2,323 | 88.1% | 3.5% | 3.4% | 0.2% | $49k | 15.7% | 15.9% | 18.3% | 66.4% | 15.7% | 1.7% |
| Climax Springs Voting District | 1,397 | 1,264 | 90.9% | 1.9% | 0.3% | 0.0% | $51k | 19.4% | 5.7% | 45.5% | 90.7% | 17.0% | 2.7% |
| Decaturville Voting District | 2,005 | 1,514 | 93.9% | 3.6% | 0.2% | 0.1% | $94k | 15.4% | 26.1% | 17.0% | 87.1% | 9.0% | 2.2% |
| Freedom Voting District | 935 | 727 | 91.3% | 2.9% | 0.0% | 1.9% | $63k | 19.2% | 7.7% | 17.2% | 83.4% | 14.2% | 0.9% |
| Greenview Voting District | 1,922 | 1,742 | 96.1% | 0.4% | 0.0% | 0.8% | $62k | 25.4% | 3.4% | 46.7% | 83.9% | 9.5% | 0.0% |
| Ha Ha Tonka Voting District | 703 | 537 | 94.6% | 2.8% | 0.1% | 0.0% | $74k | 7.6% | 17.1% | 8.8% | 93.2% | 22.3% | 0.5% |
| Hillhouse Voting District | 530 | 434 | 94.0% | 0.2% | 0.1% | 1.5% | $50k | 19.1% | 9.3% | 30.4% | 77.7% | 14.9% | 0.5% |
| Linn Creek Voting District | 2,024 | 1,706 | 94.7% | 2.2% | 0.3% | 0.7% | $88k | 36.7% | 13.0% | 23.5% | 88.0% | 7.4% | 1.9% |
| Macks Creek Voting District | 2,380 | 1,878 | 91.2% | 1.6% | 0.1% | 1.3% | $65k | 15.4% | 10.5% | 23.0% | 93.0% | 15.0% | 1.1% |
| Montreal Voting District | 595 | 465 | 91.7% | 0.1% | 0.0% | 2.9% | $56k | 21.6% | 7.9% | 20.6% | 76.4% | 13.8% | 0.3% |
| Osage Beach 3 Voting District | 2,076 | 1,657 | 86.1% | 3.5% | 7.0% | 0.8% | $61k | 23.6% | 14.5% | 21.1% | 60.2% | 13.3% | 2.5% |
| Roach Voting District | 1,408 | 1,199 | 94.5% | 0.2% | 0.2% | 3.3% | $60k | 35.8% | 11.5% | 34.9% | 91.5% | 13.3% | 0.6% |
| Stoutland Voting District | 1,303 | 1,127 | 96.8% | 0.4% | 0.1% | 0.0% | $44k | 16.5% | 10.7% | 41.8% | 79.0% | 16.1% | 0.7% |
| Sunny Slope Voting District | 630 | 493 | 97.7% | 0.0% | 0.9% | 0.0% | $64k | 32.3% | 7.3% | 35.5% | 94.8% | 6.0% | 1.3% |
| Sunrise Beach 2 Voting District | 1,117 | 1,034 | 93.1% | 2.5% | 0.0% | 0.0% | $67k | 23.9% | 9.7% | 38.0% | 84.8% | 14.7% | 1.0% |
| Sunrise Beach 3 Voting District | 1,417 | 1,295 | 92.3% | 1.1% | 0.0% | 0.2% | $54k | 37.9% | 5.7% | 43.1% | 94.5% | 8.0% | 1.1% |
| Wilson Bend Voting District | 548 | 505 | 100.0% | 0.0% | 0.0% | 0.0% | $61k | 12.3% | 2.3% | 48.2% | 94.3% | 7.2% | 0.0% |
Saline: 13 precincts
| Precinct | Population | Voting-age pop. | % White non-Hisp. | % Hispanic | % Black | % Asian | Median income* | % Bachelor's+ | % 18-29 (of adults) | % 65+ | % Homeowners | % Below poverty | % Spanish at home (adults) |
|---|---|---|---|---|---|---|---|---|---|---|---|---|---|
| Blackburn Voting District | 618 | 490 | 95.2% | 0.7% | 2.5% | 0.0% | $64k | 20.2% | 14.5% | 19.8% | 67.6% | 11.3% | 0.1% |
| Blackwater/Salt Fork Voting District | 793 | 611 | 95.4% | 0.6% | 0.3% | 0.0% | $85k | 16.8% | 8.9% | 22.5% | 92.0% | 10.5% | 0.7% |
| Hardeman Voting District | 534 | 412 | 94.4% | 2.7% | 0.3% | 0.0% | $67k | 24.0% | 10.2% | 29.6% | 89.7% | 8.1% | 1.0% |
| Herndon Voting District | 588 | 421 | 96.6% | 0.1% | 0.1% | 0.0% | $101k | 19.1% | 11.0% | 10.9% | 90.5% | 7.3% | 1.1% |
| Malta Bend Voting District | 378 | 308 | 93.8% | 0.2% | 1.2% | 0.3% | $64k | 23.7% | 11.3% | 23.3% | 73.8% | 9.5% | 0.2% |
| Marshall 1 Voting District | 4,641 | 3,621 | 64.5% | 25.0% | 4.1% | 0.0% | $65k | 25.5% | 25.6% | 17.9% | 66.5% | 22.3% | 12.6% |
| Marshall 2 Voting District | 3,479 | 2,924 | 81.6% | 9.2% | 5.0% | 1.5% | $68k | 41.6% | 48.0% | 17.5% | 84.3% | 8.3% | 4.5% |
| Marshall 3 Voting District | 3,458 | 2,652 | 66.9% | 15.9% | 4.6% | 0.8% | $52k | 17.8% | 26.3% | 12.3% | 58.4% | 12.3% | 15.1% |
| Marshall 4 Voting District | 3,253 | 2,492 | 60.4% | 19.3% | 6.9% | 0.3% | $56k | 20.2% | 31.7% | 13.9% | 60.6% | 17.5% | 8.5% |
| Miami Voting District | 488 | 398 | 93.6% | 0.3% | 1.2% | 0.3% | $64k | 24.2% | 10.9% | 24.0% | 74.8% | 9.3% | 0.3% |
| Orearville Voting District | 554 | 379 | 93.1% | 3.0% | 1.2% | 0.1% | $72k | 30.9% | 13.7% | 18.4% | 86.0% | 6.4% | 1.5% |
| Slater Voting District | 2,695 | 2,038 | 75.1% | 6.9% | 12.4% | 1.9% | $51k | 14.6% | 21.1% | 17.0% | 60.7% | 31.1% | 1.5% |
| Sweet Springs Voting District | 1,749 | 1,381 | 91.5% | 2.4% | 0.9% | 0.0% | $60k | 14.4% | 17.7% | 22.6% | 76.6% | 12.5% | 0.2% |
Webster: 11 precincts
| Precinct | Population | Voting-age pop. | % White non-Hisp. | % Hispanic | % Black | % Asian | Median income* | % Bachelor's+ | % 18-29 (of adults) | % 65+ | % Homeowners | % Below poverty | % Spanish at home (adults) |
|---|---|---|---|---|---|---|---|---|---|---|---|---|---|
| East Ozark Voting District | 4,443 | 3,309 | 95.7% | 1.5% | 0.0% | 0.6% | $88k | 22.1% | 19.1% | 16.7% | 81.1% | 7.6% | 2.1% |
| Grant Voting District | 2,288 | 1,734 | 92.6% | 3.4% | 0.0% | 0.0% | $80k | 26.4% | 18.6% | 22.1% | 94.4% | 9.7% | 0.0% |
| High Prairie Voting District | 1,257 | 992 | 96.8% | 1.8% | 0.0% | 0.0% | $94k | 12.2% | 12.3% | 16.9% | 93.4% | 9.1% | 0.3% |
| Jackson Voting District | 1,126 | 841 | 90.1% | 0.0% | 1.0% | 0.0% | $77k | 22.9% | 12.4% | 13.2% | 75.9% | 25.8% | 0.0% |
| Marshfield East Voting District | 2,279 | 1,722 | 94.4% | 0.3% | 0.2% | 0.1% | $59k | 15.0% | 24.2% | 17.4% | 68.4% | 18.2% | 0.4% |
| Marshfield West Voting District | 3,841 | 2,795 | 73.6% | 0.5% | 8.3% | 0.0% | $66k | 17.3% | 24.4% | 23.4% | 58.3% | 20.4% | 0.2% |
| Niangua Voting District | 1,623 | 1,146 | 92.1% | 2.2% | 0.0% | 0.6% | $75k | 19.3% | 16.8% | 15.9% | 75.4% | 11.8% | 1.3% |
| Northview A Voting District | 1,329 | 1,158 | 91.4% | 5.8% | 0.1% | 0.0% | $73k | 20.4% | 38.4% | 19.3% | 90.1% | 9.4% | 0.3% |
| Northview B Voting District | 1,051 | 863 | 94.5% | 3.0% | 0.0% | 0.0% | $89k | 22.5% | 25.2% | 21.6% | 96.1% | 3.8% | 0.1% |
| Union Voting District | 1,364 | 964 | 91.3% | 5.2% | 0.0% | 0.4% | $72k | 15.0% | 18.6% | 16.9% | 72.8% | 9.3% | 1.4% |
| Washington Voting District | 1,741 | 1,459 | 98.2% | 0.0% | 0.0% | 0.0% | $99k | 19.5% | 34.9% | 10.1% | 88.4% | 9.3% | 0.0% |
Henry: 9 precincts
| Precinct | Population | Voting-age pop. | % White non-Hisp. | % Hispanic | % Black | % Asian | Median income* | % Bachelor's+ | % 18-29 (of adults) | % 65+ | % Homeowners | % Below poverty | % Spanish at home (adults) |
|---|---|---|---|---|---|---|---|---|---|---|---|---|---|
| Bearcreek / Deepwater Voting District | 842 | 646 | 94.9% | 0.7% | 0.4% | 0.0% | $61k | 12.7% | 8.9% | 26.4% | 71.8% | 6.2% | 0.1% |
| Benson Center Voting District | 10,009 | 7,801 | 92.2% | 2.4% | 0.8% | 0.2% | $64k | 16.8% | 18.7% | 20.1% | 68.6% | 15.1% | 1.0% |
| Clinton 1 Voting District | 3,210 | 2,480 | 89.5% | 1.3% | 2.2% | 0.0% | $58k | 20.4% | 10.6% | 31.0% | 75.4% | 6.4% | 0.1% |
| Fairview Voting District | 418 | 367 | 93.9% | 2.1% | 0.4% | 0.0% | $64k | 17.5% | 6.3% | 37.2% | 92.3% | 8.0% | 0.4% |
| Leesville Voting District | 845 | 700 | 90.2% | 3.2% | 0.0% | 0.3% | $67k | 11.2% | 11.3% | 27.9% | 84.2% | 10.1% | 0.0% |
| Osage Voting District | 596 | 563 | 93.6% | 2.3% | 0.5% | 0.0% | $64k | 17.1% | 3.0% | 47.3% | 94.2% | 5.7% | 0.0% |
| Springfield / Tebo Voting District | 1,131 | 904 | 93.4% | 1.8% | 0.0% | 0.4% | $69k | 15.4% | 14.3% | 22.6% | 82.1% | 15.1% | 0.8% |
| Urich Voting District | 1,877 | 1,376 | 95.4% | 2.2% | 0.0% | 0.2% | $66k | 13.0% | 19.8% | 19.1% | 80.2% | 16.2% | 0.5% |
| Windsor Voting District | 3,400 | 2,514 | 86.2% | 8.0% | 0.2% | 0.0% | $52k | 14.8% | 18.1% | 14.4% | 81.3% | 23.1% | 3.6% |
Morgan: 16 precincts
| Precinct | Population | Voting-age pop. | % White non-Hisp. | % Hispanic | % Black | % Asian | Median income* | % Bachelor's+ | % 18-29 (of adults) | % 65+ | % Homeowners | % Below poverty | % Spanish at home (adults) |
|---|---|---|---|---|---|---|---|---|---|---|---|---|---|
| Barnett I Voting District | 1,013 | 615 | 98.0% | 0.0% | 0.0% | 0.0% | $42k | 7.2% | 23.9% | 10.9% | 70.0% | 27.7% | 0.2% |
| Barnett II Voting District | 727 | 449 | 97.1% | 0.0% | 0.0% | 0.0% | $46k | 9.8% | 23.8% | 10.7% | 70.5% | 25.2% | 0.2% |
| Excelsior Voting District | 838 | 448 | 100.0% | 0.0% | 0.0% | 0.0% | $80k | 10.2% | 31.7% | 6.8% | 89.8% | 33.0% | 0.0% |
| Fairgrounds North Voting District | 971 | 783 | 92.9% | 1.2% | 0.4% | 0.4% | $33k | 13.7% | 14.3% | 27.4% | 54.5% | 19.9% | 0.2% |
| Fairgrounds South Voting District | 860 | 667 | 90.9% | 4.6% | 0.0% | 0.0% | $30k | 12.8% | 13.5% | 25.4% | 58.0% | 21.0% | 1.8% |
| Florence Voting District | 998 | 850 | 88.5% | 1.5% | 0.1% | 4.2% | $42k | 8.8% | 10.7% | 19.5% | 74.9% | 9.1% | 0.0% |
| Gravois Mills Voting District | 1,078 | 929 | 95.3% | 0.5% | 0.3% | 0.0% | $57k | 15.0% | 12.8% | 34.6% | 84.6% | 15.9% | 0.5% |
| Indian Creek Voting District | 2,047 | 1,673 | 96.5% | 1.0% | 0.0% | 0.0% | $73k | 23.1% | 11.3% | 30.0% | 87.9% | 6.8% | 0.4% |
| Laurie Voting District | 3,150 | 2,844 | 88.8% | 4.5% | 0.2% | 0.4% | $82k | 27.5% | 7.3% | 41.5% | 88.4% | 12.8% | 0.2% |
| Stover North Voting District | 1,261 | 941 | 92.8% | 1.9% | 1.0% | 1.2% | $55k | 17.4% | 14.4% | 13.3% | 78.9% | 9.9% | 2.5% |
| Stover South Voting District | 1,358 | 978 | 90.7% | 5.9% | 0.1% | 0.2% | $42k | 14.0% | 14.6% | 16.4% | 74.8% | 16.6% | 3.6% |
| Syracuse North Voting District | 101 | 71 | 90.2% | 5.8% | 0.0% | 0.0% | $68k | 13.5% | 37.8% | 16.4% | 87.5% | 8.3% | 0.0% |
| Syracuse South Voting District | 1,730 | 1,208 | 90.3% | 5.7% | 0.0% | 0.1% | $68k | 13.5% | 37.4% | 16.3% | 87.5% | 8.2% | 0.0% |
| Versailles North Voting District | 1,531 | 1,063 | 94.8% | 3.0% | 0.1% | 0.0% | $49k | 10.9% | 17.9% | 16.2% | 74.5% | 31.5% | 0.0% |
| Versailles Voting District | 1,695 | 1,295 | 86.4% | 3.7% | 1.3% | 0.0% | $55k | 21.0% | 16.3% | 19.1% | 74.8% | 14.2% | 0.5% |
| Webb Voting District | 2,326 | 1,923 | 88.2% | 0.8% | 0.0% | 0.0% | $34k | 9.6% | 7.2% | 31.2% | 86.2% | 35.5% | 0.6% |
Benton: 8 precincts
| Precinct | Population | Voting-age pop. | % White non-Hisp. | % Hispanic | % Black | % Asian | Median income* | % Bachelor's+ | % 18-29 (of adults) | % 65+ | % Homeowners | % Below poverty | % Spanish at home (adults) |
|---|---|---|---|---|---|---|---|---|---|---|---|---|---|
| ALEXANDER | 687 | 621 | 96.5% | 3.1% | 0.0% | 0.0% | $60k | 15.5% | 13.3% | 41.5% | 83.3% | 9.3% | 0.0% |
| COLE | 2,293 | 1,820 | 83.8% | 5.1% | 0.0% | 0.0% | $54k | 14.5% | 12.6% | 27.3% | 90.9% | 24.5% | 1.9% |
| FRISTOE | 2,358 | 2,088 | 96.6% | 1.2% | 0.0% | 0.6% | $36k | 12.7% | 4.2% | 42.8% | 92.4% | 27.9% | 0.0% |
| LINDSEY | 4,727 | 3,901 | 90.6% | 1.7% | 0.4% | 0.0% | $51k | 12.0% | 13.2% | 31.6% | 77.8% | 28.3% | 0.7% |
| TOM | 2,517 | 2,351 | 92.4% | 0.8% | 1.3% | 0.0% | $52k | 16.8% | 1.4% | 42.0% | 84.3% | 14.4% | 0.5% |
| UNION | 1,359 | 1,209 | 93.9% | 3.4% | 0.3% | 0.0% | $53k | 9.1% | 12.0% | 43.7% | 92.7% | 11.8% | 0.0% |
| WHITE | 2,888 | 1,978 | 88.2% | 1.2% | 3.6% | 0.6% | $60k | 19.0% | 14.7% | 20.8% | 78.6% | 16.1% | 0.8% |
| WILLIAMS | 3,281 | 2,660 | 95.4% | 2.0% | 0.9% | 0.0% | $58k | 19.2% | 17.2% | 19.6% | 79.1% | 11.9% | 3.2% |
Vernon: 16 precincts
| Precinct | Population | Voting-age pop. | % White non-Hisp. | % Hispanic | % Black | % Asian | Median income* | % Bachelor's+ | % 18-29 (of adults) | % 65+ | % Homeowners | % Below poverty | % Spanish at home (adults) |
|---|---|---|---|---|---|---|---|---|---|---|---|---|---|
| 1st Baptist Church Voting District | 2,566 | 2,076 | 86.0% | 7.3% | 2.4% | 0.9% | $39k | 13.4% | 26.3% | 13.5% | 51.6% | 26.7% | 3.1% |
| Bronaugh School Voting District | 281 | 227 | 97.8% | 0.0% | 0.0% | 0.0% | $61k | 17.8% | 9.2% | 28.2% | 88.0% | 14.3% | 0.0% |
| Courthouse Voting District | 2,807 | 2,298 | 94.0% | 1.5% | 0.4% | 1.2% | $71k | 24.8% | 15.3% | 23.5% | 84.4% | 8.7% | 0.9% |
| Deerfield Baptist Church Voting District | 594 | 447 | 97.7% | 0.3% | 0.0% | 0.4% | $58k | 19.1% | 16.4% | 25.1% | 90.2% | 9.3% | 0.5% |
| Harwood Town Hall Voting District | 711 | 443 | 96.9% | 0.9% | 0.0% | 0.0% | $61k | 18.0% | 16.2% | 17.3% | 77.4% | 16.3% | 0.1% |
| Home EC Building Voting District | 1,231 | 938 | 87.5% | 3.7% | 5.0% | 0.0% | $57k | 12.4% | 24.0% | 13.8% | 45.4% | 23.6% | 0.1% |
| Milo Fire Barn Voting District | 884 | 616 | 95.3% | 1.7% | 0.0% | 0.0% | $52k | 16.7% | 15.9% | 16.9% | 76.2% | 27.8% | 1.7% |
| Moundville Community Building Voting District | 822 | 642 | 98.0% | 0.0% | 0.0% | 0.3% | $57k | 17.1% | 12.7% | 27.7% | 90.2% | 12.7% | 0.0% |
| National Guard Armory Voting District | 1,159 | 950 | 87.6% | 8.0% | 0.0% | 1.9% | $57k | 21.6% | 21.1% | 20.8% | 79.9% | 18.5% | 7.1% |
| Rinehart Christian Church Voting District | 623 | 475 | 97.1% | 1.2% | 0.0% | 0.0% | $56k | 17.6% | 18.4% | 23.2% | 82.0% | 9.3% | 2.0% |
| Schell City City Hall Voting District | 1,069 | 737 | 96.2% | 0.5% | 0.0% | 0.1% | $56k | 10.1% | 18.0% | 16.5% | 76.8% | 15.2% | 0.0% |
| Sheldon Community Building Voting District | 1,591 | 1,156 | 93.0% | 4.0% | 0.0% | 0.1% | $56k | 18.3% | 14.6% | 18.3% | 75.7% | 15.1% | 3.3% |
| United Methodist Church Voting District | 1,286 | 1,043 | 95.7% | 0.2% | 2.0% | 0.9% | $56k | 14.4% | 13.4% | 34.0% | 77.8% | 19.8% | 0.1% |
| Virgil Voting District | 623 | 425 | 96.3% | 0.7% | 0.0% | 0.0% | $50k | 16.5% | 16.3% | 16.4% | 76.7% | 34.3% | 1.0% |
| Walker Community Building Voting District | 491 | 365 | 95.6% | 0.2% | 0.0% | 0.2% | $50k | 4.6% | 19.1% | 15.7% | 76.3% | 16.0% | 0.0% |
| YMCA Voting District | 2,774 | 2,010 | 91.5% | 1.7% | 0.7% | 1.9% | $56k | 13.5% | 16.5% | 22.9% | 60.3% | 23.7% | 0.1% |
Dallas: 11 precincts
| Precinct | Population | Voting-age pop. | % White non-Hisp. | % Hispanic | % Black | % Asian | Median income* | % Bachelor's+ | % 18-29 (of adults) | % 65+ | % Homeowners | % Below poverty | % Spanish at home (adults) |
|---|---|---|---|---|---|---|---|---|---|---|---|---|---|
| Benton North Voting District | 3,692 | 3,118 | 91.0% | 3.3% | 0.2% | 0.0% | $46k | 10.5% | 22.3% | 21.3% | 53.6% | 26.8% | 0.1% |
| Benton South Voting District | 3,056 | 2,327 | 87.5% | 6.4% | 0.2% | 0.0% | $69k | 33.8% | 8.4% | 14.6% | 80.5% | 14.6% | 0.0% |
| Grant Voting District | 1,453 | 900 | 95.5% | 3.1% | 0.0% | 0.0% | $39k | 8.5% | 23.2% | 18.5% | 77.7% | 33.9% | 0.9% |
| Jackson Voting District | 2,085 | 1,457 | 96.2% | 0.0% | 0.6% | 0.0% | $71k | 17.5% | 13.4% | 21.6% | 89.7% | 16.2% | 0.0% |
| Jasper Voting District | 1,101 | 920 | 92.5% | 1.1% | 0.0% | 0.0% | $52k | 9.8% | 9.4% | 34.0% | 89.7% | 21.1% | 1.3% |
| Lincoln Voting District | 841 | 647 | 93.8% | 1.1% | 0.5% | 0.3% | $60k | 11.7% | 11.9% | 19.4% | 90.0% | 18.8% | 0.1% |
| Miller Voting District | 817 | 611 | 98.2% | 0.8% | 0.0% | 0.0% | $28k | 12.7% | 17.6% | 24.8% | 82.2% | 25.3% | 0.8% |
| Sheridan Voting District | 1,411 | 946 | 99.1% | 0.0% | 0.0% | 0.0% | 21.6% | 16.9% | 24.9% | 75.0% | 16.3% | 0.0% | |
| Sherman Voting District | 552 | 410 | 97.0% | 1.0% | 0.1% | 0.1% | $38k | 12.2% | 16.4% | 23.0% | 84.2% | 24.4% | 0.6% |
| Washington Voting District | 1,057 | 867 | 96.4% | 0.0% | 0.0% | 0.0% | $87k | 12.9% | 11.9% | 25.0% | 88.8% | 6.3% | 0.0% |
| Wilson Voting District | 1,458 | 1,188 | 90.7% | 0.1% | 0.0% | 0.0% | $57k | 9.1% | 16.7% | 17.4% | 80.3% | 20.3% | 0.1% |
Bates: 15 precincts
| Precinct | Population | Voting-age pop. | % White non-Hisp. | % Hispanic | % Black | % Asian | Median income* | % Bachelor's+ | % 18-29 (of adults) | % 65+ | % Homeowners | % Below poverty | % Spanish at home (adults) |
|---|---|---|---|---|---|---|---|---|---|---|---|---|---|
| Adrian North Voting District | 1,499 | 1,126 | 92.8% | 2.3% | 0.5% | 0.0% | $68k | 13.6% | 17.2% | 18.5% | 73.3% | 9.7% | 0.1% |
| Adrian South Voting District | 2,814 | 2,098 | 94.8% | 1.9% | 0.4% | 0.0% | $75k | 13.5% | 16.4% | 16.8% | 79.4% | 8.3% | 0.1% |
| Amoret Voting District | 441 | 369 | 93.0% | 1.5% | 0.0% | 0.7% | $67k | 25.0% | 18.5% | 26.3% | 85.4% | 15.5% | 0.8% |
| Amsterdam Voting District | 496 | 422 | 96.4% | 1.6% | 0.0% | 0.0% | $58k | 20.9% | 17.8% | 19.4% | 87.4% | 17.4% | 0.0% |
| Ballard Voting District | 781 | 649 | 96.6% | 1.5% | 0.0% | 0.0% | $91k | 16.9% | 12.2% | 21.5% | 88.2% | 2.9% | 0.3% |
| Butler No. 1 Voting District | 1,141 | 925 | 92.1% | 2.8% | 4.0% | 0.2% | $93k | 13.7% | 18.6% | 18.2% | 90.5% | 20.0% | 0.4% |
| Butler No. 2 Voting District | 2,058 | 1,603 | 90.1% | 2.6% | 0.8% | 2.4% | $49k | 14.1% | 20.6% | 23.1% | 73.1% | 16.6% | 3.2% |
| Butler No. 3 Voting District | 2,296 | 1,708 | 82.7% | 3.7% | 8.7% | 0.2% | $50k | 17.4% | 18.3% | 20.2% | 39.0% | 21.4% | 0.3% |
| Butler No. 4 Voting District | 596 | 481 | 86.9% | 4.3% | 7.8% | 0.4% | $88k | 10.7% | 23.3% | 17.8% | 91.3% | 37.0% | 0.5% |
| Drexel Voting District | 632 | 430 | 95.2% | 2.2% | 0.6% | 0.2% | $71k | 9.9% | 14.3% | 15.9% | 81.5% | 8.6% | 0.0% |
| Hudson Voting District | 384 | 323 | 96.6% | 0.7% | 0.2% | 0.1% | $87k | 20.8% | 14.7% | 24.3% | 83.4% | 6.1% | 0.1% |
| Hume Voting District | 417 | 342 | 87.7% | 7.3% | 0.0% | 0.1% | $73k | 22.6% | 29.7% | 15.3% | 88.2% | 15.1% | 5.1% |
| Rich Hill North Voting District | 911 | 699 | 95.8% | 1.1% | 0.6% | 0.0% | $58k | 11.4% | 13.9% | 19.8% | 77.9% | 22.4% | 0.5% |
| Rich Hill South Voting District | 1,604 | 1,222 | 93.9% | 3.0% | 0.3% | 0.0% | $57k | 11.5% | 18.6% | 17.8% | 80.0% | 24.6% | 2.0% |
| Rockville Voting District | 129 | 107 | 90.2% | 1.5% | 2.2% | 0.0% | $61k | 16.8% | 10.5% | 19.1% | 77.4% | 9.3% | 0.0% |
Cedar: 9 precincts
| Precinct | Population | Voting-age pop. | % White non-Hisp. | % Hispanic | % Black | % Asian | Median income* | % Bachelor's+ | % 18-29 (of adults) | % 65+ | % Homeowners | % Below poverty | % Spanish at home (adults) |
|---|---|---|---|---|---|---|---|---|---|---|---|---|---|
| Benton Voting District | 826 | 645 | 90.0% | 4.4% | 0.0% | 0.0% | $48k | 17.1% | 22.8% | 14.7% | 94.5% | 11.9% | 0.0% |
| Box No. 1 Voting District | 2,831 | 2,149 | 94.7% | 1.7% | 1.0% | 0.0% | $45k | 14.2% | 10.7% | 25.0% | 59.3% | 17.8% | 0.8% |
| Box No. 2 Voting District | 3,167 | 2,524 | 91.4% | 2.8% | 0.3% | 0.0% | $56k | 16.7% | 22.6% | 20.7% | 67.1% | 32.5% | 0.0% |
| Cedar Voting District | 692 | 525 | 77.4% | 3.5% | 2.4% | 0.0% | $66k | 23.5% | 15.2% | 17.2% | 96.1% | 11.0% | 0.0% |
| Jefferson Voting District | 868 | 576 | 95.9% | 1.5% | 0.0% | 0.0% | $77k | 25.5% | 8.6% | 21.4% | 84.2% | 8.8% | 0.0% |
| Madison Voting District | 816 | 598 | 96.9% | 3.0% | 0.0% | 0.0% | $38k | 36.7% | 3.6% | 28.1% | 81.3% | 10.0% | 0.0% |
| North Linn Voting District | 1,993 | 1,454 | 91.2% | 1.7% | 0.5% | 0.1% | $61k | 22.8% | 21.8% | 18.2% | 70.7% | 13.6% | 0.1% |
| South Linn Voting District | 2,365 | 1,977 | 92.6% | 2.0% | 0.2% | 0.1% | $44k | 18.1% | 12.0% | 35.6% | 81.1% | 11.2% | 1.6% |
| Washington Voting District | 1,054 | 653 | 91.9% | 0.6% | 0.4% | 0.0% | $75k | 11.7% | 14.9% | 14.9% | 90.2% | 8.0% | 0.0% |
Barton: 8 precincts
| Precinct | Population | Voting-age pop. | % White non-Hisp. | % Hispanic | % Black | % Asian | Median income* | % Bachelor's+ | % 18-29 (of adults) | % 65+ | % Homeowners | % Below poverty | % Spanish at home (adults) |
|---|---|---|---|---|---|---|---|---|---|---|---|---|---|
| Vote Center #1 | 1,662 | 1,285 | 91.0% | 3.1% | 0.0% | 0.0% | $67k | 16.7% | 15.6% | 18.2% | 80.0% | 14.0% | 0.7% |
| Vote Center #2 | 1,284 | 1,002 | 88.1% | 1.7% | 0.0% | 0.0% | $66k | 19.1% | 20.7% | 20.8% | 71.1% | 10.3% | 1.2% |
| Vote Center #3 | 1,346 | 872 | 95.4% | 1.4% | 0.1% | 0.2% | $35k | 21.2% | 20.0% | 15.0% | 47.7% | 48.8% | 1.5% |
| Vote Center #4 | 295 | 230 | 86.9% | 0.1% | 1.0% | 2.3% | $42k | 21.5% | 14.8% | 31.0% | 69.4% | 18.6% | 0.1% |
| Vote Center #5 | 1,531 | 1,072 | 89.8% | 8.0% | 0.0% | 0.0% | $64k | 15.6% | 19.4% | 15.5% | 85.9% | 8.8% | 1.9% |
| Vote Center #6 | 994 | 799 | 88.1% | 6.7% | 0.0% | 0.0% | $51k | 12.6% | 16.9% | 20.7% | 71.3% | 19.3% | 0.1% |
| Vote Center #7 | 4,086 | 3,274 | 88.8% | 1.8% | 0.6% | 0.9% | $45k | 17.4% | 15.2% | 25.7% | 61.5% | 21.8% | 0.3% |
| Vote Center #8 | 473 | 401 | 90.3% | 0.6% | 0.0% | 0.0% | $59k | 19.5% | 9.9% | 30.1% | 77.4% | 13.0% | 2.8% |
Howard: 8 precincts
| Precinct | Population | Voting-age pop. | % White non-Hisp. | % Hispanic | % Black | % Asian | Median income* | % Bachelor's+ | % 18-29 (of adults) | % 65+ | % Homeowners | % Below poverty | % Spanish at home (adults) |
|---|---|---|---|---|---|---|---|---|---|---|---|---|---|
| Bonne Femme Voting District | 505 | 377 | 90.7% | 2.1% | 0.4% | 0.0% | $61k | 25.8% | 10.5% | 24.4% | 92.8% | 9.0% | 1.1% |
| Boonslick Voting District | 398 | 324 | 99.6% | 0.1% | 0.1% | 0.0% | $77k | 18.2% | 11.2% | 32.1% | 94.3% | 5.6% | 0.0% |
| Burton Voting District | 303 | 224 | 91.4% | 1.7% | 0.3% | 0.0% | $56k | 25.1% | 10.3% | 25.0% | 93.3% | 9.0% | 1.2% |
| Chariton Voting District | 1,750 | 1,319 | 89.1% | 1.9% | 7.2% | 0.0% | $63k | 25.8% | 13.7% | 23.4% | 84.7% | 8.8% | 0.0% |
| Franklin Voting District | 1,858 | 1,466 | 89.9% | 0.7% | 3.2% | 0.0% | $69k | 24.7% | 15.3% | 22.1% | 75.2% | 12.5% | 0.2% |
| Moniteau Voting District | 1,043 | 878 | 85.2% | 0.2% | 0.1% | 0.1% | $116k | 40.7% | 13.0% | 20.0% | 85.4% | 4.8% | 0.0% |
| Prairie Voting District | 643 | 472 | 91.9% | 2.5% | 1.5% | 0.0% | $68k | 27.1% | 10.2% | 23.5% | 94.5% | 7.0% | 0.6% |
| Richmond Voting District | 3,786 | 3,052 | 79.4% | 4.1% | 10.1% | 0.6% | $59k | 28.8% | 42.0% | 14.5% | 65.9% | 18.7% | 1.3% |
St. Clair: 18 precincts
| Precinct | Population | Voting-age pop. | % White non-Hisp. | % Hispanic | % Black | % Asian | Median income* | % Bachelor's+ | % 18-29 (of adults) | % 65+ | % Homeowners | % Below poverty | % Spanish at home (adults) |
|---|---|---|---|---|---|---|---|---|---|---|---|---|---|
| Appleton No. 1 Voting District | 584 | 471 | 92.7% | 3.8% | 1.4% | 0.0% | $49k | 18.0% | 19.1% | 30.3% | 58.1% | 11.5% | 0.6% |
| Appleton No. 2 Voting District | 842 | 707 | 92.8% | 3.0% | 1.1% | 0.0% | $50k | 15.5% | 15.3% | 31.7% | 62.5% | 11.7% | 0.5% |
| Butler East Voting District | 784 | 566 | 94.6% | 0.6% | 1.2% | 0.5% | $55k | 13.3% | 10.4% | 16.7% | 80.2% | 12.7% | 0.4% |
| Butler West Voting District | 859 | 688 | 93.7% | 1.8% | 0.7% | 0.1% | $49k | 8.9% | 14.8% | 19.3% | 65.3% | 18.4% | 1.1% |
| Center Voting District | 175 | 113 | 94.9% | 0.0% | 0.2% | 0.1% | $42k | 14.5% | 17.2% | 21.4% | 93.6% | 12.6% | 2.3% |
| Collins Voting District | 561 | 438 | 87.4% | 2.7% | 0.0% | 0.4% | $62k | 13.6% | 11.5% | 24.4% | 94.1% | 14.7% | 0.0% |
| Dallas Voting District | 443 | 336 | 95.3% | 2.4% | 0.0% | 0.0% | $62k | 12.4% | 15.0% | 23.6% | 74.5% | 14.5% | 0.0% |
| Doyal Voting District | 779 | 596 | 92.7% | 3.5% | 1.0% | 0.0% | $56k | 18.1% | 16.7% | 25.2% | 70.0% | 16.9% | 0.9% |
| Jackson Voting District | 441 | 393 | 92.5% | 1.6% | 0.2% | 1.4% | $49k | 7.9% | 9.7% | 39.8% | 73.7% | 12.7% | 0.0% |
| Monegaw Voting District | 221 | 207 | 93.6% | 0.0% | 0.0% | 0.0% | $51k | 8.5% | 3.5% | 35.6% | 79.2% | 12.7% | 0.2% |
| Osage Voting District | 257 | 164 | 94.9% | 0.0% | 0.0% | 0.0% | $40k | 14.4% | 18.5% | 22.3% | 94.4% | 13.0% | 2.7% |
| Osceola East Voting District | 820 | 632 | 90.7% | 4.1% | 2.1% | 0.2% | $50k | 22.7% | 17.2% | 26.7% | 66.5% | 18.4% | 1.7% |
| Osceola West Voting District | 724 | 544 | 90.4% | 4.0% | 2.3% | 0.1% | $48k | 24.2% | 17.8% | 25.5% | 67.7% | 18.6% | 2.0% |
| Polk Voting District | 377 | 306 | 94.7% | 2.2% | 0.0% | 0.5% | $57k | 10.4% | 13.4% | 30.0% | 72.5% | 14.1% | 0.0% |
| Roscoe Voting District | 450 | 391 | 97.3% | 0.1% | 0.0% | 0.0% | $69k | 11.7% | 8.5% | 24.3% | 95.3% | 12.5% | 0.1% |
| Speedwell Voting District | 459 | 401 | 97.5% | 0.0% | 0.0% | 0.0% | $69k | 11.5% | 8.2% | 24.4% | 95.5% | 12.4% | 0.0% |
| Taber Voting District | 260 | 165 | 95.0% | 0.0% | 0.0% | 0.0% | $40k | 14.5% | 18.7% | 22.2% | 94.6% | 13.0% | 2.7% |
| Washington Voting District | 539 | 421 | 87.4% | 2.6% | 0.0% | 0.4% | $62k | 13.6% | 11.5% | 24.4% | 94.1% | 14.7% | 0.0% |
Hickory: 10 precincts
| Precinct | Population | Voting-age pop. | % White non-Hisp. | % Hispanic | % Black | % Asian | Median income* | % Bachelor's+ | % 18-29 (of adults) | % 65+ | % Homeowners | % Below poverty | % Spanish at home (adults) |
|---|---|---|---|---|---|---|---|---|---|---|---|---|---|
| Carson's Corner Voting District | 989 | 908 | 93.2% | 2.8% | 0.3% | 1.7% | $39k | 11.1% | 7.7% | 46.9% | 79.2% | 19.6% | 0.8% |
| Cross Timbers-Jordan Voting District | 1,067 | 803 | 90.6% | 3.6% | 0.1% | 0.1% | $44k | 17.4% | 15.8% | 23.3% | 84.0% | 20.4% | 0.3% |
| Elkton Voting District | 839 | 640 | 97.9% | 0.2% | 0.0% | 0.5% | $48k | 11.5% | 16.6% | 20.9% | 89.9% | 18.6% | 0.2% |
| Hermitage Voting District | 551 | 482 | 92.8% | 2.0% | 0.4% | 1.0% | $40k | 16.7% | 16.3% | 31.6% | 82.3% | 30.3% | 1.5% |
| Pittsburg Voting District | 1,512 | 1,371 | 95.2% | 1.5% | 0.1% | 0.6% | $42k | 11.8% | 4.8% | 41.8% | 83.5% | 14.4% | 0.1% |
| Pleasant Ridge Voting District | 710 | 647 | 91.9% | 0.0% | 0.0% | 0.0% | $46k | 4.7% | 5.0% | 40.5% | 86.8% | 10.0% | 0.0% |
| Preston Voting District | 997 | 751 | 97.6% | 0.3% | 0.0% | 0.0% | $42k | 19.8% | 14.9% | 23.7% | 88.1% | 22.8% | 0.0% |
| Quincy Voting District | 416 | 318 | 87.6% | 4.6% | 0.0% | 0.0% | $37k | 8.8% | 15.2% | 25.5% | 65.4% | 20.7% | 0.0% |
| Weaubleau Voting District | 860 | 671 | 91.6% | 1.2% | 0.0% | 0.1% | $34k | 14.9% | 7.5% | 33.2% | 82.0% | 25.0% | 0.0% |
| Wheatland Voting District | 640 | 499 | 89.6% | 3.7% | 0.1% | 0.2% | $39k | 10.5% | 15.7% | 25.6% | 71.3% | 21.9% | 0.3% |
Dade: 8 precincts
| Precinct | Population | Voting-age pop. | % White non-Hisp. | % Hispanic | % Black | % Asian | Median income* | % Bachelor's+ | % 18-29 (of adults) | % 65+ | % Homeowners | % Below poverty | % Spanish at home (adults) |
|---|---|---|---|---|---|---|---|---|---|---|---|---|---|
| Cedar & Ernest Voting District | 562 | 395 | 97.6% | 2.0% | 0.0% | 0.0% | $63k | 7.6% | 10.4% | 13.6% | 73.6% | 3.9% | 0.6% |
| Grant & Smith R-1/East Lockwood/E. Ward City Voting District | 956 | 791 | 90.3% | 2.6% | 0.0% | 0.3% | $47k | 17.6% | 12.2% | 28.0% | 73.5% | 11.1% | 2.0% |
| North & North Sac Voting District | 547 | 415 | 96.5% | 1.6% | 0.3% | 0.1% | $70k | 12.0% | 11.8% | 19.4% | 78.7% | 5.5% | 0.4% |
| Polk/East Center/N. Ward City/Pilgrim & Rock Prairie Voting District | 1,660 | 1,296 | 90.4% | 3.5% | 1.1% | 0.1% | $44k | 16.1% | 11.3% | 26.0% | 68.4% | 20.3% | 0.4% |
| Polk/North Morgan & South Morgan Voting District | 926 | 773 | 95.0% | 1.1% | 0.7% | 0.2% | $77k | 16.9% | 13.4% | 27.5% | 84.7% | 7.8% | 0.2% |
| Polk/South & Smith R-4/Pilgrim & Rock Prairie Voting District | 1,265 | 999 | 89.9% | 0.9% | 0.0% | 0.0% | $58k | 11.4% | 19.8% | 21.7% | 88.0% | 12.6% | 0.4% |
| South & Smith R-4/Washington/West Center/S. Ward City/S. Sac Voting District | 1,031 | 800 | 91.5% | 3.7% | 0.5% | 0.1% | $56k | 16.9% | 9.9% | 26.5% | 78.7% | 16.6% | 1.0% |
| West Lockwood/W. Ward City/Marion Voting District | 691 | 583 | 91.0% | 1.7% | 0.0% | 0.3% | $46k | 17.6% | 13.4% | 28.7% | 72.7% | 9.2% | 1.9% |
*Median income is approximate (see note above). ACS 2020-2024 5-year.
Nonpartisan voter information. GOTV Polling does not endorse any candidate.