
Missouri's 7th Congressional District
U.S. House · Missouri · District 7 · General election: Tuesday, November 3, 2026
Candidates on the November 3 ballot
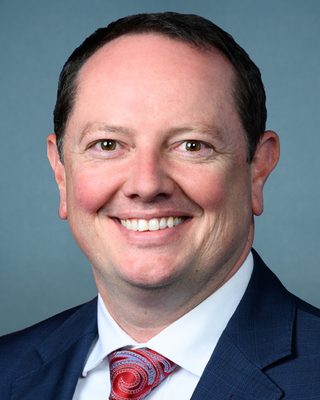 Eric W. BurlisonRepublicanPhoto: U.S. Congress
- Missi HeskethDemocratic
- Kevin CraigLibertarian
Source: Missouri Secretary of State, Certification of Candidates and Party Emblems, 2026 General Election, certified list (2026-08-25; retrieved 2026-10-30). Order of names does not reflect ballot order. Incumbent tags appear only where the official list marks incumbents. Photos come from the Candidate Alerts database where one is on file; otherwise initials are shown.
Federal campaign finance filings for this seat: FEC election page (FEC registration is not the same as ballot qualification).
Certified candidates
- Eric Burlison RepublicanIncumbent @RepEricBurlison
- Missi Hesketh Democratic
- Kevin Craig Libertarian
Certified candidate list from Candidate Alerts, as of 2026-09-24, based on Missouri Secretary of State. Includes candidates the database marks as on the November 3 ballot. Incumbent tags here follow the database.
Past election results
Partial coverage: totals include only the counties loaded from certified sources (10 counties missing), so they are not the official district total.
| Candidate | Party | Votes | Share |
|---|---|---|---|
| Eric Burlison | Republican | 86,902 | 61.4% |
| Missi Hesketh | Democratic | 51,532 | 36.4% |
| Kevin Craig | Libertarian | 3,103 | 2.2% |
| Total | 141,537 |
Source: Missouri local election authorities, official precinct results; per-county provenance in election_contest_sources. Status: Official county precinct results; each loaded county reconciles exactly to that county's official final report (no statewide certified district figures loaded). Partial coverage: see per-county provenance.
Partial coverage: totals include only the counties loaded from certified sources (9 counties missing), so they are not the official district total.
| Candidate | Party | Votes | Share |
|---|---|---|---|
| Eric Burlison | Republican | 58,363 | 59.7% |
| Kristen Radaker-Sheafer | Democratic | 36,863 | 37.7% |
| Kevin Craig | Libertarian | 2,517 | 2.6% |
| Total | 97,743 |
Source: Missouri local election authorities, official precinct results; per-county provenance in election_contest_sources. Status: Official county precinct results; each loaded county reconciles exactly to that county's official final report (no statewide certified district figures loaded). Partial coverage: see per-county provenance.
Certified results from state or county election authorities, as compiled in the Candidate Alerts precinct results database (public API candidatealerts.com/api/district-results). Totals are sums of certified precinct and county-level rows.
Demographics
2020 Census demographics by district are not yet published in this data set.
0 of 320 precincts are above 50%, and 3 are above 25%. Source: Census American Community Survey 2020-2024 5-year block groups, allocated to current precinct shapes by area.
Poll status
Map
Share of adults (18+) who speak Spanish at home, by precinct. Census ACS 2020-2024 5-year estimates on the current precinct layer. Hover a precinct for its value.
District shown in red: U.S. Census Bureau cartographic boundary file for the 119th Congress (cb_2024_us_cd119_500k). These are the lines in effect for 2026 in this state per the Candidate Alerts district registry.
Precinct map: past elections and demographics
Choose a layer above. Hover a precinct for its values.
Precinct results
Precinct demographics
Demographics are Census American Community Survey (ACS) 2020-2024 5-year estimates for block groups, assigned to precincts by area share. They describe the resident population, not registered or likely voters, and include non-citizens. ACS margins of error are not shown; small precincts carry large error. Area weighting assumes people are spread evenly within each block group, so large rural precincts are the least reliable. Median income is a household-weighted average of block-group medians, an approximation.
| Area | Population | Voting-age pop. | % White non-Hisp. | % Hispanic | % Black | % Asian | Median income* | % Bachelor's+ | % 18-29 (of adults) | % 65+ | % Homeowners | % Below poverty | % Spanish at home (adults) |
|---|---|---|---|---|---|---|---|---|---|---|---|---|---|
| District | 782,825 | 605,083 | 84.0% | 6.5% | 1.8% | 1.4% | $68k | 27.7% | 21.3% | 18.2% | 65.8% | 14.0% | 3.3% |
| Greene (in district) | 300,737 | 238,171 | 84.0% | 5.1% | 3.0% | 1.9% | $69k | 33.6% | 25.9% | 17.2% | 57.6% | 13.6% | 2.2% |
| Jasper (in district) | 124,453 | 93,770 | 80.5% | 9.9% | 1.7% | 1.3% | $64k | 25.3% | 21.5% | 16.1% | 62.8% | 17.0% | 4.8% |
| Christian (in district) | 92,812 | 69,519 | 90.4% | 3.8% | 0.7% | 0.8% | $87k | 32.7% | 16.9% | 16.7% | 75.9% | 8.2% | 2.3% |
| Newton (in district) | 59,939 | 45,638 | 80.6% | 6.7% | 0.9% | 1.6% | $70k | 23.6% | 18.8% | 18.9% | 76.7% | 13.5% | 3.9% |
| Taney (in district) | 56,376 | 44,619 | 85.1% | 7.6% | 1.8% | 1.0% | $58k | 25.0% | 20.0% | 22.8% | 67.0% | 15.6% | 5.0% |
| Lawrence (in district) | 38,525 | 28,740 | 86.2% | 8.4% | 0.3% | 0.5% | $67k | 16.9% | 18.5% | 18.1% | 73.9% | 14.5% | 4.4% |
| Barry (in district) | 35,032 | 27,033 | 80.2% | 10.2% | 0.2% | 2.0% | $61k | 14.6% | 16.3% | 22.0% | 77.3% | 15.2% | 5.6% |
| Stone (in district) | 32,028 | 26,673 | 92.5% | 2.9% | 0.3% | 0.3% | $63k | 24.8% | 11.5% | 32.0% | 83.3% | 13.9% | 1.1% |
| McDonald (in district) | 23,696 | 17,661 | 68.3% | 12.4% | 2.0% | 1.3% | $54k | 12.3% | 18.3% | 15.6% | 67.3% | 16.8% | 8.8% |
| Webster (in district) | 19,226 | 13,260 | 92.1% | 3.0% | 0.5% | 0.0% | $66k | 17.0% | 16.5% | 13.4% | 76.7% | 17.9% | 1.2% |
Greene: 113 precincts
| Precinct | Population | Voting-age pop. | % White non-Hisp. | % Hispanic | % Black | % Asian | Median income* | % Bachelor's+ | % 18-29 (of adults) | % 65+ | % Homeowners | % Below poverty | % Spanish at home (adults) |
|---|---|---|---|---|---|---|---|---|---|---|---|---|---|
| 1st Boone Voting District | 1,421 | 1,020 | 89.4% | 2.2% | 0.1% | 0.2% | $72k | 30.4% | 13.0% | 16.7% | 80.4% | 5.6% | 0.7% |
| 1st Camp Voting District | 4,143 | 3,329 | 95.0% | 1.4% | 0.5% | 2.9% | $108k | 55.2% | 13.5% | 26.9% | 81.2% | 3.4% | 0.0% |
| 1st Center Voting District | 2,293 | 1,673 | 78.5% | 5.9% | 0.9% | 0.1% | $83k | 26.4% | 13.0% | 22.0% | 87.8% | 2.3% | 2.9% |
| 1st Franklin Voting District | 1,610 | 1,266 | 83.5% | 13.8% | 1.0% | 0.2% | $85k | 28.2% | 12.1% | 17.4% | 87.6% | 5.0% | 8.7% |
| 1st Jackson Voting District | 3,208 | 2,274 | 90.0% | 3.1% | 0.5% | 1.2% | $83k | 34.5% | 14.2% | 13.1% | 81.7% | 4.6% | 1.4% |
| 1st N Camp Voting District | 3,233 | 2,699 | 83.1% | 0.5% | 1.7% | 5.0% | $100k | 51.9% | 16.9% | 23.6% | 72.4% | 4.3% | 0.4% |
| 1st Robberson A Voting District | 673 | 576 | 97.4% | 0.0% | 0.0% | 0.0% | $86k | 35.3% | 15.8% | 20.3% | 93.3% | 2.3% | 0.4% |
| 1st Robberson B Voting District | 1,576 | 1,161 | 86.4% | 10.4% | 0.0% | 0.0% | $78k | 25.5% | 10.7% | 16.1% | 86.9% | 7.0% | 6.5% |
| 2nd Boone Voting District | 1,653 | 1,173 | 90.7% | 2.2% | 0.2% | 0.0% | $72k | 32.7% | 13.5% | 15.7% | 79.0% | 5.7% | 0.8% |
| 2nd Camp A Voting District | 8,168 | 6,619 | 75.7% | 11.1% | 2.8% | 5.9% | $64k | 30.0% | 25.3% | 12.0% | 54.6% | 7.8% | 3.8% |
| 2nd Camp B Voting District | 4,888 | 3,635 | 80.8% | 4.3% | 4.1% | 2.0% | $85k | 30.0% | 21.9% | 15.6% | 77.0% | 6.8% | 3.8% |
| 2nd Camp C Voting District | 2,118 | 1,814 | 88.4% | 0.4% | 3.5% | 3.2% | $94k | 46.2% | 8.8% | 35.0% | 90.9% | 4.4% | 0.1% |
| 2nd Camp CN Voting District | 1,600 | 1,355 | 86.2% | 3.2% | 3.7% | 0.1% | $57k | 25.2% | 11.2% | 36.0% | 66.1% | 8.3% | 4.0% |
| 2nd Franklin Voting District | 3,138 | 2,352 | 93.6% | 3.5% | 0.8% | 0.1% | $83k | 31.4% | 11.4% | 18.9% | 84.5% | 6.8% | 2.5% |
| 2nd Jackson Voting District | 5,365 | 3,420 | 92.6% | 3.2% | 0.0% | 0.0% | $78k | 24.5% | 14.8% | 11.3% | 83.0% | 8.4% | 0.6% |
| 2nd N Camp Voting District | 3,418 | 2,828 | 89.6% | 0.7% | 1.4% | 0.0% | $65k | 30.2% | 15.4% | 28.3% | 69.9% | 5.7% | 0.1% |
| 2nd Robberson Voting District | 3,315 | 2,439 | 89.1% | 1.2% | 0.2% | 0.6% | $78k | 33.8% | 15.0% | 15.7% | 76.5% | 7.2% | 0.1% |
| 3rd Center Voting District | 2,324 | 1,952 | 94.9% | 2.7% | 0.0% | 0.0% | $83k | 31.2% | 15.5% | 19.0% | 82.2% | 1.6% | 1.0% |
| 3rd N Camp A Voting District | 3,377 | 2,216 | 75.9% | 2.0% | 2.7% | 2.7% | $80k | 32.7% | 16.3% | 11.0% | 68.1% | 11.7% | 1.2% |
| 3rd N Camp B Voting District | 3,070 | 2,403 | 85.5% | 0.9% | 3.8% | 3.5% | $79k | 32.7% | 27.0% | 16.5% | 76.8% | 10.6% | 0.8% |
| Battlefield A Voting District | 5,844 | 4,600 | 87.2% | 4.7% | 0.8% | 2.1% | $100k | 45.8% | 14.8% | 21.8% | 84.9% | 4.3% | 1.6% |
| Battlefield B Voting District | 5,080 | 4,111 | 86.3% | 4.4% | 1.3% | 4.1% | $105k | 41.7% | 8.8% | 34.2% | 80.9% | 5.6% | 0.4% |
| Brookline Voting District | 8,064 | 5,554 | 81.5% | 8.3% | 2.4% | 1.6% | $79k | 31.0% | 30.7% | 7.7% | 66.8% | 16.7% | 5.1% |
| Cass Voting District | 1,340 | 989 | 87.0% | 1.2% | 0.0% | 0.3% | $101k | 27.5% | 9.4% | 18.0% | 92.2% | 2.6% | 0.9% |
| Cherokee Voting District | 4,232 | 3,401 | 87.0% | 4.3% | 1.3% | 2.1% | $101k | 45.6% | 13.3% | 29.0% | 67.3% | 5.3% | 2.8% |
| Clay B Voting District | 3,575 | 2,467 | 83.4% | 0.5% | 1.0% | 11.5% | $141k | 55.8% | 8.3% | 21.0% | 94.9% | 1.4% | 2.0% |
| Clay C Voting District | 2,985 | 2,241 | 85.1% | 5.6% | 0.4% | 6.4% | $165k | 67.4% | 8.7% | 23.7% | 97.3% | 2.3% | 1.9% |
| East Clay A Voting District | 1,502 | 1,093 | 85.1% | 7.2% | 0.0% | 3.9% | $140k | 52.0% | 14.1% | 24.2% | 90.0% | 4.0% | 3.9% |
| East Republic Voting District | 5,053 | 3,951 | 92.7% | 2.0% | 0.6% | 0.6% | $64k | 29.7% | 14.8% | 25.7% | 69.8% | 10.5% | 1.4% |
| Murray Voting District | 6,094 | 4,290 | 92.7% | 3.6% | 0.1% | 0.2% | $81k | 29.6% | 21.7% | 12.8% | 79.7% | 9.1% | 2.9% |
| Pond Creek Voting District | 1,920 | 1,352 | 99.8% | 0.0% | 0.0% | 0.0% | $89k | 33.0% | 9.3% | 12.5% | 95.7% | 4.5% | 0.0% |
| Republic North Voting District | 6,261 | 4,437 | 89.8% | 4.9% | 0.2% | 0.0% | $63k | 20.5% | 19.2% | 14.9% | 61.2% | 18.5% | 1.0% |
| Taylor Voting District | 2,526 | 1,934 | 95.1% | 0.7% | 0.0% | 0.1% | $116k | 35.5% | 16.2% | 23.4% | 80.0% | 6.0% | 0.9% |
| Voting District 11 | 2,094 | 1,700 | 95.0% | 1.9% | 0.7% | 0.8% | $98k | 52.1% | 13.5% | 33.1% | 65.2% | 3.8% | 0.1% |
| Voting District 12A | 1,762 | 1,588 | 79.4% | 8.8% | 3.3% | 0.1% | $55k | 36.5% | 32.5% | 13.2% | 40.5% | 12.5% | 1.2% |
| Voting District 12B | 2,119 | 2,043 | 70.7% | 4.8% | 6.2% | 6.4% | $44k | 39.5% | 66.9% | 8.2% | 17.7% | 30.9% | 0.9% |
| Voting District 16A | 1,872 | 1,327 | 79.0% | 8.6% | 4.9% | 0.9% | $36k | 19.6% | 29.6% | 11.9% | 38.1% | 30.8% | 1.8% |
| Voting District 16B | 1,063 | 796 | 84.2% | 5.2% | 4.4% | 0.0% | $36k | 9.8% | 34.3% | 9.4% | 50.4% | 36.7% | 1.4% |
| Voting District 16C | 3,188 | 2,122 | 76.6% | 6.7% | 4.8% | 0.2% | $51k | 7.9% | 33.2% | 10.3% | 54.2% | 20.2% | 2.8% |
| Voting District 1A | 1,157 | 928 | 83.5% | 2.0% | 6.8% | 2.5% | $46k | 28.3% | 34.2% | 10.2% | 31.8% | 22.6% | 0.8% |
| Voting District 1B | 1,157 | 902 | 87.5% | 1.1% | 5.1% | 3.8% | $95k | 74.7% | 14.1% | 17.3% | 73.8% | 9.9% | 1.4% |
| Voting District 1C | 992 | 871 | 76.5% | 3.5% | 4.0% | 0.3% | $57k | 63.4% | 43.8% | 8.4% | 35.6% | 20.4% | 0.6% |
| Voting District 20A | 2,464 | 2,230 | 82.6% | 2.3% | 6.7% | 1.2% | $57k | 23.4% | 54.6% | 5.8% | 33.0% | 22.3% | 0.8% |
| Voting District 20B | 1,487 | 1,204 | 84.5% | 4.8% | 6.3% | 0.3% | $34k | 6.3% | 28.2% | 9.2% | 43.8% | 30.7% | 0.8% |
| Voting District 22A | 2,433 | 1,848 | 61.5% | 17.0% | 17.3% | 0.2% | $37k | 9.4% | 42.2% | 9.2% | 28.7% | 38.8% | 1.0% |
| Voting District 22B | 3,082 | 2,210 | 77.9% | 1.8% | 4.9% | 0.3% | $36k | 11.1% | 24.8% | 9.2% | 22.2% | 24.2% | 3.1% |
| Voting District 22C | 2,138 | 1,913 | 87.7% | 1.2% | 5.2% | 0.4% | $41k | 23.0% | 45.8% | 7.2% | 36.5% | 26.5% | 0.8% |
| Voting District 26A | 1,428 | 1,177 | 82.1% | 8.7% | 5.7% | 0.0% | $44k | 20.4% | 28.4% | 11.8% | 33.4% | 21.2% | 1.8% |
| Voting District 26B | 1,049 | 819 | 83.8% | 4.2% | 9.1% | 0.2% | $62k | 13.3% | 22.6% | 7.7% | 44.2% | 21.0% | 0.0% |
| Voting District 26C | 1,096 | 872 | 84.4% | 1.3% | 4.2% | 0.0% | $53k | 17.0% | 27.4% | 14.1% | 51.7% | 20.5% | 8.1% |
| Voting District 27A | 1,459 | 998 | 77.0% | 1.1% | 6.0% | 0.0% | $44k | 10.4% | 27.0% | 10.4% | 45.2% | 41.2% | 1.1% |
| Voting District 27B | 2,268 | 1,846 | 76.5% | 9.9% | 4.3% | 0.0% | $40k | 16.7% | 26.7% | 13.6% | 62.1% | 29.9% | 6.7% |
| Voting District 27C | 2,878 | 2,142 | 79.4% | 11.3% | 2.1% | 0.6% | $60k | 14.5% | 32.0% | 11.6% | 50.0% | 25.3% | 7.4% |
| Voting District 29A | 3,943 | 2,978 | 71.4% | 15.8% | 3.6% | 0.6% | $56k | 24.7% | 24.3% | 11.0% | 47.8% | 19.5% | 9.6% |
| Voting District 29B | 2,289 | 1,912 | 82.3% | 0.0% | 4.5% | 0.0% | $45k | 20.9% | 22.4% | 21.3% | 50.4% | 14.9% | 0.1% |
| Voting District 29C | 1,424 | 1,188 | 89.7% | 1.7% | 2.0% | 0.0% | $57k | 24.0% | 19.8% | 25.2% | 53.1% | 13.2% | 4.9% |
| Voting District 2A | 566 | 422 | 81.7% | 1.9% | 11.3% | 2.6% | $65k | 58.1% | 20.0% | 22.9% | 68.1% | 19.6% | 2.5% |
| Voting District 2B | 903 | 770 | 84.7% | 0.6% | 8.4% | 1.7% | $90k | 85.0% | 31.2% | 6.0% | 53.6% | 12.7% | 1.4% |
| Voting District 30A | 2,702 | 2,023 | 67.7% | 23.1% | 1.7% | 3.6% | $58k | 21.0% | 18.9% | 19.2% | 56.7% | 12.1% | 6.3% |
| Voting District 30B | 1,384 | 1,262 | 75.2% | 12.4% | 7.4% | 1.5% | $37k | 8.4% | 68.7% | 4.8% | 55.6% | 32.4% | 2.0% |
| Voting District 31A | 1,586 | 1,171 | 77.9% | 7.4% | 2.4% | 2.9% | $66k | 22.1% | 24.6% | 14.8% | 56.8% | 8.4% | 1.8% |
| Voting District 31B | 1,576 | 1,249 | 88.1% | 0.0% | 1.9% | 0.3% | $40k | 35.2% | 26.9% | 17.8% | 48.7% | 15.8% | 0.7% |
| Voting District 31C | 1,449 | 1,245 | 78.7% | 13.7% | 2.2% | 0.0% | $55k | 17.3% | 13.4% | 19.7% | 56.9% | 8.6% | 4.9% |
| Voting District 32A | 1,509 | 1,083 | 96.8% | 1.1% | 0.0% | 1.6% | $94k | 55.6% | 17.5% | 17.0% | 80.2% | 6.0% | 0.0% |
| Voting District 32B | 2,400 | 1,809 | 87.8% | 2.2% | 0.7% | 5.9% | $82k | 48.2% | 9.6% | 25.4% | 81.9% | 11.7% | 0.0% |
| Voting District 32C | 1,106 | 970 | 93.9% | 5.5% | 0.0% | 0.2% | $46k | 33.4% | 27.9% | 21.4% | 25.3% | 19.0% | 3.0% |
| Voting District 33A | 1,387 | 1,180 | 88.1% | 10.0% | 0.1% | 0.0% | $60k | 44.1% | 35.1% | 10.4% | 50.4% | 7.2% | 2.1% |
| Voting District 33B | 1,305 | 983 | 80.9% | 7.2% | 5.9% | 3.8% | $52k | 26.2% | 26.8% | 10.2% | 54.4% | 27.7% | 1.5% |
| Voting District 34A | 3,385 | 2,646 | 84.2% | 5.6% | 4.5% | 0.5% | $48k | 25.7% | 41.2% | 16.5% | 30.9% | 13.5% | 0.7% |
| Voting District 34B | 1,818 | 1,574 | 87.5% | 5.3% | 0.6% | 3.2% | $60k | 37.2% | 27.6% | 13.7% | 53.9% | 7.7% | 0.3% |
| Voting District 34C | 6,018 | 5,042 | 78.1% | 6.9% | 7.6% | 1.3% | $52k | 24.8% | 32.6% | 15.3% | 24.6% | 19.0% | 2.5% |
| Voting District 35A | 4,293 | 3,735 | 78.2% | 8.9% | 6.4% | 0.6% | $41k | 26.4% | 39.1% | 11.5% | 29.5% | 18.8% | 2.9% |
| Voting District 35B | 4,282 | 3,274 | 83.7% | 5.6% | 4.4% | 0.2% | $67k | 31.5% | 25.0% | 18.6% | 65.5% | 11.0% | 2.6% |
| Voting District 36A | 2,224 | 1,685 | 77.6% | 5.7% | 5.9% | 2.0% | $56k | 19.8% | 31.0% | 13.0% | 60.7% | 12.1% | 4.5% |
| Voting District 37A | 1,541 | 1,231 | 71.6% | 10.1% | 5.2% | 0.0% | $56k | 32.6% | 40.9% | 13.6% | 36.8% | 16.7% | 2.6% |
| Voting District 37B | 2,081 | 1,697 | 87.8% | 1.6% | 1.0% | 0.5% | $54k | 31.9% | 17.9% | 23.6% | 56.6% | 13.4% | 2.0% |
| Voting District 37C | 1,822 | 1,481 | 84.9% | 5.4% | 2.6% | 0.0% | $40k | 23.6% | 35.2% | 7.1% | 24.1% | 16.8% | 1.2% |
| Voting District 38A | 1,363 | 996 | 93.9% | 0.0% | 0.0% | 0.0% | $100k | 53.5% | 11.0% | 14.3% | 70.6% | 7.5% | 0.0% |
| Voting District 38B | 2,182 | 1,674 | 85.9% | 7.6% | 0.0% | 0.3% | $43k | 18.5% | 41.3% | 7.8% | 14.7% | 15.0% | 4.7% |
| Voting District 39A | 3,068 | 2,606 | 84.1% | 2.9% | 4.4% | 0.4% | $75k | 39.9% | 14.9% | 33.2% | 62.2% | 11.8% | 2.0% |
| Voting District 39B | 4,703 | 3,811 | 82.3% | 7.4% | 2.0% | 3.2% | $86k | 46.4% | 23.3% | 18.0% | 71.2% | 8.5% | 0.6% |
| Voting District 39C | 3,958 | 3,135 | 90.2% | 5.2% | 1.0% | 1.8% | $118k | 51.0% | 14.3% | 27.5% | 86.8% | 3.9% | 2.1% |
| Voting District 3A | 1,068 | 905 | 77.7% | 6.1% | 1.8% | 2.1% | $80k | 58.4% | 24.5% | 18.9% | 63.5% | 11.1% | 1.1% |
| Voting District 3B | 3,644 | 3,536 | 84.6% | 0.9% | 6.6% | 1.7% | $40k | 37.3% | 84.4% | 2.8% | 8.9% | 54.7% | 0.8% |
| Voting District 40A | 2,232 | 2,068 | 79.2% | 9.1% | 4.6% | 1.0% | $41k | 24.8% | 30.8% | 19.7% | 16.5% | 22.3% | 3.3% |
| Voting District 40B | 2,608 | 2,169 | 90.3% | 3.6% | 1.4% | 0.0% | $69k | 40.0% | 13.6% | 31.6% | 44.7% | 7.1% | 2.8% |
| Voting District 41A | 3,246 | 2,892 | 77.1% | 6.2% | 6.3% | 6.6% | $52k | 35.8% | 26.0% | 28.2% | 38.3% | 11.3% | 6.5% |
| Voting District 41B | 1,710 | 1,460 | 77.5% | 8.1% | 0.7% | 9.1% | $42k | 36.8% | 32.9% | 25.2% | 17.9% | 14.3% | 6.5% |
| Voting District 42A | 3,752 | 3,189 | 88.2% | 3.4% | 3.6% | 2.3% | $74k | 44.4% | 18.8% | 30.1% | 68.1% | 10.5% | 0.9% |
| Voting District 42B | 3,012 | 2,646 | 82.6% | 6.3% | 4.1% | 2.6% | $63k | 43.5% | 28.9% | 20.4% | 46.0% | 11.4% | 2.5% |
| Voting District 42C | 1,578 | 1,320 | 71.4% | 17.8% | 0.0% | 3.8% | $50k | 15.2% | 25.3% | 24.9% | 76.1% | 8.6% | 6.3% |
| Voting District 44A | 2,617 | 2,268 | 72.0% | 5.8% | 7.6% | 9.4% | $47k | 28.4% | 30.1% | 22.2% | 37.9% | 18.0% | 3.5% |
| Voting District 44B | 1,141 | 965 | 85.9% | 3.5% | 5.0% | 2.7% | $45k | 37.3% | 29.0% | 19.2% | 53.1% | 15.7% | 0.0% |
| Voting District 44C | 1,848 | 1,250 | 75.5% | 5.5% | 13.7% | 2.9% | $61k | 39.1% | 18.4% | 13.7% | 67.3% | 16.8% | 1.2% |
| Voting District 45A | 1,249 | 1,040 | 97.5% | 0.0% | 0.0% | 0.0% | $92k | 57.9% | 15.2% | 22.5% | 83.6% | 3.1% | 0.0% |
| Voting District 45B | 1,236 | 940 | 97.0% | 0.4% | 0.0% | 0.0% | $115k | 76.6% | 7.7% | 25.6% | 77.7% | 2.1% | 0.0% |
| Voting District 4A | 1,652 | 1,298 | 72.4% | 6.4% | 1.3% | 4.0% | $59k | 48.3% | 32.9% | 10.0% | 52.8% | 11.0% | 0.4% |
| Voting District 4B | 1,839 | 1,771 | 85.0% | 1.6% | 7.8% | 1.7% | $30k | 25.2% | 65.6% | 5.0% | 10.7% | 44.3% | 0.7% |
| Voting District 5A | 1,680 | 1,319 | 88.5% | 2.1% | 0.0% | 1.6% | $48k | 37.0% | 30.6% | 6.0% | 58.1% | 4.8% | 0.0% |
| Voting District 5B | 1,876 | 1,579 | 90.4% | 1.7% | 3.8% | 0.7% | $33k | 18.5% | 42.1% | 6.7% | 24.5% | 29.4% | 0.4% |
| Voting District 6A | 2,480 | 2,295 | 89.6% | 2.4% | 0.5% | 5.8% | $75k | 47.4% | 34.6% | 28.8% | 32.9% | 19.4% | 0.1% |
| Voting District 6B | 1,987 | 1,517 | 83.9% | 6.9% | 1.7% | 0.2% | $41k | 27.4% | 35.6% | 10.6% | 36.1% | 21.1% | 9.2% |
| Voting District 7A | 2,206 | 1,734 | 87.0% | 2.2% | 3.1% | 1.6% | $41k | 20.6% | 30.6% | 18.3% | 42.5% | 28.1% | 2.8% |
| Voting District 7B | 1,668 | 1,379 | 83.5% | 6.1% | 1.9% | 2.0% | $47k | 10.3% | 19.8% | 14.1% | 46.0% | 24.6% | 9.8% |
| Voting District 7C | 3,449 | 2,622 | 69.5% | 8.6% | 10.1% | 1.4% | $50k | 14.2% | 13.6% | 14.0% | 59.7% | 21.7% | 2.6% |
| Voting District 9A | 2,281 | 1,967 | 78.5% | 5.8% | 4.1% | 0.2% | $36k | 21.2% | 38.3% | 16.0% | 22.5% | 31.6% | 2.4% |
| Voting District 9B | 4,668 | 4,517 | 65.5% | 8.0% | 12.9% | 6.0% | $27k | 35.2% | 72.7% | 3.6% | 2.6% | 56.4% | 1.2% |
| Walnut Grove Voting District | 1,401 | 1,115 | 84.7% | 2.6% | 0.0% | 2.1% | $63k | 13.7% | 13.0% | 22.0% | 83.9% | 6.1% | 0.4% |
| Washington Voting District | 3,482 | 2,492 | 99.2% | 0.0% | 0.0% | 0.0% | $95k | 36.3% | 20.9% | 23.3% | 82.3% | 5.8% | 1.0% |
| West Republic Voting District | 4,788 | 3,948 | 91.8% | 4.0% | 0.0% | 0.0% | $77k | 31.0% | 24.6% | 17.8% | 61.0% | 14.4% | 0.5% |
| Wilson A Voting District | 5,067 | 4,200 | 79.3% | 8.2% | 2.5% | 1.5% | $56k | 28.2% | 37.7% | 13.8% | 36.7% | 21.6% | 3.0% |
| Wilson C Voting District | 4,433 | 3,371 | 90.4% | 2.0% | 1.7% | 3.4% | $87k | 51.7% | 16.0% | 15.8% | 76.6% | 5.8% | 0.0% |
| Wilson CW Voting District | 4,319 | 3,414 | 89.3% | 3.1% | 0.7% | 3.8% | $107k | 51.0% | 16.8% | 17.6% | 87.9% | 7.2% | 0.5% |
Jasper: 45 precincts
| Precinct | Population | Voting-age pop. | % White non-Hisp. | % Hispanic | % Black | % Asian | Median income* | % Bachelor's+ | % 18-29 (of adults) | % 65+ | % Homeowners | % Below poverty | % Spanish at home (adults) |
|---|---|---|---|---|---|---|---|---|---|---|---|---|---|
| ALBA/NECK CITY/PURCELL Voting District | 403 | 271 | 81.5% | 11.9% | 0.0% | 0.0% | $63k | 21.3% | 11.6% | 16.5% | 83.9% | 14.9% | 2.9% |
| ASBURY/MEDOC/WACO Voting District | 1,308 | 995 | 95.7% | 0.2% | 0.6% | 0.0% | $92k | 24.3% | 10.6% | 21.9% | 87.0% | 11.6% | 0.6% |
| CARL JUNCTION 1/CARL JUNCTION 2 Voting District | 5,460 | 3,812 | 90.4% | 2.6% | 0.1% | 0.7% | $76k | 35.2% | 16.8% | 13.1% | 77.0% | 7.5% | 1.6% |
| CARL JUNCTION 3/CARL JUNCTION 4 | 2,828 | 2,131 | 89.3% | 5.4% | 0.0% | 2.5% | $83k | 41.3% | 16.7% | 15.5% | 85.8% | 9.8% | 1.8% |
| CARTERVILLE - ALL WARDS (1-4) | 3,076 | 2,190 | 83.4% | 9.1% | 0.2% | 0.4% | $59k | 15.6% | 21.8% | 12.9% | 66.4% | 23.0% | 3.9% |
| CARTHAGE 1 | 2,659 | 1,651 | 54.3% | 39.7% | 1.4% | 0.4% | $40k | 14.8% | 26.4% | 9.9% | 57.7% | 33.0% | 31.0% |
| CARTHAGE 2 | 2,385 | 1,638 | 39.6% | 56.9% | 0.3% | 0.1% | $47k | 18.3% | 30.4% | 10.3% | 50.8% | 24.4% | 45.5% |
| CARTHAGE 3 | 2,875 | 1,963 | 48.8% | 45.3% | 2.4% | 0.0% | $48k | 20.2% | 22.3% | 12.5% | 57.9% | 32.4% | 23.1% |
| CARTHAGE 4 | 3,354 | 2,344 | 77.5% | 17.4% | 1.0% | 0.0% | $55k | 24.6% | 20.8% | 18.5% | 51.2% | 34.1% | 13.5% |
| CARTHAGE 5 | 1,725 | 1,213 | 65.9% | 26.4% | 2.6% | 0.0% | $61k | 24.9% | 15.6% | 13.8% | 51.3% | 23.0% | 13.8% |
| CENTENNIAL/GEM/REEDS Voting District | 3,322 | 2,633 | 91.4% | 3.3% | 0.1% | 0.1% | $93k | 22.2% | 18.9% | 19.6% | 92.5% | 10.6% | 0.4% |
| DUENWEG Voting District | 1,682 | 1,283 | 82.1% | 7.7% | 1.6% | 2.6% | $68k | 17.8% | 10.7% | 17.2% | 65.4% | 13.4% | 5.4% |
| EAST JACKSON Voting District | 2,542 | 1,865 | 77.8% | 14.0% | 0.7% | 0.0% | $78k | 28.2% | 18.5% | 15.1% | 72.2% | 9.2% | 2.0% |
| JASPER Voting District | 1,182 | 884 | 91.4% | 1.2% | 0.0% | 0.0% | $62k | 22.8% | 16.3% | 18.2% | 82.6% | 11.2% | 1.4% |
| JOPLIN 1 \ JOPLIN 8 Voting District | 2,339 | 1,994 | 77.0% | 9.4% | 6.7% | 1.2% | $57k | 20.4% | 26.8% | 16.4% | 42.8% | 26.8% | 3.1% |
| JOPLIN 10 \ JOPLIN 11 Voting District | 3,593 | 2,872 | 81.2% | 4.0% | 4.6% | 1.1% | $50k | 16.9% | 26.9% | 15.0% | 46.1% | 20.8% | 2.4% |
| JOPLIN 12 \ JOPLIN 14 Voting District | 3,444 | 2,882 | 79.6% | 9.8% | 3.1% | 0.0% | $31k | 13.6% | 22.2% | 14.3% | 42.6% | 25.8% | 4.4% |
| JOPLIN 15 \ CENTRAL CITY Voting District | 4,984 | 4,145 | 88.4% | 2.4% | 1.3% | 1.5% | $74k | 30.1% | 17.9% | 19.4% | 76.7% | 7.4% | 0.9% |
| JOPLIN 16 \ JOPLIN 18 Voting District | 2,841 | 1,907 | 68.3% | 21.5% | 3.5% | 0.0% | $36k | 17.8% | 28.1% | 9.2% | 51.2% | 18.1% | 5.6% |
| JOPLIN 2 \ JOPLIN 3 Voting District | 6,852 | 5,335 | 82.2% | 3.3% | 2.7% | 3.3% | $74k | 33.3% | 23.6% | 16.5% | 70.2% | 8.1% | 2.2% |
| JOPLIN 22 \ JOPLIN 24 Voting District | 5,514 | 4,185 | 80.7% | 6.1% | 3.9% | 3.5% | $51k | 22.1% | 23.8% | 18.9% | 46.9% | 17.6% | 2.4% |
| JOPLIN NO. 13 Voting District | 1,340 | 1,109 | 70.5% | 16.2% | 4.1% | 1.4% | $47k | 20.1% | 24.4% | 21.1% | 53.2% | 16.1% | 5.9% |
| JOPLIN NO. 23 Voting District | 4,009 | 3,037 | 74.8% | 7.6% | 0.8% | 4.7% | $57k | 30.1% | 26.1% | 17.3% | 47.8% | 15.0% | 4.9% |
| JOPLIN NO. 25 Voting District | 2,351 | 1,765 | 87.8% | 3.9% | 0.7% | 0.5% | $58k | 16.6% | 19.9% | 17.4% | 62.4% | 18.0% | 1.8% |
| JOPLIN NO. 26 Voting District | 2,365 | 1,919 | 83.2% | 6.8% | 1.6% | 2.5% | $65k | 20.9% | 31.7% | 20.2% | 51.1% | 14.5% | 0.3% |
| JOPLIN NO. 4 Voting District | 4,622 | 3,814 | 77.0% | 5.8% | 1.3% | 2.3% | $51k | 29.6% | 29.9% | 20.6% | 37.1% | 23.9% | 1.6% |
| JOPLIN NO. 5/ JOPLIN NO. 7 Voting District | 4,115 | 3,223 | 78.7% | 7.2% | 4.7% | 0.3% | $38k | 10.7% | 31.4% | 13.2% | 26.5% | 37.6% | 1.9% |
| LAKESIDE Voting District | 1,608 | 1,209 | 88.2% | 6.9% | 0.2% | 0.2% | $104k | 42.2% | 22.8% | 12.1% | 87.4% | 10.0% | 0.7% |
| LINCOLN / SHERIDAN Voting District | 888 | 680 | 88.4% | 9.4% | 0.0% | 0.0% | $80k | 18.7% | 14.3% | 10.3% | 97.8% | 2.4% | 7.4% |
| MARION Voting District | 1,245 | 935 | 86.1% | 4.8% | 0.5% | 0.0% | $72k | 33.2% | 15.7% | 16.9% | 83.0% | 9.1% | 3.7% |
| MCDONALD Voting District | 844 | 584 | 92.3% | 2.7% | 1.7% | 0.0% | $66k | 29.2% | 10.6% | 20.8% | 87.8% | 7.6% | 2.8% |
| MONITOR Voting District | 3,035 | 2,398 | 78.2% | 12.7% | 1.0% | 0.4% | $68k | 26.0% | 17.0% | 14.6% | 66.4% | 16.4% | 6.3% |
| NORTH MADISON Voting District | 1,674 | 1,228 | 80.2% | 15.9% | 1.0% | 0.0% | $71k | 19.4% | 16.5% | 17.0% | 81.0% | 3.0% | 11.5% |
| ORONOGO 1 Voting District | 2,365 | 1,745 | 90.6% | 2.3% | 0.1% | 1.2% | $89k | 25.6% | 21.9% | 14.8% | 83.7% | 10.0% | 1.1% |
| ORONOGO 2 Voting District | 3,480 | 2,406 | 86.9% | 10.3% | 0.1% | 0.1% | $86k | 26.6% | 11.4% | 13.5% | 91.7% | 8.2% | 2.7% |
| PINE / PRARIE STAR Voting District | 1,602 | 1,098 | 82.8% | 8.2% | 0.1% | 0.0% | $61k | 20.5% | 11.7% | 19.2% | 81.2% | 17.9% | 1.8% |
| REX Voting District | 2,967 | 2,446 | 79.4% | 5.8% | 0.6% | 5.9% | $52k | 25.9% | 20.6% | 20.4% | 44.3% | 18.0% | 2.2% |
| SARCOXIE 1/ SARCOXIE 2/LA RUSSELL Voting District | 2,564 | 1,871 | 90.2% | 6.5% | 0.0% | 0.0% | $55k | 8.5% | 15.2% | 15.8% | 74.7% | 29.6% | 0.9% |
| SOUTH MADISON Voting District | 1,034 | 803 | 77.4% | 15.7% | 0.7% | 0.4% | $76k | 22.6% | 14.4% | 25.6% | 90.0% | 7.6% | 11.4% |
| TUCKAHOE Voting District | 3,839 | 2,940 | 87.1% | 4.3% | 1.6% | 1.5% | $74k | 35.8% | 16.9% | 20.0% | 79.5% | 10.4% | 3.1% |
| WEBB CITY 4 Voting District | 267 | 196 | 87.9% | 2.4% | 0.0% | 1.6% | $89k | 34.9% | 30.1% | 15.5% | 75.9% | 10.3% | 0.6% |
| WEBB CITY WARD 1 / WARD 4 | 2,718 | 1,993 | 87.8% | 2.1% | 0.2% | 3.3% | $67k | 20.8% | 25.8% | 14.1% | 65.1% | 19.6% | 1.5% |
| WEBB CITY WARD 2 / WARD 3 | 6,529 | 4,849 | 82.6% | 4.6% | 3.4% | 1.2% | $67k | 33.9% | 24.4% | 16.6% | 59.0% | 21.3% | 1.4% |
| WEST JACKSON Voting District | 1,857 | 1,360 | 79.5% | 14.2% | 0.1% | 0.1% | $84k | 25.5% | 20.4% | 13.9% | 76.4% | 11.1% | 1.5% |
| ZINCITE Voting District | 2,770 | 1,968 | 86.1% | 6.6% | 0.5% | 0.7% | $93k | 38.0% | 13.6% | 14.1% | 77.1% | 9.1% | 5.5% |
Christian: 33 precincts
| Precinct | Population | Voting-age pop. | % White non-Hisp. | % Hispanic | % Black | % Asian | Median income* | % Bachelor's+ | % 18-29 (of adults) | % 65+ | % Homeowners | % Below poverty | % Spanish at home (adults) |
|---|---|---|---|---|---|---|---|---|---|---|---|---|---|
| BRUNER Voting District | 764 | 607 | 95.1% | 0.6% | 0.0% | 0.0% | $81k | 27.6% | 13.2% | 18.4% | 84.9% | 1.2% | 0.0% |
| CASSIDY 2 Voting District | 2,276 | 1,748 | 88.9% | 4.2% | 0.4% | 0.7% | $99k | 53.7% | 18.9% | 20.8% | 82.7% | 8.5% | 1.2% |
| CASSIDY Voting District | 8,461 | 6,228 | 84.9% | 5.7% | 1.7% | 0.6% | $77k | 36.8% | 21.9% | 14.4% | 63.3% | 10.1% | 2.5% |
| CHADWICK Voting District | 199 | 143 | 96.3% | 0.4% | 0.0% | 0.0% | $76k | 20.7% | 5.4% | 14.2% | 84.3% | 19.2% | 0.0% |
| EAST BENTON Voting District | 504 | 399 | 95.3% | 0.6% | 0.0% | 0.0% | $81k | 27.5% | 12.6% | 18.5% | 85.2% | 1.3% | 0.0% |
| EAST FINLEY Voting District | 4,886 | 3,648 | 89.2% | 2.7% | 1.9% | 0.8% | $73k | 20.4% | 22.1% | 12.8% | 76.9% | 9.0% | 0.8% |
| GARDEN GROVE Voting District | 3,969 | 2,821 | 89.5% | 0.6% | 2.3% | 1.4% | $92k | 36.5% | 23.2% | 12.3% | 71.6% | 8.5% | 2.0% |
| GARRISON Voting District | 383 | 258 | 97.4% | 0.5% | 0.0% | 0.0% | $69k | 18.8% | 6.0% | 11.4% | 82.5% | 20.8% | 0.0% |
| LEAD HILL Voting District | 217 | 146 | 97.4% | 0.5% | 0.0% | 0.0% | $69k | 18.8% | 6.0% | 11.4% | 82.5% | 20.8% | 0.0% |
| LINCOLN 2 Voting District | 3,396 | 2,414 | 92.1% | 2.7% | 0.0% | 1.5% | $87k | 24.7% | 26.5% | 8.1% | 72.4% | 6.2% | 0.4% |
| LINCOLN Voting District | 3,274 | 2,360 | 95.6% | 2.0% | 0.0% | 0.0% | $101k | 32.5% | 14.5% | 12.9% | 88.8% | 2.8% | 0.2% |
| LINDEN Voting District | 1,947 | 1,476 | 96.9% | 1.1% | 0.0% | 0.0% | $97k | 36.3% | 6.1% | 18.9% | 89.1% | 2.7% | 0.8% |
| MCCRACKEN Voting District | 4,715 | 3,545 | 90.0% | 4.0% | 0.9% | 0.0% | $87k | 30.2% | 14.8% | 17.2% | 85.7% | 6.9% | 2.6% |
| NORTH GALLOWAY Voting District | 3,058 | 2,405 | 93.4% | 2.3% | 0.3% | 0.1% | $80k | 32.9% | 13.8% | 20.1% | 88.1% | 9.3% | 1.4% |
| NORTH LINN Voting District | 877 | 705 | 93.9% | 1.3% | 0.3% | 0.1% | $117k | 39.4% | 8.6% | 19.7% | 96.5% | 6.4% | 1.7% |
| NORTHVIEW 1 Voting District | 8,321 | 5,794 | 90.4% | 1.4% | 1.4% | 2.5% | $101k | 36.4% | 13.3% | 19.4% | 76.5% | 2.8% | 1.2% |
| NORTHVIEW 2 Voting District | 2,525 | 1,873 | 87.4% | 6.9% | 0.1% | 0.6% | $93k | 42.0% | 10.9% | 15.6% | 71.0% | 2.3% | 6.2% |
| OLDFIELD Voting District | 499 | 407 | 96.2% | 0.8% | 0.0% | 0.0% | $85k | 24.8% | 9.9% | 21.7% | 87.1% | 2.3% | 0.0% |
| POLK Voting District | 3,352 | 2,651 | 94.7% | 2.3% | 0.0% | 0.0% | $79k | 23.8% | 12.9% | 23.2% | 91.8% | 7.3% | 0.0% |
| RIVERSIDE 2 Voting District | 3,598 | 2,693 | 90.9% | 1.2% | 0.2% | 2.1% | $76k | 43.0% | 14.3% | 14.6% | 66.9% | 4.7% | 0.6% |
| RIVERSIDE Voting District | 3,597 | 2,734 | 91.4% | 4.6% | 0.0% | 0.0% | $81k | 32.5% | 16.1% | 18.5% | 79.7% | 9.0% | 4.0% |
| ROSEDALE 1A Voting District | 2,235 | 1,799 | 91.9% | 3.1% | 0.0% | 3.0% | $70k | 25.3% | 26.1% | 14.4% | 58.0% | 12.1% | 1.9% |
| ROSEDALE 1B Voting District | 1,778 | 1,412 | 91.6% | 2.9% | 0.4% | 2.3% | $65k | 22.3% | 23.2% | 15.5% | 56.9% | 13.1% | 1.4% |
| ROSEDALE 2 Voting District | 5,515 | 4,247 | 93.3% | 2.8% | 0.2% | 1.4% | $88k | 35.4% | 21.0% | 16.4% | 70.0% | 7.2% | 1.0% |
| SADDLEBROOKE Voting District | 245 | 187 | 93.1% | 3.4% | 0.6% | 0.1% | $116k | 37.0% | 12.4% | 16.6% | 94.5% | 7.6% | 2.3% |
| SENECA Voting District | 196 | 132 | 97.4% | 0.5% | 0.0% | 0.0% | $69k | 18.8% | 6.0% | 11.4% | 82.5% | 20.8% | 0.0% |
| SOUTH GALLOWAY Voting District | 2,367 | 1,836 | 88.2% | 8.3% | 0.7% | 0.0% | $106k | 26.8% | 15.0% | 16.9% | 91.6% | 13.3% | 1.4% |
| SOUTH LINN Voting District | 334 | 285 | 93.0% | 0.2% | 0.0% | 0.0% | $91k | 24.9% | 4.2% | 21.9% | 87.9% | 15.0% | 0.0% |
| SPARTA Voting District | 3,423 | 2,676 | 95.7% | 1.5% | 0.0% | 0.0% | $73k | 14.5% | 15.2% | 21.5% | 77.0% | 9.1% | 1.1% |
| UNION CHAPEL 1 Voting District | 3,615 | 2,695 | 80.2% | 14.2% | 0.3% | 0.8% | $92k | 37.6% | 17.9% | 18.3% | 66.7% | 5.1% | 4.5% |
| UNION CHAPEL 2 Voting District | 5,878 | 4,576 | 90.8% | 2.9% | 0.8% | 0.3% | $106k | 47.9% | 12.0% | 18.8% | 78.7% | 5.8% | 4.5% |
| WEST BENTON Voting District | 810 | 604 | 97.6% | 0.1% | 0.0% | 0.0% | $97k | 25.6% | 1.7% | 20.2% | 90.3% | 3.7% | 0.0% |
| WEST FINLEY Voting District | 5,597 | 4,014 | 86.7% | 8.9% | 0.6% | 0.0% | $74k | 25.4% | 19.3% | 17.0% | 67.5% | 24.0% | 9.0% |
Newton: 23 precincts
| Precinct | Population | Voting-age pop. | % White non-Hisp. | % Hispanic | % Black | % Asian | Median income* | % Bachelor's+ | % 18-29 (of adults) | % 65+ | % Homeowners | % Below poverty | % Spanish at home (adults) |
|---|---|---|---|---|---|---|---|---|---|---|---|---|---|
| Crowder Voting District | 3,247 | 2,523 | 78.3% | 9.6% | 0.8% | 1.8% | $67k | 24.3% | 18.8% | 16.1% | 71.0% | 12.8% | 4.5% |
| Diamond Voting District | 4,785 | 3,583 | 83.8% | 9.4% | 0.3% | 0.8% | $66k | 19.3% | 19.8% | 21.1% | 78.7% | 9.2% | 3.1% |
| East Neosho Voting District | 3,693 | 2,727 | 70.9% | 14.5% | 0.8% | 4.3% | $64k | 19.7% | 27.5% | 11.3% | 65.1% | 13.0% | 10.6% |
| Fairview Voting District | 876 | 652 | 68.5% | 9.0% | 0.0% | 12.1% | $58k | 16.5% | 18.3% | 15.5% | 83.1% | 22.0% | 3.3% |
| Granby Voting District | 4,516 | 3,336 | 89.4% | 2.2% | 0.2% | 0.9% | $59k | 16.2% | 25.4% | 14.8% | 81.3% | 19.9% | 1.4% |
| Hornet Voting District | 4,196 | 3,290 | 84.5% | 1.5% | 1.7% | 0.4% | $83k | 23.8% | 18.4% | 18.8% | 89.1% | 9.1% | 0.7% |
| Neosho #1 Voting District | 3,149 | 2,511 | 89.9% | 0.9% | 0.7% | 0.0% | $76k | 24.7% | 17.8% | 22.2% | 67.8% | 9.9% | 1.4% |
| Neosho #2 Voting District | 1,622 | 1,244 | 85.6% | 5.2% | 0.0% | 1.0% | $52k | 27.5% | 20.0% | 16.0% | 69.0% | 20.0% | 5.6% |
| Neosho #4 Voting District | 2,918 | 1,936 | 55.4% | 12.0% | 0.0% | 0.3% | $49k | 15.4% | 33.6% | 12.8% | 57.2% | 13.2% | 10.8% |
| Neosho No. 3 Voting District | 2,256 | 1,837 | 56.0% | 32.6% | 1.8% | 0.1% | $57k | 14.7% | 25.1% | 12.1% | 48.6% | 20.5% | 21.7% |
| Newtonia Voting District | 616 | 468 | 88.8% | 1.9% | 0.1% | 3.4% | $66k | 16.7% | 21.6% | 17.4% | 91.2% | 16.2% | 0.5% |
| Reding Voting District | 2,379 | 1,901 | 86.7% | 6.1% | 0.7% | 0.4% | $101k | 36.0% | 13.3% | 19.5% | 91.7% | 11.7% | 1.0% |
| Ritchey Voting District | 744 | 584 | 87.1% | 2.3% | 0.0% | 3.5% | $58k | 17.5% | 15.7% | 18.8% | 86.1% | 15.0% | 1.3% |
| Seneca Voting District | 3,832 | 2,723 | 81.5% | 3.2% | 0.0% | 0.0% | $56k | 15.9% | 18.6% | 19.0% | 73.2% | 20.3% | 1.1% |
| Staples #21 Voting District | 1,177 | 1,027 | 80.5% | 3.0% | 2.0% | 6.0% | $102k | 38.2% | 9.5% | 31.4% | 87.0% | 9.4% | 1.8% |
| Staples #27 Voting District | 3,886 | 2,821 | 88.1% | 1.8% | 1.5% | 3.0% | $68k | 34.3% | 11.9% | 26.1% | 60.8% | 10.0% | 1.3% |
| Staples East Voting District | 742 | 576 | 84.7% | 5.1% | 1.7% | 0.1% | $92k | 41.6% | 11.0% | 24.4% | 90.3% | 10.7% | 1.5% |
| Staples West Voting District | 2,766 | 2,343 | 85.5% | 3.5% | 1.3% | 4.2% | $96k | 39.3% | 9.6% | 28.3% | 88.6% | 6.3% | 2.0% |
| Stella Voting District | 916 | 680 | 67.1% | 9.8% | 0.0% | 12.5% | $60k | 16.5% | 20.0% | 15.4% | 83.1% | 22.5% | 3.6% |
| Thurman Voting District | 3,016 | 2,227 | 78.3% | 7.0% | 5.0% | 0.4% | $73k | 23.6% | 16.6% | 17.0% | 84.5% | 11.1% | 3.4% |
| Wentworth Voting District | 903 | 751 | 84.6% | 2.8% | 0.0% | 1.8% | $58k | 13.5% | 10.1% | 24.2% | 86.6% | 9.3% | 2.3% |
| West Neosho Voting District | 4,442 | 3,499 | 84.0% | 6.1% | 0.5% | 0.2% | $68k | 23.2% | 17.1% | 22.2% | 82.3% | 15.0% | 4.4% |
| Westview Voting District | 3,262 | 2,398 | 80.5% | 3.4% | 1.0% | 0.2% | $68k | 21.7% | 17.4% | 16.1% | 86.8% | 14.9% | 0.5% |
Taney: 21 precincts
| Precinct | Population | Voting-age pop. | % White non-Hisp. | % Hispanic | % Black | % Asian | Median income* | % Bachelor's+ | % 18-29 (of adults) | % 65+ | % Homeowners | % Below poverty | % Spanish at home (adults) |
|---|---|---|---|---|---|---|---|---|---|---|---|---|---|
| BOSTON CENTER Voting District | 1,151 | 863 | 88.9% | 7.9% | 0.0% | 0.0% | $70k | 34.1% | 14.0% | 18.1% | 79.0% | 5.3% | 3.4% |
| BRADLEYVILLE | 1,096 | 861 | 92.4% | 1.6% | 1.3% | 0.0% | $73k | 21.1% | 21.0% | 19.7% | 87.8% | 7.0% | 0.2% |
| BRANSON 1 Voting District | 4,512 | 3,373 | 65.4% | 10.2% | 13.0% | 3.2% | $48k | 34.1% | 26.4% | 14.1% | 38.8% | 26.5% | 8.9% |
| BRANSON 2 Voting District | 3,565 | 2,938 | 88.5% | 3.6% | 0.2% | 3.3% | $65k | 27.9% | 16.9% | 27.0% | 52.5% | 13.4% | 2.2% |
| BRANSON 3 | 3,632 | 3,092 | 75.8% | 20.1% | 0.9% | 0.9% | $54k | 25.1% | 22.8% | 33.0% | 59.5% | 20.2% | 18.3% |
| CEDARCREEK | 734 | 581 | 94.2% | 0.7% | 0.4% | 0.3% | $51k | 14.7% | 22.4% | 24.3% | 82.9% | 30.9% | 0.0% |
| FORSYTH 1 | 2,098 | 1,782 | 86.3% | 4.8% | 1.2% | 0.0% | $54k | 26.3% | 14.9% | 30.1% | 73.0% | 13.0% | 3.9% |
| FORSYTH 2 | 5,175 | 4,153 | 90.8% | 3.2% | 0.5% | 0.3% | $49k | 18.1% | 10.3% | 31.9% | 76.9% | 17.6% | 2.5% |
| HOLLISTER 1 Voting District | 4,160 | 3,801 | 89.7% | 2.2% | 2.4% | 0.9% | $69k | 19.4% | 38.9% | 20.4% | 78.2% | 8.2% | 1.4% |
| HOLLISTER 2 Voting District | 4,638 | 3,261 | 80.5% | 17.1% | 0.0% | 1.1% | $51k | 23.8% | 15.3% | 16.4% | 64.4% | 13.3% | 7.4% |
| HOLLISTER 3 Voting District | 2,257 | 2,036 | 88.5% | 3.8% | 1.2% | 0.1% | $60k | 27.7% | 14.1% | 36.0% | 80.9% | 7.8% | 0.8% |
| KIRBYVILLE Voting District | 2,236 | 1,771 | 91.6% | 3.4% | 0.1% | 0.0% | $54k | 19.3% | 22.5% | 22.0% | 65.1% | 21.2% | 2.0% |
| KISSEE MILLS | 1,139 | 962 | 93.0% | 4.5% | 0.4% | 0.1% | $64k | 16.9% | 12.4% | 31.0% | 91.5% | 12.2% | 0.7% |
| MERRIAM WOODS Voting District | 1,064 | 800 | 89.4% | 6.3% | 1.1% | 0.0% | $51k | 11.8% | 18.3% | 16.7% | 79.2% | 22.7% | 4.8% |
| MT BRANSON Voting District | 4,336 | 2,889 | 90.6% | 3.7% | 0.2% | 1.2% | $72k | 27.7% | 15.3% | 16.6% | 89.0% | 9.3% | 2.5% |
| Mark Twain | 889 | 724 | 93.4% | 0.5% | 2.2% | 1.1% | $54k | 12.0% | 27.1% | 22.9% | 87.8% | 17.0% | 0.0% |
| NORTH BRANSON Voting District | 6,565 | 5,132 | 84.6% | 8.4% | 1.0% | 1.3% | $63k | 28.4% | 21.9% | 21.5% | 49.7% | 17.9% | 4.7% |
| ROCKAWAY BEACH Voting District | 973 | 737 | 89.0% | 4.9% | 2.6% | 0.0% | $58k | 16.9% | 18.5% | 18.2% | 74.5% | 18.3% | 5.3% |
| SKYLINE Voting District | 1,300 | 1,096 | 73.4% | 22.7% | 0.9% | 1.0% | $51k | 29.4% | 22.8% | 28.3% | 58.3% | 23.6% | 16.6% |
| TANEYVILLE Voting District | 1,020 | 820 | 94.0% | 0.7% | 0.3% | 0.0% | $72k | 17.9% | 22.7% | 17.1% | 82.7% | 8.5% | 0.3% |
| WALNUT SHADE | 3,839 | 2,949 | 84.9% | 9.4% | 0.8% | 0.0% | $59k | 32.5% | 15.5% | 16.9% | 70.2% | 12.2% | 5.2% |
Lawrence: 19 precincts
| Precinct | Population | Voting-age pop. | % White non-Hisp. | % Hispanic | % Black | % Asian | Median income* | % Bachelor's+ | % 18-29 (of adults) | % 65+ | % Homeowners | % Below poverty | % Spanish at home (adults) |
|---|---|---|---|---|---|---|---|---|---|---|---|---|---|
| Aurora North Voting District | 1,802 | 1,361 | 89.8% | 6.8% | 0.2% | 0.0% | $88k | 14.2% | 11.5% | 15.4% | 85.5% | 11.9% | 3.3% |
| Aurora Southeast Voting District | 4,034 | 2,988 | 88.7% | 8.6% | 0.4% | 0.0% | $55k | 16.4% | 16.7% | 16.0% | 61.8% | 17.3% | 4.7% |
| Aurora Southwest Voting District | 3,335 | 2,708 | 87.1% | 9.1% | 0.0% | 0.5% | $56k | 7.8% | 17.0% | 22.7% | 67.6% | 21.1% | 1.6% |
| Buck Prairie Voting District | 4,345 | 3,248 | 89.4% | 7.3% | 0.0% | 0.0% | $57k | 15.9% | 23.9% | 17.1% | 69.8% | 19.0% | 4.9% |
| Forest Park Voting District | 3,759 | 2,646 | 61.5% | 31.4% | 0.2% | 0.4% | $45k | 13.3% | 21.2% | 20.4% | 59.4% | 14.8% | 18.9% |
| Freistatt Voting District | 627 | 461 | 92.2% | 5.8% | 0.0% | 0.0% | $76k | 18.2% | 14.7% | 24.5% | 84.2% | 5.9% | 5.9% |
| Green Voting District | 284 | 228 | 99.3% | 0.0% | 0.0% | 0.0% | $88k | 20.0% | 11.3% | 21.4% | 87.8% | 10.5% | 0.0% |
| Hoberg Voting District | 695 | 513 | 94.3% | 4.7% | 0.1% | 0.0% | $76k | 19.0% | 15.7% | 24.6% | 85.1% | 7.7% | 4.6% |
| Lincoln Voting District | 1,914 | 1,474 | 94.2% | 0.7% | 0.6% | 0.0% | $55k | 15.7% | 19.0% | 15.9% | 77.6% | 13.4% | 0.2% |
| Mt. Pleasant Voting District | 1,252 | 850 | 89.5% | 9.1% | 0.0% | 0.0% | $73k | 19.4% | 19.1% | 8.9% | 73.7% | 17.6% | 3.6% |
| Mt. Vernon North Voting District | 3,887 | 2,907 | 95.3% | 0.7% | 0.5% | 0.0% | $98k | 24.7% | 21.5% | 15.2% | 83.8% | 6.6% | 1.4% |
| Mt. Vernon Southeast Voting District | 2,270 | 1,771 | 92.2% | 1.7% | 0.2% | 0.0% | $57k | 21.5% | 18.5% | 20.7% | 63.5% | 12.3% | 1.1% |
| Mt. Vernon Southwest Voting District | 2,033 | 1,568 | 88.6% | 6.4% | 1.8% | 1.7% | $56k | 18.0% | 26.8% | 25.9% | 67.8% | 20.6% | 0.2% |
| Ozark Voting District | 1,088 | 854 | 96.7% | 0.9% | 0.0% | 0.0% | $81k | 21.7% | 15.3% | 26.3% | 89.9% | 7.8% | 0.3% |
| Pierce City Voting District | 2,546 | 1,659 | 69.0% | 7.2% | 0.2% | 4.3% | $56k | 14.4% | 12.0% | 10.4% | 73.9% | 23.5% | 4.3% |
| Red Oak Voting District | 287 | 229 | 99.1% | 0.0% | 0.0% | 0.0% | $89k | 19.9% | 11.4% | 21.0% | 88.1% | 10.4% | 0.0% |
| Spring River Voting District | 1,697 | 1,370 | 84.0% | 13.5% | 0.0% | 0.1% | $79k | 15.7% | 10.2% | 27.1% | 87.7% | 13.1% | 8.6% |
| Turnback Voting District | 1,468 | 1,105 | 83.7% | 10.4% | 0.0% | 0.5% | $95k | 27.2% | 24.0% | 14.1% | 98.0% | 3.6% | 2.9% |
| Vineyard Voting District | 1,204 | 802 | 94.5% | 0.1% | 0.0% | 0.0% | $113k | 15.5% | 14.1% | 11.0% | 96.6% | 6.5% | 0.5% |
Barry: 22 precincts
| Precinct | Population | Voting-age pop. | % White non-Hisp. | % Hispanic | % Black | % Asian | Median income* | % Bachelor's+ | % 18-29 (of adults) | % 65+ | % Homeowners | % Below poverty | % Spanish at home (adults) |
|---|---|---|---|---|---|---|---|---|---|---|---|---|---|
| Ash Voting District | 952 | 730 | 94.1% | 0.1% | 0.0% | 0.0% | $54k | 3.0% | 11.3% | 19.1% | 97.8% | 11.7% | 0.0% |
| Butterfield Voting District | 1,083 | 791 | 82.5% | 9.0% | 0.3% | 5.5% | $71k | 12.6% | 20.9% | 14.5% | 84.1% | 10.1% | 3.3% |
| Capps Creek Voting District | 883 | 607 | 83.6% | 3.9% | 0.0% | 8.3% | $74k | 13.8% | 23.7% | 16.4% | 86.5% | 5.7% | 0.9% |
| Cassville City Voting District | 1,139 | 870 | 92.7% | 1.8% | 0.0% | 0.0% | $62k | 11.0% | 16.3% | 26.3% | 67.6% | 32.7% | 0.2% |
| Cassville Rural Voting District | 3,848 | 3,074 | 94.1% | 1.7% | 0.0% | 0.0% | $79k | 13.8% | 19.2% | 25.4% | 77.3% | 20.8% | 0.3% |
| Crane Creek Voting District | 463 | 373 | 87.7% | 1.5% | 0.0% | 0.4% | $66k | 15.6% | 8.5% | 19.9% | 80.2% | 19.9% | 0.8% |
| Exeter Voting District | 2,515 | 1,910 | 82.6% | 2.8% | 0.2% | 6.4% | $47k | 8.4% | 11.7% | 17.7% | 78.2% | 18.9% | 1.2% |
| Golden Voting District | 1,204 | 1,144 | 87.5% | 0.2% | 0.0% | 0.1% | $52k | 30.3% | 7.4% | 37.7% | 78.8% | 15.9% | 0.0% |
| Jenkins Voting District | 969 | 792 | 81.3% | 4.7% | 0.0% | 0.0% | $65k | 14.0% | 7.7% | 14.2% | 83.3% | 26.3% | 3.4% |
| Kings Prairie Voting District | 1,142 | 876 | 77.7% | 21.0% | 0.0% | 0.7% | $71k | 20.5% | 19.2% | 17.0% | 90.1% | 2.3% | 17.4% |
| McDonald Voting District | 831 | 575 | 76.2% | 19.8% | 0.0% | 0.0% | $57k | 13.5% | 15.5% | 14.8% | 72.2% | 21.8% | 6.9% |
| McDowell Voting District | 607 | 445 | 81.4% | 14.3% | 0.0% | 0.3% | $61k | 15.7% | 14.2% | 19.8% | 76.4% | 15.2% | 6.0% |
| Mineral Voting District | 716 | 615 | 77.0% | 15.7% | 0.0% | 0.0% | $58k | 14.1% | 13.3% | 40.6% | 90.6% | 7.4% | 10.2% |
| Monett Voting District | 6,910 | 5,009 | 62.9% | 27.2% | 0.4% | 0.5% | $57k | 15.6% | 23.7% | 15.8% | 56.1% | 14.3% | 18.5% |
| Ozark Voting District | 619 | 497 | 90.7% | 2.5% | 0.0% | 0.6% | $66k | 17.1% | 10.2% | 28.1% | 79.7% | 10.7% | 1.4% |
| Pleasant Ridge Voting District | 530 | 422 | 89.5% | 5.2% | 0.0% | 0.7% | $67k | 17.7% | 11.6% | 27.9% | 80.8% | 8.1% | 3.6% |
| Purdy Voting District | 1,471 | 1,024 | 79.9% | 12.5% | 0.0% | 4.1% | $66k | 14.4% | 20.0% | 15.6% | 80.4% | 11.5% | 5.3% |
| Roaring River Voting District | 2,246 | 1,820 | 85.4% | 3.0% | 0.4% | 0.0% | $57k | 17.5% | 14.4% | 27.0% | 81.8% | 18.0% | 1.3% |
| Seligman Voting District | 1,678 | 1,206 | 84.3% | 5.5% | 0.2% | 0.0% | $63k | 9.3% | 16.1% | 13.0% | 77.9% | 17.8% | 2.6% |
| Shell Knob Voting District | 2,293 | 2,107 | 79.7% | 9.6% | 0.7% | 0.6% | $58k | 19.0% | 11.0% | 47.2% | 88.4% | 5.2% | 2.6% |
| Washburn Voting District | 1,133 | 876 | 76.3% | 7.8% | 0.1% | 3.4% | $77k | 12.2% | 13.5% | 20.0% | 88.2% | 12.8% | 2.3% |
| Wheaton Voting District | 1,800 | 1,268 | 78.5% | 2.6% | 0.2% | 12.8% | $58k | 8.0% | 13.4% | 16.9% | 82.5% | 16.5% | 0.8% |
Stone: 20 precincts
| Precinct | Population | Voting-age pop. | % White non-Hisp. | % Hispanic | % Black | % Asian | Median income* | % Bachelor's+ | % 18-29 (of adults) | % 65+ | % Homeowners | % Below poverty | % Spanish at home (adults) |
|---|---|---|---|---|---|---|---|---|---|---|---|---|---|
| Alpine Voting District | 727 | 649 | 97.3% | 0.7% | 0.0% | 0.0% | $57k | 28.4% | 10.4% | 39.9% | 82.5% | 21.8% | 0.1% |
| Cass Voting District | 751 | 567 | 89.9% | 1.9% | 0.7% | 0.0% | $75k | 22.4% | 7.5% | 25.9% | 87.7% | 11.4% | 0.4% |
| Flat Creek A Voting District | 1,636 | 1,411 | 92.4% | 2.8% | 0.5% | 0.0% | $58k | 21.3% | 13.0% | 28.5% | 82.4% | 14.0% | 0.3% |
| Flat Creek B Voting District | 825 | 754 | 97.5% | 0.5% | 0.0% | 0.0% | $101k | 18.0% | 18.3% | 33.3% | 97.7% | 7.4% | 0.0% |
| Grant Voting District | 1,194 | 811 | 96.9% | 0.6% | 0.6% | 0.1% | $75k | 17.7% | 17.4% | 12.6% | 79.6% | 10.6% | 0.3% |
| Hurley Voting District | 1,138 | 819 | 96.1% | 0.4% | 0.2% | 0.1% | $84k | 21.3% | 10.3% | 17.5% | 87.4% | 6.1% | 0.0% |
| Lincoln Voting District | 894 | 733 | 94.9% | 2.2% | 0.0% | 0.0% | $64k | 12.9% | 17.8% | 9.8% | 79.0% | 9.2% | 0.7% |
| McKinley Voting District | 580 | 403 | 81.6% | 6.9% | 0.8% | 0.0% | $59k | 24.5% | 12.7% | 27.3% | 82.5% | 22.0% | 2.4% |
| Pierce Voting District | 1,788 | 1,293 | 93.4% | 2.2% | 1.0% | 0.0% | $44k | 12.3% | 19.9% | 14.4% | 67.8% | 25.0% | 1.7% |
| Pine A Voting District | 2,232 | 2,016 | 95.1% | 0.6% | 0.1% | 1.2% | $59k | 34.8% | 4.5% | 51.6% | 86.9% | 7.3% | 0.2% |
| Pine B Voting District | 1,535 | 1,462 | 98.0% | 0.5% | 0.0% | 1.0% | $59k | 25.5% | 6.5% | 57.0% | 91.8% | 15.8% | 0.7% |
| Ponce de Leon Voting District | 1,009 | 690 | 80.8% | 5.4% | 1.0% | 0.0% | $59k | 23.3% | 12.9% | 28.7% | 82.5% | 22.4% | 1.5% |
| Ruth A Voting District | 4,349 | 3,419 | 87.8% | 7.4% | 0.3% | 0.1% | $60k | 26.2% | 11.4% | 27.6% | 78.0% | 15.0% | 2.7% |
| Ruth B Rural/Kimberling City Voting District | 3,556 | 3,094 | 94.7% | 2.1% | 0.0% | 0.3% | $68k | 23.6% | 12.6% | 37.9% | 82.1% | 10.6% | 1.6% |
| Ruth B Voting District | 1,301 | 1,143 | 95.2% | 1.0% | 0.0% | 0.1% | $52k | 26.1% | 11.1% | 40.9% | 75.8% | 19.5% | 0.6% |
| Ruth C Rural/Sunset Cove Voting District | 1,318 | 1,220 | 91.5% | 2.7% | 0.0% | 0.9% | $60k | 47.6% | 9.5% | 30.2% | 86.8% | 20.6% | 2.6% |
| Ruth C Voting District | 3,065 | 2,808 | 93.7% | 2.8% | 0.3% | 0.3% | $66k | 29.3% | 6.2% | 43.3% | 87.0% | 9.4% | 0.6% |
| Union Voting District | 479 | 369 | 93.6% | 0.6% | 0.5% | 0.0% | $81k | 22.0% | 6.4% | 23.8% | 89.0% | 7.4% | 0.1% |
| Washington Voting District | 2,451 | 1,979 | 87.7% | 5.1% | 0.4% | 0.0% | $57k | 18.6% | 15.1% | 25.8% | 78.6% | 16.2% | 1.2% |
| Williams Voting District | 1,197 | 1,034 | 95.6% | 1.6% | 0.4% | 0.3% | $70k | 15.3% | 17.6% | 25.1% | 94.8% | 15.1% | 0.6% |
McDonald: 18 precincts
| Precinct | Population | Voting-age pop. | % White non-Hisp. | % Hispanic | % Black | % Asian | Median income* | % Bachelor's+ | % 18-29 (of adults) | % 65+ | % Homeowners | % Below poverty | % Spanish at home (adults) |
|---|---|---|---|---|---|---|---|---|---|---|---|---|---|
| Anderson East Voting District | 1,350 | 1,049 | 71.3% | 9.9% | 0.0% | 1.2% | $53k | 12.6% | 16.3% | 19.2% | 57.7% | 19.1% | 8.0% |
| Anderson West Voting District | 2,140 | 1,639 | 67.3% | 10.9% | 0.0% | 0.4% | $53k | 11.9% | 13.8% | 15.4% | 63.1% | 13.4% | 8.8% |
| Buffalo Hart Voting District | 650 | 506 | 80.5% | 0.0% | 0.0% | 0.0% | $69k | 16.2% | 16.4% | 18.0% | 91.5% | 21.6% | 0.8% |
| Center Voting District | 1,445 | 1,105 | 90.3% | 0.4% | 0.3% | 3.8% | $45k | 12.8% | 15.3% | 22.4% | 79.4% | 12.8% | 1.3% |
| Elkhorn Voting District | 775 | 592 | 83.4% | 1.2% | 0.1% | 3.1% | $52k | 24.1% | 13.3% | 21.1% | 81.5% | 7.1% | 1.6% |
| Elkriver East Voting District | 913 | 683 | 45.3% | 36.0% | 7.3% | 0.0% | $47k | 4.3% | 21.1% | 14.5% | 51.8% | 11.2% | 23.1% |
| Elkriver West Voting District | 2,298 | 1,533 | 34.2% | 21.5% | 13.4% | 0.5% | $60k | 13.6% | 30.4% | 5.7% | 38.2% | 19.2% | 9.6% |
| Erie Goodman Voting District | 2,920 | 2,046 | 70.7% | 14.6% | 0.0% | 3.9% | $51k | 14.6% | 18.0% | 17.8% | 74.7% | 27.7% | 9.8% |
| Erie McNatt Voting District | 444 | 334 | 78.3% | 3.8% | 0.1% | 0.3% | $52k | 25.9% | 15.3% | 16.6% | 79.4% | 10.2% | 3.8% |
| McMillen Coy Voting District | 1,341 | 1,055 | 68.1% | 6.4% | 1.8% | 0.8% | $68k | 12.3% | 19.4% | 7.3% | 77.1% | 16.0% | 3.5% |
| McMillen Tiff Voting District | 631 | 506 | 75.1% | 1.3% | 0.3% | 0.8% | $71k | 12.6% | 18.1% | 8.2% | 84.3% | 16.4% | 0.6% |
| Mountain Voting District | 1,165 | 952 | 94.8% | 0.0% | 0.1% | 0.0% | $50k | 8.8% | 21.8% | 11.5% | 74.0% | 18.7% | 0.2% |
| Pineville Lanagan Voting District | 581 | 463 | 68.8% | 19.9% | 0.2% | 0.0% | $44k | 16.0% | 16.2% | 15.8% | 65.6% | 10.5% | 15.9% |
| Pineville North Voting District | 1,402 | 1,122 | 87.4% | 4.4% | 0.5% | 0.1% | $44k | 15.8% | 17.2% | 25.1% | 54.8% | 15.5% | 2.6% |
| Pineville South Voting District | 2,000 | 1,405 | 49.7% | 16.3% | 1.3% | 0.0% | $69k | 5.4% | 16.5% | 15.1% | 59.5% | 12.9% | 18.5% |
| Prairie Voting District | 1,539 | 1,132 | 43.8% | 44.7% | 0.8% | 0.0% | $58k | 4.8% | 20.4% | 9.6% | 59.3% | 19.9% | 30.8% |
| Richwood Voting District | 678 | 542 | 84.9% | 0.5% | 0.0% | 8.8% | $50k | 16.5% | 9.2% | 31.5% | 74.6% | 7.3% | 1.0% |
| Whiterock Voting District | 1,426 | 996 | 93.9% | 0.6% | 0.8% | 0.0% | $36k | 9.3% | 19.5% | 17.5% | 88.8% | 15.9% | 2.3% |
Webster: 6 precincts
| Precinct | Population | Voting-age pop. | % White non-Hisp. | % Hispanic | % Black | % Asian | Median income* | % Bachelor's+ | % 18-29 (of adults) | % 65+ | % Homeowners | % Below poverty | % Spanish at home (adults) |
|---|---|---|---|---|---|---|---|---|---|---|---|---|---|
| Benton Voting District | 6,071 | 4,248 | 90.3% | 5.4% | 0.0% | 0.0% | $68k | 27.3% | 10.2% | 11.4% | 63.5% | 13.9% | 2.6% |
| Diggins Voting District | 1,993 | 1,367 | 91.3% | 2.4% | 0.9% | 0.0% | $70k | 10.5% | 17.1% | 13.4% | 91.6% | 14.9% | 0.9% |
| Finley Voting District | 2,690 | 1,815 | 97.5% | 0.9% | 0.0% | 0.0% | $53k | 13.6% | 28.7% | 13.5% | 81.4% | 37.5% | 0.8% |
| Fordland Voting District | 3,640 | 2,827 | 90.2% | 2.1% | 1.5% | 0.0% | $66k | 11.4% | 13.9% | 14.3% | 84.6% | 11.4% | 0.7% |
| Hazelwood Voting District | 3,781 | 2,141 | 93.0% | 1.7% | 0.7% | 0.1% | $63k | 8.6% | 18.3% | 13.3% | 77.3% | 21.2% | 0.1% |
| Northview B Voting District | 1,051 | 863 | 94.5% | 3.0% | 0.0% | 0.0% | $89k | 22.5% | 25.2% | 21.6% | 96.1% | 3.8% | 0.1% |
*Median income is approximate (see note above). ACS 2020-2024 5-year.
Nonpartisan voter information. GOTV Polling does not endorse any candidate.