
Missouri's 8th Congressional District
U.S. House · Missouri · District 8 · General election: Tuesday, November 3, 2026
Candidates on the November 3 ballot
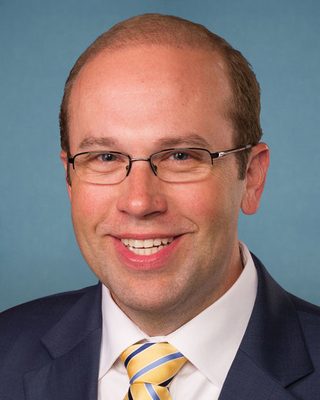 Jason T. SmithRepublicanPhoto: U.S. Congress
- Chris ReichardDemocratic
- Rebecca Sharpe LombardLibertarian
Source: Missouri Secretary of State, Certification of Candidates and Party Emblems, 2026 General Election, certified list (2026-08-25; retrieved 2026-10-30). Order of names does not reflect ballot order. Incumbent tags appear only where the official list marks incumbents. Photos come from the Candidate Alerts database where one is on file; otherwise initials are shown.
Federal campaign finance filings for this seat: FEC election page (FEC registration is not the same as ballot qualification).
Certified candidates
- Jason Smith RepublicanIncumbent @RepJasonSmith
- Christopher Reichard Democratic
- Rebecca Sharpe Lombard Libertarian
Certified candidate list from Candidate Alerts, as of 2026-09-24, based on Missouri Secretary of State; certified. Includes candidates the database marks as on the November 3 ballot. Incumbent tags here follow the database.
Past election results
Partial coverage: totals include only the counties loaded from certified sources (27 counties missing), so they are not the official district total.
| Candidate | Party | Votes | Share |
|---|---|---|---|
| Jason Smith | Republican | 51,114 | 64.8% |
| Randi McCallian | Democratic | 25,793 | 32.7% |
| Jake Dawson | Libertarian | 1,935 | 2.5% |
| Total | 78,842 |
Source: Missouri local election authorities, official precinct results; per-county provenance in election_contest_sources. Status: Official county precinct results; each loaded county reconciles exactly to that county's official final report (no statewide certified district figures loaded). Partial coverage: see per-county provenance.
Partial coverage: totals include only the counties loaded from certified sources (27 counties missing), so they are not the official district total.
| Candidate | Party | Votes | Share |
|---|---|---|---|
| Jason Smith | Republican | 34,506 | 64.0% |
| Randi McCallian | Democratic | 17,826 | 33.1% |
| Jim Higgins | Libertarian | 1,543 | 2.9% |
| Total | 53,875 |
Source: Missouri local election authorities, official precinct results; per-county provenance in election_contest_sources. Status: Official county precinct results; each loaded county reconciles exactly to that county's official final report (no statewide certified district figures loaded). Partial coverage: see per-county provenance.
Held under the district lines in effect at the time. Those boundaries differ from the 2026 district.
Partial coverage: totals include only the counties loaded from certified sources, so they are not the official district total.
| Candidate | Party | Votes | Share |
|---|---|---|---|
| Jason Smith | Republican | 20,945 | 67.4% |
| Kathy Ellis | Democratic | 9,364 | 30.1% |
| Tom Schmitz | Libertarian | 777 | 2.5% |
| Total | 31,086 |
Source: Missouri local election authorities, official precinct results; per-county provenance in election_contest_sources. Status: Official county precinct results; each loaded county reconciles exactly to that county's official final report (no statewide certified district figures loaded). Partial coverage: see per-county provenance.
Certified results from state or county election authorities, as compiled in the Candidate Alerts precinct results database (public API candidatealerts.com/api/district-results). Totals are sums of certified precinct and county-level rows.
Demographics
2020 Census demographics by district are not yet published in this data set.
0 of 523 precincts are above 50%, and 1 are above 25%. Source: Census American Community Survey 2020-2024 5-year block groups, allocated to current precinct shapes by area.
Poll status
Map
Share of adults (18+) who speak Spanish at home, by precinct. Census ACS 2020-2024 5-year estimates on the current precinct layer. Hover a precinct for its value.
District shown in red: U.S. Census Bureau cartographic boundary file for the 119th Congress (cb_2024_us_cd119_500k). These are the lines in effect for 2026 in this state per the Candidate Alerts district registry.
Precinct map: past elections and demographics
Choose a layer above. Hover a precinct for its values.
Precinct results
Precinct demographics
Demographics are Census American Community Survey (ACS) 2020-2024 5-year estimates for block groups, assigned to precincts by area share. They describe the resident population, not registered or likely voters, and include non-citizens. ACS margins of error are not shown; small precincts carry large error. Area weighting assumes people are spread evenly within each block group, so large rural precincts are the least reliable. Median income is a household-weighted average of block-group medians, an approximation.
| Area | Population | Voting-age pop. | % White non-Hisp. | % Hispanic | % Black | % Asian | Median income* | % Bachelor's+ | % 18-29 (of adults) | % 65+ | % Homeowners | % Below poverty | % Spanish at home (adults) |
|---|---|---|---|---|---|---|---|---|---|---|---|---|---|
| District | 772,845 | 598,477 | 87.0% | 2.6% | 3.7% | 0.8% | $64k | 20.7% | 18.7% | 18.9% | 72.2% | 15.5% | 1.2% |
| Jefferson (in district) | 162,037 | 125,318 | 88.3% | 2.6% | 1.2% | 1.1% | $85k | 24.7% | 17.4% | 16.4% | 80.8% | 8.9% | 1.2% |
| Cape Girardeau (in district) | 82,435 | 64,928 | 83.6% | 2.9% | 7.3% | 1.7% | $70k | 33.1% | 25.7% | 17.8% | 66.8% | 14.0% | 1.3% |
| St. Francois (in district) | 66,565 | 52,658 | 89.9% | 1.9% | 2.7% | 0.4% | $62k | 17.3% | 19.5% | 17.3% | 68.1% | 16.0% | 0.7% |
| Phelps (in district) | 44,860 | 35,373 | 84.9% | 3.1% | 2.4% | 3.7% | $59k | 32.5% | 27.5% | 17.1% | 61.9% | 16.6% | 0.6% |
| Butler (in district) | 41,926 | 32,161 | 85.9% | 2.5% | 4.7% | 0.4% | $51k | 15.8% | 18.1% | 19.5% | 64.7% | 20.5% | 1.1% |
| Howell (in district) | 40,362 | 30,625 | 91.5% | 2.6% | 0.5% | 0.4% | $53k | 17.8% | 17.4% | 19.9% | 70.3% | 20.3% | 1.6% |
| Scott (in district) | 37,725 | 28,688 | 80.9% | 2.6% | 9.0% | 0.1% | $66k | 22.1% | 18.2% | 18.8% | 71.2% | 12.8% | 1.6% |
| Stoddard (in district) | 28,362 | 22,106 | 92.7% | 2.2% | 1.1% | 0.1% | $61k | 16.7% | 17.1% | 20.7% | 71.7% | 15.2% | 0.8% |
| Dunklin (in district) | 27,402 | 20,277 | 73.5% | 7.6% | 6.9% | 0.3% | $50k | 13.2% | 18.2% | 18.7% | 62.4% | 22.0% | 5.8% |
| Texas (in district) | 25,222 | 19,640 | 89.0% | 2.5% | 3.5% | 0.2% | $49k | 16.5% | 16.0% | 21.5% | 77.2% | 19.8% | 1.2% |
| Perry (in district) | 19,120 | 14,815 | 93.3% | 2.5% | 0.7% | 0.9% | $63k | 20.8% | 17.3% | 19.6% | 76.3% | 13.8% | 1.7% |
| Wright (in district) | 18,939 | 14,047 | 91.7% | 2.6% | 0.5% | 0.3% | $49k | 15.9% | 17.0% | 19.7% | 77.1% | 18.8% | 0.7% |
| Ste. Genevieve (in district) | 18,464 | 14,516 | 93.9% | 1.5% | 1.2% | 0.0% | $74k | 16.8% | 16.4% | 21.5% | 83.0% | 8.1% | 0.6% |
| New Madrid (in district) | 15,851 | 12,094 | 74.0% | 2.0% | 13.2% | 0.3% | $56k | 14.5% | 16.5% | 19.9% | 64.3% | 17.6% | 1.7% |
| Pemiscot (in district) | 14,847 | 10,982 | 65.4% | 3.2% | 24.0% | 0.2% | $47k | 12.8% | 18.9% | 18.3% | 55.9% | 29.4% | 1.6% |
| Dent (in district) | 14,557 | 11,272 | 91.1% | 2.2% | 0.4% | 0.9% | $58k | 16.5% | 15.1% | 22.2% | 76.0% | 12.2% | 0.4% |
| Madison (in district) | 12,645 | 9,670 | 92.2% | 2.8% | 0.3% | 0.3% | $60k | 16.3% | 16.4% | 19.4% | 73.6% | 13.4% | 0.9% |
| Douglas (in district) | 11,944 | 9,181 | 92.4% | 2.3% | 0.9% | 0.1% | $48k | 14.9% | 13.5% | 24.9% | 80.6% | 17.5% | 0.4% |
| Mississippi (in district) | 11,928 | 9,231 | 70.7% | 0.8% | 18.9% | 0.6% | $52k | 14.8% | 18.8% | 18.9% | 63.0% | 19.0% | 0.8% |
| Wayne (in district) | 10,869 | 8,736 | 92.4% | 1.5% | 0.4% | 0.3% | $50k | 12.7% | 13.3% | 25.1% | 75.1% | 25.7% | 0.3% |
| Ripley (in district) | 10,688 | 8,109 | 92.4% | 1.5% | 0.3% | 0.3% | $42k | 12.6% | 15.7% | 19.9% | 79.1% | 24.8% | 1.0% |
| Bollinger (in district) | 10,568 | 8,270 | 93.7% | 1.7% | 0.8% | 0.0% | $64k | 13.9% | 14.9% | 21.1% | 82.3% | 13.6% | 0.3% |
| Iron (in district) | 9,478 | 7,485 | 91.7% | 2.2% | 0.5% | 1.1% | $54k | 19.0% | 15.2% | 22.2% | 75.1% | 19.2% | 0.7% |
| Ozark (in district) | 8,866 | 7,180 | 93.7% | 2.1% | 0.3% | 0.0% | $47k | 15.3% | 11.5% | 29.3% | 82.1% | 21.5% | 1.1% |
| Oregon (in district) | 8,671 | 6,664 | 92.6% | 1.5% | 0.1% | 0.4% | $49k | 12.6% | 15.3% | 23.0% | 74.9% | 23.6% | 0.4% |
| Shannon (in district) | 7,180 | 5,552 | 92.2% | 0.7% | 0.2% | 0.4% | $56k | 12.8% | 13.6% | 22.5% | 79.9% | 18.0% | 0.3% |
| Reynolds (in district) | 6,034 | 4,888 | 91.0% | 1.7% | 1.5% | 0.2% | $43k | 15.0% | 15.0% | 23.7% | 79.8% | 17.3% | 0.1% |
| Carter (in district) | 5,300 | 4,013 | 92.6% | 2.3% | 0.4% | 0.0% | $48k | 10.1% | 16.9% | 20.6% | 60.7% | 20.8% | 2.1% |
Jefferson: 55 precincts
| Precinct | Population | Voting-age pop. | % White non-Hisp. | % Hispanic | % Black | % Asian | Median income* | % Bachelor's+ | % 18-29 (of adults) | % 65+ | % Homeowners | % Below poverty | % Spanish at home (adults) |
|---|---|---|---|---|---|---|---|---|---|---|---|---|---|
| Airport Voting District | 1,024 | 770 | 89.1% | 2.0% | 1.1% | 0.9% | $79k | 17.7% | 13.6% | 21.2% | 68.5% | 5.0% | 0.1% |
| American Legion Voting District | 23 | 15 | 93.2% | 2.3% | 1.3% | 1.1% | $74k | 11.7% | 15.0% | 12.3% | 45.9% | 4.5% | 0.0% |
| Antonia Voting District | 4,845 | 3,713 | 95.9% | 0.6% | 0.0% | 0.1% | $113k | 40.3% | 17.0% | 9.9% | 96.5% | 2.2% | 0.4% |
| Arnold W-1 Voting District | 5,626 | 4,358 | 90.9% | 0.8% | 0.2% | 0.2% | $80k | 25.2% | 19.3% | 18.0% | 82.7% | 8.0% | 0.3% |
| Arnold W-2 Voting District | 6,384 | 4,962 | 88.3% | 1.4% | 1.6% | 2.1% | $73k | 28.9% | 21.5% | 17.8% | 65.7% | 9.1% | 0.4% |
| Arnold W-3 Voting District | 4,758 | 3,774 | 86.1% | 3.5% | 0.0% | 0.1% | $85k | 24.8% | 16.1% | 20.2% | 90.5% | 9.2% | 1.5% |
| Arnold W-4 Voting District | 4,827 | 4,057 | 87.2% | 5.0% | 0.4% | 3.3% | $79k | 19.3% | 19.6% | 20.6% | 81.3% | 8.2% | 1.1% |
| Athena Voting District | 3,710 | 3,062 | 88.2% | 2.1% | 0.3% | 0.6% | $86k | 14.7% | 13.5% | 18.5% | 89.5% | 9.4% | 0.8% |
| Barnhart Voting District | 4,507 | 3,428 | 86.4% | 1.6% | 0.1% | 0.2% | $95k | 22.8% | 22.8% | 11.1% | 92.2% | 6.7% | 0.9% |
| Brennan Voting District | 4,566 | 3,695 | 92.8% | 1.2% | 0.1% | 1.1% | $87k | 23.2% | 16.4% | 19.7% | 89.5% | 6.6% | 1.7% |
| Crystal City W-1 Voting District | 1,381 | 1,189 | 79.9% | 1.8% | 4.3% | 0.0% | $48k | 14.0% | 15.0% | 24.1% | 63.0% | 18.4% | 2.1% |
| Crystal City W-2 Voting District | 852 | 668 | 73.9% | 5.5% | 0.0% | 0.9% | $70k | 20.2% | 12.5% | 18.4% | 86.8% | 8.7% | 2.5% |
| Crystal City W-3 Voting District | 696 | 613 | 85.7% | 3.3% | 0.8% | 2.2% | $72k | 19.3% | 19.1% | 25.0% | 86.1% | 7.4% | 3.8% |
| Crystal City W-4 Voting District | 1,393 | 1,027 | 82.9% | 0.1% | 0.0% | 3.0% | $77k | 18.4% | 17.4% | 15.8% | 84.1% | 9.2% | 0.0% |
| Festus Outside Voting District | 2,107 | 1,517 | 79.9% | 2.4% | 8.6% | 0.4% | $95k | 27.2% | 14.8% | 12.6% | 84.5% | 14.1% | 0.1% |
| Festus W-1 Voting District | 2,831 | 2,016 | 89.0% | 2.6% | 1.8% | 0.6% | $53k | 14.4% | 15.4% | 12.8% | 48.2% | 28.6% | 1.5% |
| Festus W-2 Voting District | 3,649 | 2,860 | 85.3% | 5.3% | 1.3% | 0.6% | $75k | 27.5% | 21.8% | 16.3% | 52.6% | 15.6% | 2.0% |
| Festus W-3 Voting District | 2,788 | 2,087 | 84.8% | 2.8% | 4.3% | 0.1% | $87k | 26.5% | 18.5% | 18.9% | 67.0% | 8.7% | 0.8% |
| Festus W-4 Voting District | 2,510 | 1,747 | 87.8% | 3.3% | 1.3% | 0.5% | $91k | 22.9% | 13.0% | 15.1% | 69.3% | 11.1% | 0.1% |
| Flamm City Voting District | 2,421 | 1,972 | 92.5% | 1.5% | 1.0% | 2.5% | $94k | 23.7% | 16.1% | 13.5% | 86.4% | 9.3% | 0.9% |
| Hematite Voting District | 2,454 | 1,812 | 94.8% | 1.3% | 0.0% | 0.7% | $85k | 37.2% | 23.1% | 13.0% | 92.4% | 3.1% | 1.1% |
| Herculaneum Voting District | 1,402 | 1,027 | 84.2% | 0.7% | 3.9% | 0.1% | $77k | 19.9% | 13.8% | 14.6% | 84.8% | 13.8% | 0.3% |
| Herculaneum W-2 Voting District | 1,031 | 809 | 91.4% | 0.7% | 3.0% | 0.0% | $74k | 15.4% | 17.4% | 23.2% | 60.0% | 10.4% | 1.1% |
| Herculaneum W-3 Voting District | 1,220 | 878 | 76.4% | 2.6% | 10.8% | 0.7% | $86k | 26.2% | 18.3% | 11.1% | 78.6% | 15.7% | 0.5% |
| Imperial 2 | 385 | 296 | 87.7% | 0.9% | 0.0% | 0.0% | $142k | 38.9% | 19.6% | 12.9% | 92.2% | 0.2% | 0.0% |
| Imperial Voting District | 5,699 | 4,517 | 83.3% | 6.3% | 1.3% | 0.0% | $88k | 23.0% | 25.9% | 12.5% | 72.3% | 8.7% | 5.0% |
| Jefferson Heights Voting District | 3,024 | 2,386 | 92.9% | 2.9% | 0.7% | 0.1% | $90k | 33.5% | 10.7% | 18.6% | 86.5% | 9.8% | 1.0% |
| Jefferson R7 Voting District | 4,572 | 3,509 | 90.2% | 0.6% | 1.6% | 2.1% | $107k | 30.5% | 16.5% | 20.2% | 97.6% | 1.8% | 0.0% |
| Kimmswick W-1 Voting District | 314 | 205 | 89.6% | 1.5% | 0.1% | 0.1% | $77k | 18.2% | 18.3% | 9.5% | 92.9% | 4.9% | 0.4% |
| Lonedell | 1,696 | 1,395 | 92.5% | 1.2% | 0.3% | 2.8% | $113k | 32.7% | 12.6% | 19.9% | 97.5% | 1.7% | 0.1% |
| Mapaville Voting District | 7,090 | 4,940 | 87.7% | 3.4% | 0.5% | 2.7% | $94k | 24.4% | 14.8% | 13.6% | 88.9% | 7.7% | 0.2% |
| Marble Springs Voting District | 4,894 | 3,826 | 88.1% | 2.2% | 1.9% | 0.4% | $89k | 21.5% | 24.2% | 12.7% | 85.5% | 7.9% | 1.0% |
| Mastodon | 3,195 | 2,423 | 95.2% | 3.4% | 0.1% | 0.2% | $83k | 35.9% | 8.1% | 15.4% | 95.6% | 3.5% | 2.7% |
| Maxville Voting District | 5,469 | 4,235 | 92.6% | 1.6% | 1.9% | 1.4% | $88k | 25.7% | 15.4% | 13.6% | 76.4% | 5.2% | 0.9% |
| Meramec Heights Voting District | 2,833 | 2,304 | 87.3% | 6.7% | 0.0% | 2.1% | $82k | 26.1% | 19.0% | 20.7% | 88.1% | 3.9% | 3.9% |
| Miller Voting District | 3,924 | 3,083 | 93.8% | 1.9% | 0.2% | 0.8% | $84k | 18.4% | 21.2% | 12.2% | 78.7% | 3.2% | 0.4% |
| Murphy Voting District | 6,691 | 5,287 | 82.5% | 7.2% | 0.3% | 0.2% | $77k | 24.0% | 18.6% | 18.5% | 81.3% | 12.5% | 4.3% |
| Oakvale Voting District | 1,816 | 1,329 | 91.4% | 3.0% | 0.0% | 0.3% | $96k | 25.9% | 11.7% | 15.3% | 93.5% | 5.1% | 1.1% |
| Olympian Village Voting District | 73 | 61 | 78.3% | 3.8% | 0.0% | 0.8% | $78k | 12.1% | 23.0% | 16.8% | 88.2% | 13.2% | 0.2% |
| Otto Voting District | 2,202 | 1,727 | 85.2% | 5.2% | 1.1% | 0.9% | $79k | 19.7% | 13.6% | 16.1% | 85.0% | 13.9% | 1.5% |
| Pevely W-1 Voting District | 586 | 468 | 95.3% | 0.0% | 0.1% | 0.0% | $114k | 30.0% | 23.8% | 16.6% | 89.7% | 4.8% | 0.2% |
| Pevely W-2 Voting District | 1,353 | 986 | 96.1% | 0.0% | 0.1% | 0.3% | $68k | 6.9% | 16.1% | 16.7% | 78.8% | 15.3% | 0.8% |
| Pevely W-3 Voting District | 981 | 701 | 89.8% | 0.0% | 0.0% | 1.7% | $43k | 10.6% | 22.0% | 15.9% | 63.6% | 35.8% | 0.0% |
| Pevely W-4 Voting District | 959 | 705 | 69.8% | 6.3% | 10.7% | 2.4% | $49k | 17.8% | 36.0% | 9.4% | 51.0% | 21.0% | 3.2% |
| Plattin Voting District | 1,946 | 1,599 | 81.6% | 1.9% | 1.2% | 1.2% | $85k | 22.9% | 10.7% | 21.1% | 89.5% | 6.5% | 0.2% |
| Riverview Voting District | 163 | 130 | 90.1% | 1.1% | 4.5% | 0.0% | $80k | 20.9% | 16.2% | 26.6% | 61.6% | 4.7% | 1.4% |
| Rock Creek 1 | 529 | 389 | 93.2% | 3.0% | 0.7% | 0.0% | $126k | 42.2% | 10.8% | 16.2% | 96.2% | 2.2% | 0.0% |
| Rock Creek Voting District | 7,001 | 5,256 | 91.2% | 2.4% | 0.2% | 1.7% | $83k | 22.2% | 14.7% | 13.1% | 77.5% | 12.1% | 0.3% |
| Romaine Creek Voting District | 4,341 | 3,338 | 91.1% | 0.2% | 0.6% | 1.7% | $75k | 18.6% | 10.8% | 22.2% | 70.9% | 10.0% | 0.4% |
| Saline Voting District | 2,980 | 2,246 | 78.7% | 1.1% | 6.2% | 7.7% | $73k | 40.5% | 19.8% | 17.3% | 66.6% | 8.1% | 0.0% |
| Springdale Voting District | 5,921 | 4,829 | 86.2% | 2.7% | 3.7% | 0.9% | $96k | 40.9% | 16.6% | 14.0% | 70.0% | 9.1% | 0.9% |
| Sunrise Voting District | 3,803 | 3,114 | 92.3% | 0.0% | 0.2% | 0.8% | $77k | 17.3% | 11.0% | 30.7% | 94.9% | 6.6% | 0.0% |
| Valle Voting District | 1,948 | 1,590 | 85.5% | 2.7% | 0.3% | 0.0% | $91k | 10.9% | 21.4% | 17.0% | 76.4% | 12.3% | 1.9% |
| Victoria Voting District | 3,212 | 2,523 | 90.4% | 1.9% | 0.0% | 0.5% | $80k | 17.2% | 14.5% | 16.9% | 81.7% | 4.4% | 1.0% |
| Windsor Voting District | 5,436 | 3,868 | 88.1% | 4.5% | 0.5% | 0.2% | $87k | 22.0% | 21.0% | 13.1% | 87.6% | 10.4% | 1.6% |
Cape Girardeau: 38 precincts
| Precinct | Population | Voting-age pop. | % White non-Hisp. | % Hispanic | % Black | % Asian | Median income* | % Bachelor's+ | % 18-29 (of adults) | % 65+ | % Homeowners | % Below poverty | % Spanish at home (adults) |
|---|---|---|---|---|---|---|---|---|---|---|---|---|---|
| Brown Owl Voting District | 1,112 | 869 | 97.2% | 0.4% | 0.5% | 0.0% | $102k | 35.2% | 15.6% | 23.5% | 80.8% | 6.4% | 0.1% |
| Burfordville Voting District | 1,240 | 965 | 95.9% | 0.0% | 0.2% | 1.5% | $68k | 25.2% | 23.0% | 15.5% | 91.2% | 6.3% | 0.0% |
| Byrd No. 1 Voting District | 2,669 | 1,948 | 85.2% | 5.7% | 4.0% | 1.6% | $76k | 34.8% | 19.6% | 19.0% | 63.9% | 8.1% | 0.0% |
| Byrd No. 2 Voting District | 1,904 | 1,533 | 76.3% | 8.1% | 4.9% | 0.1% | $62k | 35.4% | 23.8% | 15.3% | 62.3% | 7.8% | 6.3% |
| Byrd No. 3 Voting District | 1,366 | 1,068 | 87.6% | 3.4% | 1.5% | 1.8% | $81k | 34.1% | 24.1% | 19.0% | 71.0% | 7.0% | 1.2% |
| Byrd No. 4 Voting District | 3,279 | 2,345 | 91.1% | 2.9% | 2.3% | 1.5% | $93k | 40.1% | 18.4% | 12.6% | 83.3% | 6.3% | 0.2% |
| Byrd No. 5 Voting District | 2,851 | 2,156 | 91.6% | 3.0% | 2.3% | 0.0% | $80k | 34.3% | 15.3% | 19.4% | 87.9% | 8.9% | 1.3% |
| Byrd No. 6 Voting District | 7,330 | 5,468 | 91.5% | 1.8% | 1.9% | 0.9% | $82k | 32.8% | 18.8% | 16.6% | 75.1% | 8.8% | 0.6% |
| Campster/Pecan Grove Voting District | 1,935 | 1,651 | 86.7% | 0.1% | 7.1% | 2.4% | $71k | 26.3% | 5.2% | 27.5% | 66.7% | 14.9% | 0.0% |
| Cape Girardeau Precinct 1 | 2,040 | 1,625 | 72.2% | 7.7% | 8.2% | 3.6% | $34k | 18.8% | 28.9% | 13.1% | 42.7% | 33.1% | 4.0% |
| Cape Girardeau Precinct 12 | 422 | 320 | 57.3% | 0.0% | 32.6% | 0.0% | $20k | 15.2% | 14.4% | 26.6% | 24.3% | 49.4% | 0.0% |
| Cape Girardeau Precinct 13 | 1,580 | 1,257 | 69.1% | 5.8% | 21.0% | 1.2% | $72k | 34.5% | 13.3% | 23.6% | 76.8% | 7.1% | 1.2% |
| Cape Girardeau Precinct 14 | 1,482 | 1,243 | 85.9% | 7.7% | 3.1% | 0.0% | $65k | 40.6% | 38.7% | 14.9% | 63.1% | 15.4% | 3.6% |
| Cape Girardeau Precinct 15 | 2,209 | 1,764 | 69.7% | 4.1% | 22.8% | 0.8% | $69k | 33.3% | 14.7% | 24.6% | 74.6% | 6.7% | 1.3% |
| Cape Girardeau Precinct 16 | 2,372 | 2,004 | 86.3% | 0.5% | 9.0% | 3.0% | $83k | 42.1% | 19.8% | 31.1% | 74.3% | 11.9% | 0.4% |
| Cape Girardeau Precinct 17 | 5,047 | 3,986 | 78.5% | 1.7% | 14.1% | 4.0% | $78k | 49.6% | 18.8% | 23.7% | 62.6% | 7.8% | 1.0% |
| Cape Girardeau Precinct 18 | 2,504 | 2,130 | 74.1% | 1.1% | 16.8% | 0.6% | $42k | 22.0% | 17.5% | 39.9% | 45.5% | 29.8% | 0.0% |
| Cape Girardeau Precinct 2 | 3,972 | 3,341 | 81.0% | 4.3% | 5.3% | 2.1% | $71k | 39.5% | 47.2% | 13.0% | 74.9% | 16.9% | 1.5% |
| Cape Girardeau Precinct 4 | 4,880 | 4,371 | 68.3% | 3.3% | 13.6% | 6.3% | $52k | 27.5% | 77.3% | 5.4% | 26.6% | 34.1% | 1.0% |
| Cape Girardeau Precinct 6 | 3,455 | 2,978 | 79.0% | 6.5% | 7.4% | 0.4% | $58k | 37.3% | 41.9% | 13.7% | 46.6% | 30.0% | 5.6% |
| Cape Girardeau Precinct 7 | 2,637 | 2,154 | 74.4% | 3.0% | 19.3% | 0.0% | $47k | 37.9% | 14.5% | 25.5% | 39.3% | 17.1% | 1.7% |
| Cape Girardeau Precinct 8 | 2,914 | 2,402 | 69.6% | 4.5% | 15.0% | 4.3% | $31k | 19.4% | 42.4% | 10.1% | 21.6% | 32.3% | 1.3% |
| Cape Girardeau Precinct 9 | 1,367 | 1,003 | 56.2% | 5.8% | 27.6% | 0.9% | $47k | 19.3% | 35.1% | 6.2% | 43.5% | 50.8% | 0.0% |
| Delta City No. 1 Voting District | 7 | 6 | 99.3% | 0.0% | 0.0% | 0.0% | $45k | 7.1% | 29.5% | 15.8% | 79.0% | 10.3% | 0.0% |
| Delta City No. 2 Voting District | 4 | 3 | 99.0% | 0.0% | 0.0% | 0.0% | $45k | 6.4% | 30.0% | 15.7% | 78.3% | 10.4% | 0.0% |
| Delta Out County Voting District | 1,539 | 1,157 | 98.2% | 0.0% | 0.6% | 0.4% | $60k | 18.7% | 17.7% | 15.2% | 84.3% | 8.2% | 0.0% |
| Friedheim Voting District | 1,109 | 787 | 90.3% | 0.0% | 0.0% | 0.0% | $97k | 28.8% | 9.5% | 18.5% | 95.7% | 2.5% | 0.0% |
| Fruitland Voting District | 2,611 | 1,854 | 95.9% | 0.6% | 0.1% | 0.5% | $84k | 33.3% | 16.8% | 14.1% | 82.8% | 7.3% | 0.2% |
| Gordonville Voting District | 2,410 | 1,656 | 88.8% | 2.4% | 6.0% | 0.8% | $89k | 42.7% | 15.5% | 12.7% | 85.2% | 6.1% | 0.4% |
| Hanover Voting District | 4,285 | 3,277 | 88.4% | 2.4% | 4.7% | 2.4% | $74k | 40.4% | 20.2% | 19.9% | 72.5% | 10.8% | 1.2% |
| Millersville Voting District | 1,771 | 1,457 | 95.1% | 3.3% | 0.2% | 0.0% | $62k | 15.4% | 12.2% | 19.9% | 93.2% | 4.4% | 3.1% |
| Neelys Landing/Oriole Voting District | 1,425 | 1,051 | 94.3% | 0.6% | 0.1% | 0.3% | $86k | 29.2% | 12.1% | 17.4% | 83.8% | 13.8% | 0.8% |
| Nell Holcomb Voting District | 1,230 | 1,025 | 90.4% | 2.9% | 0.9% | 1.4% | $80k | 20.2% | 8.6% | 23.6% | 78.1% | 17.1% | 0.8% |
| New Wells Voting District | 1,551 | 1,237 | 94.6% | 0.0% | 0.0% | 0.0% | $80k | 26.6% | 23.8% | 16.1% | 83.6% | 5.6% | 0.3% |
| Oak Ridge Voting District | 1,662 | 1,222 | 92.7% | 0.4% | 0.5% | 0.0% | $87k | 29.8% | 10.9% | 15.4% | 93.0% | 3.0% | 0.5% |
| Pocahontas Voting District | 985 | 748 | 93.6% | 0.0% | 0.0% | 0.0% | $72k | 28.9% | 23.3% | 14.6% | 83.7% | 7.5% | 0.3% |
| Scott City Voting District | 36 | 32 | 81.7% | 0.0% | 15.2% | 0.0% | $20k | 13.8% | 2.1% | 44.1% | 28.0% | 17.6% | 0.0% |
| Whitewater Voting District | 1,245 | 838 | 94.2% | 1.4% | 3.3% | 0.3% | $74k | 34.8% | 12.9% | 11.8% | 88.2% | 5.1% | 0.2% |
St. Francois: 22 precincts
| Precinct | Population | Voting-age pop. | % White non-Hisp. | % Hispanic | % Black | % Asian | Median income* | % Bachelor's+ | % 18-29 (of adults) | % 65+ | % Homeowners | % Below poverty | % Spanish at home (adults) |
|---|---|---|---|---|---|---|---|---|---|---|---|---|---|
| Bismarck Voting District | 2,279 | 1,613 | 86.6% | 2.6% | 0.0% | 0.0% | $41k | 17.7% | 15.4% | 18.4% | 72.5% | 24.1% | 1.2% |
| Bonne Terre Voting District | 8,504 | 7,104 | 82.4% | 1.9% | 6.9% | 1.2% | $71k | 16.6% | 21.4% | 13.8% | 70.0% | 20.5% | 1.8% |
| Busiek Voting District | 3,593 | 2,845 | 88.9% | 2.3% | 2.0% | 0.0% | $81k | 26.3% | 20.4% | 14.1% | 62.8% | 9.2% | 2.1% |
| Desloge No. 1 Voting District | 1,249 | 971 | 94.5% | 2.7% | 0.4% | 0.0% | $57k | 19.0% | 13.9% | 22.6% | 75.7% | 13.2% | 0.0% |
| Desloge No. 2 Voting District | 2,124 | 1,599 | 98.4% | 0.7% | 0.0% | 0.1% | $56k | 10.7% | 24.0% | 14.3% | 70.0% | 33.4% | 0.0% |
| Desloge No. 3 Voting District | 1,846 | 1,436 | 93.3% | 4.8% | 0.7% | 0.0% | $63k | 16.7% | 13.3% | 21.6% | 74.1% | 15.1% | 0.0% |
| Doe Run Voting District | 3,351 | 2,550 | 92.0% | 4.3% | 1.2% | 0.0% | $80k | 22.7% | 14.0% | 20.7% | 81.3% | 6.3% | 0.0% |
| Farmington No. 1 Voting District | 6,331 | 4,698 | 96.1% | 1.2% | 0.2% | 0.2% | $66k | 19.7% | 21.3% | 21.7% | 62.8% | 15.0% | 0.8% |
| Farmington No. 2 Voting District | 4,950 | 3,977 | 94.1% | 1.2% | 0.6% | 0.3% | $50k | 24.3% | 20.0% | 24.2% | 46.4% | 13.6% | 0.7% |
| Farmington No. 3 Voting District | 5,485 | 4,741 | 77.5% | 2.3% | 15.3% | 1.1% | $59k | 9.4% | 21.5% | 12.4% | 51.1% | 21.1% | 1.6% |
| Farmington No. 4 Voting District | 2,029 | 1,678 | 95.7% | 1.1% | 0.4% | 0.3% | $71k | 21.5% | 10.6% | 15.1% | 76.0% | 20.8% | 0.5% |
| Iron Mountain Voting District | 1,161 | 918 | 93.0% | 1.1% | 0.1% | 0.0% | $37k | 6.8% | 16.7% | 19.1% | 82.9% | 20.8% | 0.3% |
| Knob Lick Voting District | 915 | 828 | 97.7% | 0.0% | 0.0% | 0.0% | $101k | 24.5% | 24.6% | 16.3% | 83.9% | 3.4% | 0.0% |
| Leadington Voting District | 676 | 540 | 95.4% | 2.1% | 0.4% | 1.3% | $57k | 16.7% | 24.6% | 22.9% | 75.6% | 12.6% | 2.0% |
| Leadwood Voting District | 2,085 | 1,534 | 96.6% | 0.2% | 0.0% | 0.3% | $46k | 10.5% | 19.0% | 16.8% | 80.6% | 26.2% | 0.0% |
| Libertyville Voting District | 1,444 | 1,120 | 95.3% | 0.0% | 0.1% | 0.0% | $64k | 18.6% | 25.2% | 17.7% | 74.9% | 25.4% | 0.0% |
| Park Hills No. 1 Voting District | 2,732 | 2,196 | 91.2% | 0.6% | 1.0% | 0.1% | $48k | 15.8% | 29.0% | 16.4% | 39.5% | 11.9% | 0.0% |
| Park Hills No. 3 Voting District | 4,910 | 3,721 | 87.4% | 3.9% | 0.5% | 0.1% | $51k | 15.0% | 26.4% | 12.9% | 60.3% | 15.0% | 0.0% |
| Park Hills No. 4 Voting District | 2,800 | 2,135 | 89.4% | 1.9% | 0.6% | 0.0% | $58k | 12.1% | 19.0% | 13.8% | 75.5% | 16.2% | 0.0% |
| Patterson Voting District | 3,660 | 3,032 | 90.5% | 1.0% | 3.8% | 0.0% | $71k | 16.4% | 8.5% | 20.8% | 89.4% | 7.0% | 0.2% |
| Terre Du Lac Voting District | 2,368 | 1,734 | 95.4% | 0.8% | 0.0% | 1.0% | $77k | 24.1% | 13.4% | 17.5% | 97.8% | 5.9% | 0.3% |
| Timberline Voting District | 2,072 | 1,688 | 85.2% | 1.5% | 0.5% | 0.0% | $49k | 12.4% | 16.1% | 18.3% | 72.7% | 21.7% | 0.5% |
Phelps: 36 precincts
| Precinct | Population | Voting-age pop. | % White non-Hisp. | % Hispanic | % Black | % Asian | Median income* | % Bachelor's+ | % 18-29 (of adults) | % 65+ | % Homeowners | % Below poverty | % Spanish at home (adults) |
|---|---|---|---|---|---|---|---|---|---|---|---|---|---|
| Cold Springs East Voting District | 1,135 | 814 | 78.0% | 0.0% | 0.0% | 3.3% | $91k | 43.9% | 8.4% | 17.2% | 96.1% | 1.3% | 0.9% |
| Cold Springs West Voting District | 1,042 | 912 | 92.3% | 0.1% | 0.0% | 1.8% | $82k | 34.8% | 16.1% | 20.0% | 95.1% | 4.8% | 1.5% |
| Dawson Voting District | 1,344 | 970 | 94.3% | 1.1% | 0.1% | 0.0% | $101k | 31.0% | 14.3% | 14.9% | 97.0% | 8.9% | 0.2% |
| Dillon Central Voting District | 3,503 | 2,699 | 87.0% | 0.6% | 0.1% | 6.6% | $74k | 47.9% | 20.5% | 18.2% | 57.4% | 13.4% | 0.4% |
| Dillon North Voting District | 2,368 | 1,845 | 93.9% | 2.9% | 0.8% | 0.0% | $68k | 23.7% | 9.7% | 20.6% | 84.4% | 7.7% | 0.2% |
| Dillon South Voting District | 2,228 | 1,392 | 86.5% | 0.8% | 0.2% | 2.5% | $85k | 45.5% | 9.1% | 14.6% | 74.8% | 3.6% | 0.0% |
| Doolittle Outside Voting District | 1,495 | 1,167 | 88.9% | 3.3% | 0.3% | 1.0% | $58k | 20.0% | 15.7% | 21.0% | 82.7% | 17.4% | 0.7% |
| Doolittle Ward No. 1 | 46 | 35 | 89.6% | 2.5% | 0.5% | 1.6% | $45k | 15.6% | 12.6% | 24.9% | 78.5% | 20.6% | 0.2% |
| Doolittle Ward No. 2 | 31 | 23 | 89.7% | 2.1% | 0.1% | 0.9% | $59k | 21.4% | 14.5% | 22.1% | 79.4% | 18.5% | 0.1% |
| Doolittle Ward No. 3 | 101 | 75 | 88.7% | 3.0% | 0.1% | 1.8% | $39k | 10.5% | 11.9% | 26.1% | 79.1% | 23.2% | 0.3% |
| Edgar Springs North Voting District | 2 | 1 | 77.6% | 0.0% | 1.6% | 0.0% | $64k | 31.2% | 24.3% | 27.1% | 92.0% | 15.1% | 0.0% |
| Edgar Springs South Voting District | 3 | 2 | 77.6% | 0.0% | 1.5% | 0.0% | $64k | 31.5% | 24.1% | 27.2% | 91.4% | 15.3% | 0.0% |
| Jerome Voting District | 443 | 365 | 87.1% | 12.9% | 0.0% | 0.0% | $80k | 22.6% | 28.6% | 13.8% | 92.1% | 18.2% | 4.2% |
| Liberty East Voting District | 310 | 266 | 77.7% | 3.2% | 0.0% | 0.0% | $55k | 27.1% | 9.4% | 27.8% | 89.8% | 20.5% | 0.0% |
| Liberty West Voting District | 377 | 315 | 81.7% | 9.5% | 0.0% | 0.0% | $64k | 24.7% | 19.7% | 21.5% | 90.8% | 21.0% | 2.5% |
| Meramec Voting District | 601 | 494 | 91.8% | 0.1% | 0.0% | 0.8% | $91k | 30.1% | 12.3% | 21.5% | 87.9% | 13.6% | 0.1% |
| Miller East Voting District | 2,819 | 2,421 | 84.3% | 3.2% | 4.1% | 5.9% | $42k | 30.1% | 53.8% | 7.8% | 41.1% | 27.5% | 0.8% |
| Miller West Voting District | 1,559 | 1,257 | 91.9% | 1.2% | 1.1% | 1.6% | $70k | 28.6% | 20.4% | 16.1% | 81.6% | 12.9% | 0.5% |
| Newburg Ward No. 1 | 24 | 18 | 88.7% | 3.0% | 0.1% | 1.8% | $39k | 10.5% | 11.9% | 26.1% | 79.1% | 23.2% | 0.3% |
| Newburg Ward No. 2 | 32 | 25 | 88.6% | 2.7% | 0.1% | 1.6% | $44k | 12.1% | 12.3% | 24.9% | 80.3% | 21.7% | 0.2% |
| Rolla Outside North Voting District | 1,022 | 880 | 86.3% | 4.8% | 1.9% | 4.5% | $46k | 33.4% | 47.2% | 15.9% | 47.7% | 24.9% | 0.0% |
| Rolla Outside South Voting District | 2,066 | 1,476 | 85.4% | 0.5% | 0.0% | 8.3% | $73k | 32.8% | 15.8% | 14.6% | 78.7% | 6.9% | 0.0% |
| Rolla Ward No. 1 | 1,971 | 1,569 | 85.5% | 3.8% | 4.0% | 3.2% | $44k | 26.9% | 54.6% | 9.9% | 40.8% | 24.0% | 0.8% |
| Rolla Ward No. 2 | 3,533 | 2,967 | 72.4% | 2.7% | 12.5% | 9.6% | $35k | 33.5% | 30.4% | 17.1% | 27.7% | 26.5% | 0.8% |
| Rolla Ward No. 3 | 2,214 | 1,683 | 86.8% | 5.8% | 0.8% | 0.9% | $51k | 33.5% | 22.3% | 14.7% | 61.9% | 11.4% | 1.1% |
| Rolla Ward No. 4 | 2,429 | 2,006 | 86.8% | 2.1% | 1.0% | 5.2% | $81k | 44.6% | 13.1% | 30.1% | 75.1% | 6.3% | 1.1% |
| Rolla Ward No. 5 | 3,096 | 2,548 | 80.7% | 7.6% | 3.9% | 3.1% | $37k | 17.7% | 52.0% | 10.5% | 33.7% | 38.5% | 0.4% |
| Rolla Ward No. 6 | 2,250 | 2,026 | 70.8% | 8.1% | 6.7% | 9.7% | $32k | 41.1% | 64.4% | 8.8% | 14.8% | 40.8% | 0.9% |
| Spring Creek East Voting District | 1,241 | 958 | 76.6% | 1.6% | 0.9% | 0.0% | $58k | 29.8% | 17.7% | 28.9% | 90.9% | 18.3% | 0.0% |
| Spring Creek West Voting District | 432 | 318 | 77.3% | 0.6% | 1.4% | 0.1% | $63k | 31.0% | 23.7% | 27.2% | 91.4% | 15.6% | 0.1% |
| St. James East Voting District | 416 | 323 | 94.6% | 1.2% | 0.0% | 0.0% | $74k | 31.5% | 2.1% | 22.9% | 79.5% | 5.0% | 2.1% |
| St. James Ward No. 1 | 888 | 652 | 93.1% | 3.0% | 0.1% | 0.0% | $59k | 18.6% | 12.0% | 21.3% | 60.0% | 11.7% | 0.5% |
| St. James Ward No. 2 | 656 | 468 | 87.1% | 4.0% | 0.1% | 0.0% | $63k | 31.9% | 9.7% | 24.9% | 54.7% | 23.3% | 0.3% |
| St. James Ward No. 3 | 495 | 348 | 93.2% | 3.0% | 0.1% | 0.0% | $59k | 20.8% | 13.8% | 23.1% | 52.2% | 11.2% | 0.2% |
| St. James Ward No. 4 | 860 | 636 | 85.6% | 4.5% | 1.3% | 0.0% | $49k | 28.6% | 27.4% | 14.0% | 62.0% | 13.7% | 0.1% |
| St. James West Voting District | 1,829 | 1,420 | 91.2% | 1.1% | 0.4% | 0.0% | $57k | 28.3% | 16.1% | 22.9% | 71.3% | 14.2% | 0.4% |
Butler: 25 precincts
| Precinct | Population | Voting-age pop. | % White non-Hisp. | % Hispanic | % Black | % Asian | Median income* | % Bachelor's+ | % 18-29 (of adults) | % 65+ | % Homeowners | % Below poverty | % Spanish at home (adults) |
|---|---|---|---|---|---|---|---|---|---|---|---|---|---|
| Broseley Voting District | 1,108 | 894 | 92.1% | 0.0% | 2.1% | 1.2% | $51k | 12.8% | 21.1% | 18.9% | 68.8% | 24.0% | 1.1% |
| Cane Creek Voting District | 997 | 760 | 83.8% | 1.5% | 0.4% | 0.9% | $67k | 27.3% | 19.9% | 14.5% | 96.7% | 6.9% | 0.5% |
| Coon Island Voting District | 194 | 131 | 95.9% | 0.1% | 4.0% | 0.0% | $49k | 12.4% | 6.8% | 10.7% | 97.0% | 36.2% | 0.0% |
| Fagus Voting District | 400 | 314 | 92.9% | 4.9% | 0.8% | 0.0% | $43k | 8.1% | 28.8% | 22.0% | 73.5% | 12.3% | 1.5% |
| Fisk Voting District | 1,109 | 827 | 91.7% | 0.4% | 1.3% | 0.9% | $56k | 10.9% | 15.0% | 22.4% | 83.0% | 23.5% | 1.7% |
| Hendrickson Voting District | 1,428 | 1,160 | 90.2% | 0.8% | 2.5% | 0.0% | $63k | 26.4% | 17.0% | 20.8% | 82.6% | 5.6% | 1.1% |
| Hill View Voting District | 1,794 | 1,383 | 88.4% | 1.7% | 0.9% | 0.0% | $42k | 7.9% | 9.8% | 28.1% | 67.1% | 24.6% | 0.0% |
| Kinyon Voting District | 1,420 | 1,213 | 90.9% | 3.6% | 1.0% | 0.0% | $76k | 14.3% | 9.6% | 19.2% | 52.5% | 15.9% | 3.6% |
| Lake Road Voting District | 3,139 | 2,420 | 79.3% | 3.2% | 5.6% | 0.0% | $42k | 21.6% | 16.3% | 18.1% | 53.1% | 28.7% | 0.8% |
| Moark Voting District | 1,214 | 1,022 | 92.9% | 0.1% | 2.6% | 0.1% | $69k | 26.7% | 11.4% | 24.4% | 84.5% | 6.6% | 2.6% |
| Neelyville Voting District | 562 | 406 | 87.1% | 0.1% | 11.1% | 0.0% | $40k | 7.7% | 12.1% | 15.1% | 73.2% | 44.6% | 0.0% |
| Oak Brier Voting District | 667 | 543 | 90.1% | 0.6% | 1.8% | 0.0% | $58k | 20.3% | 22.4% | 16.7% | 84.0% | 11.6% | 0.0% |
| Oak Grove Voting District | 4,558 | 3,246 | 86.0% | 5.5% | 2.5% | 0.7% | $57k | 18.0% | 19.8% | 17.2% | 66.2% | 14.0% | 1.2% |
| Oglesville Voting District | 320 | 248 | 93.0% | 4.7% | 1.0% | 0.0% | $44k | 8.3% | 27.7% | 21.5% | 74.7% | 13.5% | 1.5% |
| Poplar Bluff Ward 1 | 2,577 | 1,918 | 84.4% | 2.2% | 5.7% | 0.4% | $46k | 8.1% | 21.7% | 11.5% | 52.9% | 23.8% | 1.8% |
| Poplar Bluff Ward 2 | 3,870 | 2,827 | 81.5% | 2.5% | 5.8% | 0.9% | $41k | 18.0% | 16.5% | 23.9% | 51.7% | 15.5% | 2.6% |
| Poplar Bluff Ward 3 | 1,515 | 1,278 | 82.2% | 2.2% | 7.3% | 0.0% | $27k | 9.4% | 24.2% | 26.0% | 52.7% | 30.9% | 1.6% |
| Poplar Bluff Ward 4 | 2,800 | 2,169 | 86.1% | 1.3% | 6.1% | 1.9% | $56k | 19.3% | 15.6% | 23.1% | 66.5% | 12.0% | 0.7% |
| Poplar Bluff Ward 5 | 2,626 | 1,837 | 67.9% | 3.3% | 24.1% | 0.6% | $43k | 11.2% | 31.4% | 11.5% | 51.1% | 36.2% | 0.0% |
| Qulin Voting District | 729 | 660 | 95.4% | 1.2% | 1.8% | 0.0% | $45k | 10.3% | 27.8% | 15.0% | 62.9% | 21.1% | 0.3% |
| Rombauer Voting District | 671 | 563 | 95.2% | 1.0% | 0.0% | 0.0% | $52k | 8.2% | 13.1% | 21.4% | 88.7% | 20.6% | 1.5% |
| Sale Barn Voting District | 3,031 | 2,507 | 89.6% | 0.1% | 1.3% | 0.3% | $55k | 12.0% | 18.8% | 19.9% | 60.8% | 25.1% | 0.0% |
| Twin Springs Voting District | 3,299 | 2,356 | 90.8% | 2.8% | 2.2% | 0.0% | $53k | 14.9% | 14.9% | 21.7% | 64.2% | 24.6% | 0.8% |
| Walton Chapel Voting District | 807 | 581 | 82.5% | 11.6% | 4.1% | 0.1% | $63k | 36.0% | 6.2% | 18.9% | 89.7% | 11.6% | 0.0% |
| Wappapello Voting District | 1,093 | 898 | 92.3% | 1.4% | 0.7% | 0.0% | $57k | 13.8% | 20.1% | 16.6% | 85.5% | 19.9% | 0.4% |
Howell: 21 precincts
| Precinct | Population | Voting-age pop. | % White non-Hisp. | % Hispanic | % Black | % Asian | Median income* | % Bachelor's+ | % 18-29 (of adults) | % 65+ | % Homeowners | % Below poverty | % Spanish at home (adults) |
|---|---|---|---|---|---|---|---|---|---|---|---|---|---|
| Benton No. 1 Voting District | 606 | 538 | 92.1% | 0.0% | 0.0% | 0.0% | $64k | 15.0% | 3.4% | 19.8% | 97.7% | 13.8% | 0.1% |
| Benton No. 2 Voting District | 1,047 | 829 | 87.7% | 0.3% | 0.0% | 0.1% | $47k | 9.6% | 6.3% | 21.4% | 88.9% | 21.6% | 0.2% |
| Chapel Voting District | 668 | 498 | 83.9% | 9.3% | 0.4% | 0.0% | $50k | 32.5% | 9.6% | 22.8% | 88.4% | 14.3% | 0.0% |
| Dry Creek Voting District | 1,292 | 1,056 | 94.7% | 0.9% | 0.0% | 2.3% | $37k | 19.6% | 13.5% | 19.3% | 81.7% | 11.5% | 0.3% |
| Goldsberry Voting District | 4,104 | 3,253 | 91.2% | 5.0% | 0.2% | 0.0% | $41k | 15.0% | 15.7% | 22.4% | 65.3% | 28.7% | 2.6% |
| Howell No. 1 Voting District | 3,009 | 2,149 | 95.5% | 0.8% | 0.5% | 0.4% | $51k | 17.3% | 21.0% | 15.0% | 65.8% | 20.9% | 2.6% |
| Howell No. 2 Voting District | 2,487 | 1,930 | 96.7% | 0.4% | 0.7% | 0.3% | $55k | 11.4% | 25.2% | 17.9% | 55.0% | 22.6% | 1.9% |
| Howell No. 3 Voting District | 1,696 | 1,341 | 96.3% | 0.0% | 1.9% | 0.1% | $63k | 31.0% | 19.2% | 17.6% | 48.7% | 13.6% | 0.1% |
| Howell No. 4 Voting District | 2,015 | 1,675 | 84.9% | 0.0% | 1.1% | 2.3% | $28k | 5.7% | 31.0% | 25.2% | 27.0% | 45.3% | 0.0% |
| Howell No. 5 Voting District | 7,615 | 5,344 | 94.2% | 1.7% | 0.4% | 0.5% | $53k | 18.5% | 19.1% | 18.2% | 72.0% | 21.8% | 3.5% |
| Howell No. 6 Voting District | 2,355 | 1,885 | 96.6% | 0.4% | 0.0% | 0.5% | $57k | 13.4% | 14.7% | 23.7% | 78.9% | 15.6% | 0.3% |
| Howell No. 7 Voting District | 913 | 732 | 93.2% | 0.8% | 0.1% | 0.1% | $65k | 19.9% | 15.8% | 24.2% | 83.8% | 16.2% | 1.7% |
| Hutton Valley Voting District | 1,042 | 776 | 85.8% | 7.7% | 0.3% | 0.2% | $50k | 29.2% | 10.0% | 21.4% | 86.9% | 16.0% | 0.3% |
| Myatt 1 Voting District | 596 | 493 | 90.7% | 1.4% | 0.0% | 0.1% | $68k | 27.2% | 11.1% | 27.7% | 89.5% | 15.0% | 3.3% |
| Myatt 2 Voting District | 140 | 115 | 90.8% | 1.4% | 0.0% | 0.1% | $68k | 27.8% | 11.2% | 27.4% | 89.4% | 15.4% | 3.4% |
| Siloam Springs Voting District | 1,249 | 867 | 81.1% | 3.2% | 0.0% | 0.0% | $64k | 26.3% | 20.3% | 17.3% | 89.0% | 16.1% | 0.1% |
| Sisson Voting District | 1,615 | 1,201 | 91.2% | 5.6% | 0.0% | 0.1% | $54k | 20.1% | 10.3% | 18.3% | 81.9% | 25.7% | 0.0% |
| South Fork Voting District | 1,024 | 906 | 88.9% | 1.1% | 0.5% | 0.3% | $66k | 17.9% | 9.2% | 32.9% | 91.6% | 7.6% | 1.4% |
| Spring Creek Voting District | 1,795 | 1,222 | 87.1% | 6.8% | 0.0% | 0.2% | $72k | 25.5% | 17.0% | 16.5% | 83.8% | 15.1% | 2.9% |
| Willow Springs No. 1 Voting District | 3,065 | 2,264 | 87.6% | 3.3% | 1.7% | 0.3% | $54k | 14.2% | 19.6% | 17.2% | 72.1% | 15.6% | 1.0% |
| Willow Springs No. 2 Voting District | 2,030 | 1,551 | 88.2% | 6.1% | 0.1% | 0.4% | $47k | 16.2% | 16.9% | 20.8% | 67.3% | 13.0% | 0.9% |
Scott: 19 precincts
| Precinct | Population | Voting-age pop. | % White non-Hisp. | % Hispanic | % Black | % Asian | Median income* | % Bachelor's+ | % 18-29 (of adults) | % 65+ | % Homeowners | % Below poverty | % Spanish at home (adults) |
|---|---|---|---|---|---|---|---|---|---|---|---|---|---|
| Benton Voting District | 2,457 | 2,021 | 85.2% | 6.3% | 4.8% | 0.1% | $59k | 22.4% | 17.8% | 19.5% | 76.9% | 17.3% | 1.5% |
| Blodgett Voting District | 1,258 | 907 | 83.7% | 2.0% | 0.8% | 0.0% | $112k | 20.9% | 15.5% | 19.9% | 86.8% | 10.1% | 0.0% |
| Chaffee Voting District | 3,330 | 2,470 | 92.0% | 0.7% | 0.2% | 0.0% | $56k | 20.0% | 13.7% | 17.1% | 77.1% | 8.6% | 0.3% |
| Commerce Voting District | 980 | 833 | 91.5% | 5.0% | 0.0% | 0.0% | $66k | 27.1% | 14.8% | 14.8% | 82.2% | 8.2% | 3.8% |
| Diehlstadt Voting District | 731 | 541 | 73.6% | 4.3% | 0.5% | 0.0% | $80k | 15.7% | 18.5% | 21.1% | 76.1% | 13.3% | 0.3% |
| Haywood City Voting District | 160 | 118 | 82.8% | 3.9% | 7.6% | 1.5% | $82k | 20.2% | 18.0% | 17.1% | 83.7% | 16.6% | 1.6% |
| Kelso Voting District | 1,706 | 1,332 | 93.0% | 1.4% | 0.1% | 0.1% | $72k | 24.0% | 18.0% | 14.9% | 78.5% | 5.6% | 0.9% |
| McMullin Voting District | 1,889 | 1,432 | 93.4% | 0.4% | 1.6% | 0.0% | $78k | 28.5% | 17.6% | 25.6% | 82.1% | 8.9% | 0.2% |
| Miner Voting District | 1,111 | 840 | 79.6% | 1.6% | 6.3% | 0.0% | $55k | 12.8% | 21.8% | 16.3% | 65.0% | 14.2% | 0.5% |
| Morley Voting District | 448 | 336 | 79.2% | 7.0% | 7.9% | 1.0% | $62k | 15.5% | 18.7% | 16.9% | 77.8% | 21.2% | 1.8% |
| New Hamburg Voting District | 1,072 | 850 | 89.9% | 2.9% | 2.2% | 0.1% | $72k | 23.8% | 15.3% | 18.2% | 78.7% | 9.1% | 0.8% |
| Oran Voting District | 2,161 | 1,678 | 83.3% | 2.6% | 2.1% | 0.1% | $63k | 15.8% | 17.6% | 17.0% | 72.5% | 14.0% | 0.9% |
| Perkins Voting District | 450 | 354 | 87.0% | 2.8% | 2.7% | 0.0% | $71k | 9.1% | 16.3% | 17.0% | 82.9% | 10.0% | 1.1% |
| Scott City Voting District | 5,033 | 3,727 | 89.4% | 2.1% | 0.2% | 0.1% | $72k | 14.2% | 25.0% | 13.1% | 76.5% | 9.3% | 0.0% |
| Vanduser Voting District | 816 | 616 | 85.0% | 3.6% | 7.1% | 1.4% | $68k | 20.1% | 18.4% | 18.2% | 81.9% | 16.0% | 1.6% |
| Ward 1 Voting District | 4,906 | 3,679 | 80.1% | 1.6% | 13.0% | 0.0% | $80k | 42.6% | 13.4% | 25.5% | 73.1% | 11.5% | 3.2% |
| Ward 2 Voting District | 3,533 | 2,754 | 79.2% | 3.5% | 7.8% | 0.1% | $55k | 18.1% | 22.0% | 17.5% | 55.2% | 17.9% | 4.1% |
| Ward 3 Voting District | 3,342 | 2,424 | 61.3% | 5.3% | 25.7% | 0.0% | $54k | 16.9% | 18.1% | 21.9% | 58.9% | 15.9% | 3.3% |
| Ward 4 Voting District | 2,342 | 1,774 | 44.6% | 0.1% | 50.8% | 0.0% | $50k | 17.1% | 19.5% | 17.6% | 52.4% | 21.7% | 0.3% |
Stoddard: 20 precincts
| Precinct | Population | Voting-age pop. | % White non-Hisp. | % Hispanic | % Black | % Asian | Median income* | % Bachelor's+ | % 18-29 (of adults) | % 65+ | % Homeowners | % Below poverty | % Spanish at home (adults) |
|---|---|---|---|---|---|---|---|---|---|---|---|---|---|
| Advance City Voting District | 114 | 92 | 93.5% | 1.6% | 1.0% | 0.0% | $59k | 17.0% | 20.8% | 18.4% | 81.2% | 13.1% | 2.6% |
| Advance Rural Voting District | 2,278 | 1,838 | 94.8% | 1.3% | 0.7% | 0.0% | $61k | 17.3% | 19.4% | 19.8% | 83.6% | 13.8% | 2.0% |
| Bell City Voting District | 1,243 | 1,003 | 91.1% | 1.9% | 0.2% | 0.1% | $67k | 18.5% | 21.7% | 19.0% | 73.3% | 26.2% | 2.3% |
| Bernie City Voting District | 407 | 321 | 92.2% | 2.3% | 1.0% | 0.3% | $57k | 15.8% | 11.6% | 21.3% | 75.9% | 21.2% | 0.3% |
| Bernie Rural Voting District | 2,296 | 1,765 | 90.2% | 1.9% | 0.7% | 0.3% | $65k | 16.3% | 10.3% | 23.4% | 80.3% | 15.4% | 0.3% |
| Bloomfield Rural Voting District | 4,486 | 3,468 | 93.5% | 2.5% | 0.8% | 0.5% | $67k | 17.7% | 12.2% | 20.9% | 79.1% | 11.8% | 0.2% |
| Bloomfield Ward No. 1 | 433 | 340 | 95.9% | 0.3% | 0.5% | 0.0% | $40k | 5.9% | 9.3% | 25.2% | 75.4% | 26.2% | 0.0% |
| Bloomfield Ward No. 2 | 290 | 225 | 96.0% | 0.0% | 0.9% | 0.0% | $47k | 16.2% | 17.7% | 16.5% | 70.1% | 21.6% | 0.0% |
| Dexter Rural Voting District | 5,346 | 4,243 | 94.9% | 2.3% | 0.6% | 0.1% | $62k | 18.2% | 17.6% | 25.3% | 73.3% | 10.9% | 0.3% |
| Dexter Ward No. 1 | 2,318 | 1,794 | 92.9% | 3.4% | 0.0% | 0.0% | $48k | 17.7% | 28.2% | 16.2% | 45.4% | 23.2% | 3.1% |
| Dexter Ward No. 2 | 1,698 | 1,303 | 88.0% | 5.7% | 0.1% | 0.0% | $71k | 30.8% | 23.3% | 18.8% | 76.5% | 8.6% | 1.9% |
| Dexter Ward No. 3 | 1,248 | 934 | 90.7% | 4.3% | 1.2% | 0.0% | $47k | 4.8% | 29.4% | 16.3% | 43.0% | 25.9% | 0.3% |
| Dudley Voting District | 491 | 394 | 97.1% | 1.1% | 0.5% | 0.0% | $53k | 9.1% | 9.9% | 24.2% | 74.9% | 11.6% | 0.0% |
| Essex Voting District | 1,047 | 805 | 88.1% | 2.6% | 8.4% | 0.0% | $61k | 9.0% | 9.2% | 14.7% | 73.8% | 22.2% | 1.3% |
| Gray Ridge Voting District | 561 | 446 | 93.3% | 0.3% | 2.8% | 1.1% | $42k | 5.5% | 11.3% | 20.0% | 59.7% | 21.1% | 0.4% |
| Leora Voting District | 1,172 | 943 | 92.5% | 0.1% | 6.4% | 0.0% | $74k | 12.1% | 24.7% | 17.5% | 68.3% | 13.6% | 0.0% |
| Puxico City Voting District | 17 | 13 | 95.7% | 0.9% | 0.3% | 0.0% | $47k | 14.3% | 19.4% | 20.2% | 56.8% | 17.1% | 0.2% |
| Puxico Rural Voting District | 2,099 | 1,569 | 95.3% | 0.5% | 0.3% | 0.0% | $51k | 18.7% | 12.9% | 17.0% | 71.3% | 13.8% | 0.1% |
| Pyle Voting District | 476 | 348 | 88.3% | 0.1% | 0.0% | 0.0% | $74k | 15.4% | 5.7% | 29.1% | 88.8% | 2.9% | 0.0% |
| Vinson Voting District | 341 | 261 | 78.9% | 2.4% | 0.4% | 0.1% | $75k | 14.3% | 10.6% | 27.0% | 58.1% | 15.5% | 0.0% |
Dunklin: 21 precincts
| Precinct | Population | Voting-age pop. | % White non-Hisp. | % Hispanic | % Black | % Asian | Median income* | % Bachelor's+ | % 18-29 (of adults) | % 65+ | % Homeowners | % Below poverty | % Spanish at home (adults) |
|---|---|---|---|---|---|---|---|---|---|---|---|---|---|
| Arbyrd Voting District | 285 | 206 | 68.4% | 13.1% | 0.0% | 0.0% | $42k | 10.8% | 28.0% | 18.3% | 73.0% | 23.3% | 7.3% |
| Campbell Ward 1 | 1,566 | 1,083 | 76.2% | 4.2% | 0.3% | 0.0% | $47k | 9.5% | 22.1% | 14.6% | 63.4% | 31.1% | 1.4% |
| Campbell Ward 2 & Rural | 1,135 | 909 | 76.5% | 3.4% | 5.8% | 0.0% | $72k | 10.0% | 18.5% | 19.3% | 83.8% | 17.1% | 2.1% |
| Cardwell Voting District | 1,370 | 992 | 74.9% | 9.0% | 0.0% | 0.0% | $31k | 9.4% | 40.4% | 12.9% | 51.6% | 41.8% | 4.1% |
| Caruth Voting District | 123 | 100 | 91.5% | 0.7% | 0.0% | 0.0% | $56k | 14.7% | 16.1% | 27.7% | 91.5% | 16.1% | 0.0% |
| Clarkton Voting District | 1,085 | 757 | 65.7% | 18.6% | 4.0% | 0.0% | $49k | 9.7% | 23.4% | 11.9% | 64.7% | 23.4% | 14.1% |
| Glennonville Voting District | 454 | 336 | 70.4% | 2.9% | 0.0% | 0.0% | $43k | 13.9% | 22.8% | 12.2% | 84.0% | 4.8% | 0.0% |
| Holcomb Voting District | 1,089 | 813 | 74.5% | 9.3% | 1.1% | 0.5% | $50k | 12.6% | 16.2% | 17.2% | 67.0% | 18.2% | 7.9% |
| Hornersville Voting District | 728 | 572 | 90.7% | 5.1% | 0.0% | 0.0% | $44k | 12.3% | 14.3% | 19.8% | 77.2% | 29.4% | 4.2% |
| Independence Rural Voting District | 5,847 | 4,378 | 78.3% | 3.1% | 7.6% | 0.9% | $58k | 19.4% | 14.4% | 20.8% | 71.5% | 17.0% | 2.9% |
| Kennett Ward 1 | 1,692 | 1,316 | 73.6% | 2.2% | 9.3% | 0.9% | $43k | 8.5% | 16.0% | 20.7% | 51.1% | 14.8% | 3.6% |
| Kennett Ward 2 | 1,018 | 689 | 59.5% | 1.6% | 33.4% | 0.0% | $35k | 10.9% | 16.9% | 13.7% | 37.5% | 41.4% | 4.8% |
| Kennett Ward 3 | 1,017 | 753 | 74.0% | 5.8% | 11.8% | 0.0% | $43k | 8.2% | 10.0% | 23.6% | 46.3% | 13.5% | 6.9% |
| Kennett Ward 4 | 1,532 | 1,191 | 85.4% | 0.9% | 7.5% | 1.2% | $58k | 17.9% | 23.4% | 17.8% | 54.8% | 16.6% | 3.4% |
| Kennett Ward 5 | 677 | 503 | 75.9% | 1.3% | 6.7% | 0.1% | $56k | 17.2% | 10.5% | 22.3% | 72.3% | 20.3% | 0.5% |
| Malden Ward 1 & 2 | 1,206 | 839 | 60.7% | 5.4% | 11.6% | 0.0% | $44k | 4.2% | 22.7% | 20.8% | 52.1% | 38.3% | 4.1% |
| Malden Ward 3 & Rural | 3,188 | 2,331 | 71.6% | 10.3% | 9.8% | 0.0% | $56k | 13.1% | 15.7% | 18.6% | 55.8% | 21.1% | 7.1% |
| Malden Ward 4 | 847 | 645 | 79.7% | 3.7% | 8.4% | 0.0% | $43k | 17.1% | 9.6% | 24.0% | 47.0% | 21.8% | 3.4% |
| Rives Voting District | 416 | 342 | 92.8% | 0.4% | 0.0% | 0.0% | $54k | 14.1% | 11.9% | 29.8% | 90.5% | 17.2% | 0.0% |
| Senath Voting District | 1,821 | 1,297 | 52.2% | 39.8% | 1.5% | 0.2% | $40k | 8.6% | 20.1% | 17.2% | 64.6% | 21.8% | 28.9% |
| Sunnyvale Voting District | 308 | 227 | 70.1% | 2.9% | 0.0% | 0.0% | $42k | 14.0% | 22.8% | 12.1% | 84.1% | 4.7% | 0.0% |
Texas: 17 precincts
| Precinct | Population | Voting-age pop. | % White non-Hisp. | % Hispanic | % Black | % Asian | Median income* | % Bachelor's+ | % 18-29 (of adults) | % 65+ | % Homeowners | % Below poverty | % Spanish at home (adults) |
|---|---|---|---|---|---|---|---|---|---|---|---|---|---|
| Boone Voting District | 598 | 456 | 94.8% | 5.1% | 0.1% | 0.0% | $67k | 7.9% | 14.4% | 24.0% | 82.4% | 11.8% | 0.0% |
| Burdine Voting District | 2,712 | 2,084 | 87.6% | 3.3% | 0.3% | 0.7% | $42k | 18.1% | 17.9% | 20.4% | 64.0% | 24.3% | 1.6% |
| Carroll Voting District | 679 | 524 | 84.3% | 2.4% | 3.5% | 0.0% | $56k | 20.3% | 13.7% | 26.3% | 82.0% | 15.3% | 0.3% |
| Cass Voting District | 948 | 786 | 90.7% | 2.3% | 0.3% | 0.2% | $43k | 16.0% | 8.8% | 30.5% | 88.4% | 17.8% | 0.6% |
| Clinton Voting District | 1,539 | 1,240 | 93.3% | 1.0% | 0.5% | 0.7% | $49k | 18.9% | 15.2% | 27.2% | 72.7% | 8.8% | 0.2% |
| Current Voting District | 417 | 314 | 84.9% | 2.2% | 8.6% | 0.0% | $45k | 13.5% | 13.5% | 22.6% | 81.3% | 22.2% | 0.0% |
| Date Voting District | 300 | 217 | 86.0% | 8.3% | 0.0% | 0.0% | $61k | 42.3% | 15.7% | 20.2% | 67.8% | 12.6% | 1.9% |
| Jackson Voting District | 1,452 | 1,122 | 91.3% | 1.2% | 5.0% | 0.0% | $54k | 14.3% | 14.8% | 22.8% | 82.6% | 17.4% | 0.0% |
| Lynch Voting District | 2,308 | 1,741 | 95.3% | 1.2% | 0.1% | 0.0% | $49k | 16.9% | 14.0% | 22.4% | 85.3% | 16.5% | 0.0% |
| Morris Voting District | 1,173 | 916 | 92.4% | 2.1% | 0.8% | 0.5% | $57k | 23.9% | 14.6% | 27.6% | 80.7% | 8.4% | 1.9% |
| Ozark Voting District | 504 | 374 | 87.6% | 5.1% | 4.3% | 0.0% | $48k | 25.5% | 12.5% | 20.3% | 75.2% | 20.8% | 0.9% |
| Pierce Voting District | 393 | 303 | 86.3% | 9.7% | 0.0% | 0.0% | $52k | 32.2% | 13.4% | 25.3% | 76.6% | 14.9% | 1.6% |
| Piney Voting District | 3,835 | 3,017 | 91.9% | 2.4% | 0.7% | 0.0% | $43k | 18.5% | 18.4% | 18.5% | 70.9% | 25.6% | 1.4% |
| Roubidoux Voting District | 2,035 | 1,464 | 77.6% | 0.6% | 11.4% | 0.0% | $59k | 22.3% | 18.1% | 16.4% | 93.5% | 24.4% | 0.3% |
| Sargent Voting District | 350 | 320 | 84.4% | 7.0% | 0.0% | 0.0% | $43k | 6.6% | 9.5% | 42.9% | 98.2% | 15.6% | 0.0% |
| Sherrill Voting District | 5,353 | 4,273 | 86.6% | 2.4% | 8.4% | 0.0% | $47k | 8.1% | 17.6% | 17.4% | 71.6% | 24.1% | 2.1% |
| Upton Voting District | 624 | 488 | 94.8% | 3.7% | 0.0% | 0.0% | $73k | 22.3% | 12.0% | 32.0% | 89.0% | 9.5% | 4.5% |
Perry: 18 precincts
| Precinct | Population | Voting-age pop. | % White non-Hisp. | % Hispanic | % Black | % Asian | Median income* | % Bachelor's+ | % 18-29 (of adults) | % 65+ | % Homeowners | % Below poverty | % Spanish at home (adults) |
|---|---|---|---|---|---|---|---|---|---|---|---|---|---|
| Altenburg Voting District | 836 | 629 | 92.4% | 0.2% | 2.0% | 0.0% | $68k | 21.9% | 13.3% | 23.8% | 87.8% | 4.6% | 0.0% |
| Belgique/Sereno Voting District | 1,114 | 823 | 95.2% | 2.8% | 0.0% | 0.0% | $85k | 37.3% | 21.7% | 12.7% | 85.2% | 12.4% | 0.1% |
| Biehle Voting District | 840 | 660 | 97.5% | 1.5% | 0.0% | 0.0% | $70k | 15.3% | 13.8% | 24.1% | 88.5% | 4.2% | 0.2% |
| Brewer Voting District | 915 | 721 | 99.0% | 0.5% | 0.0% | 0.0% | $88k | 24.9% | 16.4% | 18.8% | 94.7% | 21.9% | 0.3% |
| Crosstown Voting District | 447 | 377 | 98.3% | 1.3% | 0.0% | 0.0% | $64k | 18.8% | 15.1% | 19.7% | 82.3% | 4.2% | 0.6% |
| Farrar Voting District | 295 | 247 | 98.6% | 0.4% | 0.3% | 0.0% | $65k | 21.0% | 15.4% | 24.8% | 91.1% | 3.2% | 0.1% |
| Frohna Voting District | 437 | 331 | 92.7% | 0.2% | 1.9% | 0.0% | $68k | 21.9% | 13.7% | 23.6% | 87.7% | 4.5% | 0.0% |
| Highland Voting District | 618 | 477 | 97.2% | 1.5% | 0.0% | 0.0% | $71k | 15.4% | 13.9% | 24.3% | 90.6% | 4.0% | 0.1% |
| Lithium Voting District | 478 | 359 | 97.0% | 1.7% | 0.0% | 0.0% | $92k | 34.1% | 20.0% | 14.8% | 91.3% | 18.4% | 0.0% |
| Longtown Voting District | 348 | 303 | 99.9% | 0.1% | 0.0% | 0.0% | $59k | 14.9% | 12.9% | 42.5% | 95.6% | 7.8% | 0.6% |
| P-1 Voting District | 1,529 | 1,165 | 91.3% | 2.0% | 4.8% | 0.0% | $53k | 26.1% | 12.9% | 17.9% | 65.8% | 21.4% | 1.7% |
| P-2 | 2,690 | 1,963 | 83.8% | 5.5% | 0.5% | 4.4% | $56k | 15.2% | 18.5% | 14.7% | 55.7% | 15.3% | 3.9% |
| P-3 Voting District | 2,335 | 1,835 | 94.9% | 2.5% | 0.3% | 0.9% | $50k | 19.4% | 26.8% | 17.0% | 63.5% | 22.3% | 3.2% |
| P-4 Voting District | 1,954 | 1,543 | 95.3% | 2.7% | 0.7% | 0.0% | $68k | 24.3% | 12.3% | 19.2% | 78.4% | 9.0% | 2.2% |
| P-5 Voting District | 1,662 | 1,298 | 89.8% | 4.2% | 0.0% | 1.6% | $55k | 18.8% | 18.8% | 17.1% | 69.8% | 16.5% | 2.6% |
| Silver Lake Voting District | 1,405 | 1,085 | 92.9% | 3.1% | 0.0% | 0.0% | $58k | 19.6% | 16.3% | 20.2% | 79.0% | 15.1% | 2.0% |
| Uniontown Voting District | 543 | 466 | 99.3% | 0.2% | 0.1% | 0.0% | $60k | 15.4% | 13.0% | 40.4% | 95.1% | 7.4% | 0.5% |
| Yount Voting District | 674 | 531 | 99.7% | 0.2% | 0.0% | 0.0% | $71k | 14.2% | 19.0% | 25.1% | 84.7% | 11.8% | 0.0% |
Wright: 8 precincts
| Precinct | Population | Voting-age pop. | % White non-Hisp. | % Hispanic | % Black | % Asian | Median income* | % Bachelor's+ | % 18-29 (of adults) | % 65+ | % Homeowners | % Below poverty | % Spanish at home (adults) |
|---|---|---|---|---|---|---|---|---|---|---|---|---|---|
| Brush Creek Voting District | 1,004 | 816 | 89.2% | 1.5% | 3.7% | 0.3% | $36k | 11.5% | 19.8% | 19.3% | 69.9% | 28.5% | 0.0% |
| Fairview Voting District | 1,888 | 1,445 | 91.7% | 1.8% | 0.1% | 0.0% | $63k | 11.7% | 16.0% | 22.6% | 71.3% | 17.1% | 2.0% |
| Grovespring Voting District | 1,098 | 1,007 | 99.9% | 0.0% | 0.0% | 0.0% | $46k | 17.1% | 9.6% | 27.5% | 84.1% | 13.2% | 0.0% |
| Hart Voting District | 1,826 | 1,375 | 88.8% | 8.6% | 1.3% | 0.0% | $60k | 19.6% | 17.0% | 19.0% | 80.7% | 11.7% | 2.3% |
| Little Creek Voting District | 1,145 | 752 | 98.5% | 0.4% | 0.2% | 0.0% | $35k | 13.4% | 22.5% | 12.5% | 86.9% | 35.7% | 0.6% |
| Manes Voting District | 926 | 691 | 92.2% | 2.3% | 0.6% | 0.0% | $48k | 8.0% | 7.5% | 23.5% | 86.1% | 22.1% | 0.3% |
| Mountain Grove Voting District | 5,734 | 4,262 | 87.3% | 2.9% | 0.0% | 1.0% | $46k | 15.4% | 14.7% | 21.0% | 75.1% | 16.9% | 0.1% |
| Pleasant Valley/Norwood Voting District | 5,317 | 3,698 | 94.8% | 1.8% | 0.6% | 0.0% | $50k | 19.4% | 22.2% | 16.9% | 76.7% | 18.8% | 0.8% |
Ste. Genevieve: 12 precincts
| Precinct | Population | Voting-age pop. | % White non-Hisp. | % Hispanic | % Black | % Asian | Median income* | % Bachelor's+ | % 18-29 (of adults) | % 65+ | % Homeowners | % Below poverty | % Spanish at home (adults) |
|---|---|---|---|---|---|---|---|---|---|---|---|---|---|
| Bloomsdale Voting District | 1,382 | 1,117 | 98.0% | 1.0% | 0.7% | 0.0% | $99k | 14.6% | 13.4% | 17.6% | 94.3% | 6.8% | 0.0% |
| Chestnut Ridge Voting District | 788 | 556 | 98.6% | 0.7% | 0.0% | 0.0% | $84k | 12.3% | 23.1% | 17.3% | 76.3% | 2.4% | 0.0% |
| Coffman Voting District | 986 | 731 | 95.9% | 3.2% | 0.0% | 0.0% | $84k | 9.0% | 10.7% | 20.2% | 77.3% | 3.9% | 0.0% |
| Kinsey Voting District | 1,877 | 1,437 | 93.2% | 2.4% | 0.6% | 0.0% | $96k | 19.5% | 11.7% | 15.2% | 95.1% | 7.5% | 0.0% |
| New Offenburg Voting District | 2,435 | 1,923 | 98.6% | 0.2% | 0.0% | 0.1% | $82k | 19.7% | 12.0% | 26.1% | 94.8% | 6.6% | 0.0% |
| Ozora Voting District | 941 | 690 | 97.5% | 0.3% | 0.3% | 0.1% | $75k | 18.2% | 11.8% | 15.2% | 75.0% | 13.3% | 0.2% |
| Salem Voting District | 1,060 | 784 | 99.4% | 0.1% | 0.0% | 0.0% | $95k | 28.7% | 14.2% | 27.2% | 96.0% | 5.0% | 0.0% |
| St.Mary's Voting District | 333 | 277 | 91.3% | 0.2% | 1.8% | 0.0% | $63k | 11.2% | 10.1% | 24.4% | 75.4% | 15.9% | 0.7% |
| Ste. Genevieve 5 Voting District | 4,222 | 3,466 | 88.9% | 2.0% | 2.6% | 0.1% | $60k | 16.1% | 20.5% | 24.2% | 72.8% | 9.4% | 1.5% |
| Ste. Genevieve North Voting District | 598 | 475 | 77.3% | 1.2% | 0.0% | 0.1% | $37k | 15.4% | 18.4% | 22.4% | 73.0% | 15.3% | 1.0% |
| Ste. Genevieve South Voting District | 851 | 726 | 89.3% | 3.3% | 4.1% | 0.0% | $59k | 14.1% | 25.2% | 27.1% | 65.2% | 8.8% | 2.4% |
| Zell Voting District | 2,991 | 2,333 | 95.5% | 1.7% | 1.7% | 0.0% | $74k | 15.9% | 18.3% | 18.8% | 83.3% | 8.6% | 0.6% |
New Madrid: 30 precincts
| Precinct | Population | Voting-age pop. | % White non-Hisp. | % Hispanic | % Black | % Asian | Median income* | % Bachelor's+ | % 18-29 (of adults) | % 65+ | % Homeowners | % Below poverty | % Spanish at home (adults) |
|---|---|---|---|---|---|---|---|---|---|---|---|---|---|
| ANDERSON 1 Voting District | 433 | 335 | 88.3% | 1.6% | 1.3% | 0.0% | $48k | 9.8% | 10.4% | 26.0% | 69.8% | 23.4% | 1.4% |
| ANDERSON 2 Voting District | 490 | 391 | 88.5% | 1.4% | 1.5% | 0.0% | $50k | 9.5% | 10.6% | 27.3% | 71.8% | 21.7% | 1.0% |
| BIG PRAIRIE 1 Voting District | 289 | 244 | 87.5% | 3.4% | 1.9% | 0.0% | $51k | 6.2% | 13.5% | 25.6% | 68.8% | 15.7% | 0.5% |
| BIG PRAIRIE 2 Voting District | 319 | 272 | 86.6% | 3.8% | 2.1% | 0.0% | $45k | 4.7% | 14.0% | 26.1% | 64.7% | 14.6% | 0.5% |
| BIG PRAIRIE 3 Voting District | 2,840 | 2,150 | 67.8% | 2.4% | 16.6% | 0.8% | $81k | 22.8% | 17.0% | 23.1% | 68.8% | 7.0% | 0.5% |
| COMO 1 Voting District | 601 | 438 | 64.7% | 6.4% | 17.3% | 0.0% | $55k | 9.4% | 19.0% | 16.6% | 62.8% | 27.9% | 7.8% |
| COMO 2 Voting District | 314 | 238 | 54.5% | 9.0% | 24.0% | 0.0% | $61k | 8.2% | 23.6% | 15.1% | 65.4% | 26.7% | 9.7% |
| COMO 3 Voting District | 149 | 118 | 90.2% | 1.7% | 1.1% | 0.0% | $61k | 12.3% | 9.0% | 25.9% | 81.9% | 16.6% | 1.6% |
| COMO 4 Voting District | 448 | 301 | 89.9% | 0.6% | 0.5% | 0.0% | $43k | 11.9% | 8.1% | 20.2% | 62.9% | 29.7% | 2.4% |
| COMO 5 Voting District | 120 | 96 | 92.5% | 0.1% | 2.3% | 0.0% | $46k | 8.4% | 11.6% | 22.4% | 85.7% | 21.0% | 0.0% |
| HOUGH 1 Voting District | 77 | 67 | 93.3% | 0.0% | 0.0% | 0.0% | $58k | 6.2% | 6.9% | 23.4% | 79.1% | 22.5% | 0.0% |
| LAFONT 1 Voting District | 572 | 423 | 68.1% | 0.2% | 18.5% | 0.0% | $37k | 5.7% | 19.1% | 13.6% | 57.0% | 27.6% | 2.9% |
| LAFONT 2 Voting District | 263 | 200 | 68.9% | 0.3% | 17.8% | 0.0% | $40k | 5.2% | 12.0% | 14.2% | 57.1% | 28.1% | 0.8% |
| LAFONT 3 Voting District | 422 | 309 | 63.5% | 0.2% | 21.1% | 0.0% | $37k | 12.8% | 18.4% | 16.0% | 63.1% | 25.6% | 0.2% |
| LESIEUR 1 Voting District | 349 | 279 | 92.5% | 0.1% | 2.3% | 0.0% | $46k | 8.4% | 11.6% | 22.4% | 85.7% | 21.0% | 0.0% |
| LEWIS 1 Voting District | 212 | 150 | 56.6% | 0.4% | 33.9% | 0.0% | $60k | 10.9% | 6.7% | 17.3% | 62.4% | 13.9% | 0.0% |
| LEWIS 2 Voting District | 807 | 500 | 68.2% | 0.1% | 21.3% | 0.0% | $41k | 5.5% | 19.4% | 8.2% | 58.1% | 33.8% | 0.8% |
| LEWIS 3 Voting District | 71 | 51 | 68.5% | 0.2% | 18.2% | 0.0% | $35k | 7.1% | 28.3% | 13.7% | 59.6% | 25.5% | 5.9% |
| LEWIS 4 Voting District | 24 | 18 | 75.7% | 0.2% | 13.4% | 0.0% | $39k | 7.6% | 22.9% | 16.3% | 68.9% | 24.1% | 4.0% |
| NEW MADRID 2 Voting District | 2,688 | 2,111 | 73.1% | 0.1% | 22.4% | 0.9% | $54k | 19.6% | 23.7% | 21.1% | 58.1% | 13.7% | 0.9% |
| NEW MADRID 4 Voting District | 205 | 172 | 84.8% | 0.1% | 7.9% | 0.0% | $58k | 7.3% | 6.6% | 22.4% | 76.3% | 19.9% | 0.0% |
| NEW MADRID 5 Voting District | 88 | 76 | 93.3% | 0.0% | 0.0% | 0.0% | $58k | 6.2% | 6.9% | 23.4% | 79.1% | 22.5% | 0.0% |
| PORTAGE 1 Voting District | 958 | 688 | 69.3% | 0.4% | 7.1% | 0.0% | $77k | 13.8% | 12.7% | 17.1% | 58.7% | 13.9% | 0.7% |
| PORTAGE 2 Voting District | 1,830 | 1,413 | 70.6% | 4.7% | 11.0% | 0.0% | $57k | 21.4% | 15.3% | 14.8% | 62.2% | 16.4% | 3.2% |
| PORTAGE 3 Voting District | 42 | 36 | 88.2% | 3.6% | 0.2% | 0.0% | $82k | 15.6% | 7.1% | 31.3% | 85.9% | 7.1% | 2.8% |
| ST. JOHN 1 Voting District | 254 | 222 | 93.3% | 0.0% | 0.0% | 0.0% | $58k | 6.2% | 6.9% | 23.4% | 79.1% | 22.5% | 0.0% |
| WEST 1 Voting District | 403 | 322 | 83.7% | 4.5% | 0.9% | 0.0% | $39k | 6.9% | 17.7% | 25.8% | 59.0% | 17.6% | 4.1% |
| WEST 2 Voting District | 386 | 310 | 83.6% | 4.3% | 0.4% | 0.0% | $35k | 5.6% | 17.0% | 25.8% | 56.9% | 18.7% | 4.5% |
| WEST 3 Voting District | 121 | 104 | 87.9% | 3.1% | 1.7% | 0.0% | $46k | 4.5% | 12.5% | 25.6% | 66.9% | 16.3% | 0.3% |
| WEST 4 Voting District | 76 | 60 | 83.7% | 5.9% | 3.8% | 0.0% | $71k | 15.3% | 21.7% | 26.2% | 73.5% | 10.4% | 1.5% |
Pemiscot: 20 precincts
| Precinct | Population | Voting-age pop. | % White non-Hisp. | % Hispanic | % Black | % Asian | Median income* | % Bachelor's+ | % 18-29 (of adults) | % 65+ | % Homeowners | % Below poverty | % Spanish at home (adults) |
|---|---|---|---|---|---|---|---|---|---|---|---|---|---|
| Bragg City Voting District | 217 | 177 | 87.6% | 0.5% | 1.1% | 0.0% | $37k | 10.8% | 12.1% | 24.7% | 73.9% | 37.7% | 0.2% |
| Braggadocio Voting District | 340 | 233 | 55.8% | 12.4% | 21.4% | 0.0% | $88k | 21.4% | 14.9% | 18.8% | 74.6% | 9.6% | 4.2% |
| Butler Voting District | 162 | 115 | 94.5% | 2.6% | 1.6% | 0.0% | $54k | 11.6% | 17.2% | 18.9% | 84.7% | 24.0% | 0.0% |
| Caruthersville Voting District | 4,839 | 3,707 | 65.0% | 3.9% | 28.3% | 0.2% | $44k | 12.2% | 23.1% | 16.8% | 48.2% | 33.0% | 1.4% |
| Concord Voting District | 324 | 235 | 90.7% | 2.5% | 4.1% | 0.0% | $53k | 11.9% | 17.1% | 20.5% | 84.1% | 23.4% | 0.3% |
| Cooter Voting District | 534 | 377 | 95.5% | 0.8% | 0.0% | 0.0% | $58k | 17.2% | 15.5% | 16.8% | 70.4% | 12.0% | 1.1% |
| Cottonwood Voting District | 162 | 130 | 83.0% | 5.6% | 1.3% | 0.0% | $64k | 16.9% | 12.3% | 24.5% | 78.5% | 10.2% | 6.1% |
| Deering Voting District | 503 | 341 | 54.5% | 12.8% | 22.2% | 0.0% | $90k | 21.8% | 15.0% | 18.5% | 74.6% | 9.3% | 4.0% |
| Godair Voting District | 148 | 105 | 92.2% | 2.6% | 3.5% | 0.0% | $53k | 11.8% | 17.7% | 18.6% | 83.2% | 24.7% | 0.0% |
| Hayti 1 Voting District | 899 | 667 | 39.2% | 1.1% | 58.3% | 0.6% | $30k | 8.7% | 30.5% | 22.9% | 44.0% | 48.9% | 0.4% |
| Hayti 2 Voting District | 1,949 | 1,195 | 35.0% | 1.5% | 51.5% | 0.1% | $32k | 5.7% | 17.5% | 11.4% | 45.8% | 40.5% | 0.8% |
| Hayti Heights 1,2,3 Voting District | 77 | 46 | 0.1% | 0.6% | 98.7% | 0.0% | $15k | 12.7% | 49.0% | 7.2% | 23.9% | 75.4% | 0.5% |
| Holland Voting District | 256 | 218 | 87.9% | 0.0% | 2.9% | 0.0% | $46k | 1.5% | 13.1% | 17.4% | 53.4% | 40.9% | 0.2% |
| Homestown Voting District | 1 | 1 | 55.6% | 0.8% | 27.8% | 0.0% | $47k | 14.4% | 15.8% | 35.3% | 79.5% | 18.0% | 2.6% |
| McCarty Voting District | 1,148 | 863 | 79.6% | 3.2% | 7.5% | 1.0% | $52k | 15.4% | 11.9% | 21.6% | 63.4% | 12.4% | 4.2% |
| Pascola Voting District | 348 | 272 | 54.9% | 0.6% | 33.9% | 0.0% | $38k | 12.5% | 20.0% | 25.1% | 67.3% | 38.2% | 1.2% |
| Steele 1,2,Rural Voting District | 1,558 | 1,184 | 79.3% | 2.0% | 6.1% | 0.0% | $56k | 19.8% | 15.6% | 19.3% | 53.7% | 22.5% | 1.1% |
| Tyler Voting District | 354 | 283 | 83.0% | 5.6% | 1.3% | 0.0% | $64k | 16.9% | 12.3% | 24.5% | 78.5% | 10.2% | 6.1% |
| Virginia Voting District | 617 | 499 | 74.3% | 3.9% | 7.5% | 0.0% | $53k | 8.7% | 14.1% | 20.0% | 56.2% | 30.6% | 0.7% |
| Wardell Voting District | 411 | 336 | 81.4% | 0.7% | 6.6% | 0.0% | $41k | 11.5% | 13.1% | 26.7% | 75.9% | 32.7% | 0.6% |
Dent: 7 precincts
| Precinct | Population | Voting-age pop. | % White non-Hisp. | % Hispanic | % Black | % Asian | Median income* | % Bachelor's+ | % 18-29 (of adults) | % 65+ | % Homeowners | % Below poverty | % Spanish at home (adults) |
|---|---|---|---|---|---|---|---|---|---|---|---|---|---|
| Bunker Voting District | 516 | 397 | 86.2% | 3.9% | 0.7% | 0.0% | $37k | 10.3% | 12.5% | 30.0% | 88.9% | 23.2% | 0.3% |
| R-1 | 1,197 | 917 | 87.9% | 3.5% | 0.5% | 0.1% | $44k | 11.1% | 12.4% | 28.0% | 89.2% | 19.5% | 0.2% |
| R-2 | 1,116 | 933 | 91.2% | 1.0% | 0.0% | 1.2% | $50k | 13.8% | 18.9% | 25.4% | 91.2% | 4.9% | 0.4% |
| R-3 | 2,309 | 1,775 | 91.1% | 1.3% | 0.1% | 2.4% | $69k | 21.2% | 14.6% | 20.1% | 91.5% | 10.2% | 0.5% |
| R-4 | 1,777 | 1,391 | 94.8% | 2.0% | 0.1% | 0.3% | $76k | 20.8% | 14.5% | 20.0% | 86.7% | 17.6% | 0.3% |
| Spring Creek East Voting District | 3,845 | 2,931 | 90.5% | 4.1% | 0.3% | 0.2% | $60k | 12.8% | 14.1% | 22.3% | 65.6% | 12.1% | 0.1% |
| Spring Creek West Voting District | 3,796 | 2,928 | 91.5% | 0.7% | 0.9% | 1.1% | $53k | 18.5% | 16.6% | 20.7% | 61.8% | 9.3% | 0.5% |
Madison: 7 precincts
| Precinct | Population | Voting-age pop. | % White non-Hisp. | % Hispanic | % Black | % Asian | Median income* | % Bachelor's+ | % 18-29 (of adults) | % 65+ | % Homeowners | % Below poverty | % Spanish at home (adults) |
|---|---|---|---|---|---|---|---|---|---|---|---|---|---|
| Castor Voting District | 5,448 | 4,002 | 93.2% | 2.1% | 0.3% | 0.4% | $56k | 17.4% | 16.9% | 18.8% | 72.7% | 15.1% | 1.3% |
| Central Voting District | 1,295 | 1,143 | 91.1% | 0.6% | 0.0% | 0.5% | $71k | 11.6% | 18.4% | 21.4% | 75.8% | 12.9% | 0.3% |
| Fredericktown Ward 1 | 829 | 748 | 98.1% | 0.0% | 0.2% | 0.1% | $58k | 25.0% | 17.8% | 25.0% | 79.9% | 1.6% | 0.0% |
| Fredericktown Ward 2 | 724 | 438 | 94.9% | 0.0% | 0.0% | 0.1% | $60k | 20.8% | 16.2% | 5.7% | 40.5% | 35.2% | 0.0% |
| Fredericktown Ward 3 | 879 | 660 | 88.3% | 8.7% | 0.9% | 0.2% | $39k | 14.2% | 11.5% | 28.4% | 46.6% | 19.2% | 5.2% |
| Marquand Voting District | 1,035 | 857 | 92.8% | 2.3% | 0.0% | 0.0% | $48k | 9.3% | 20.4% | 25.5% | 74.0% | 19.7% | 0.0% |
| St. Francis Voting District | 2,434 | 1,822 | 88.9% | 5.4% | 0.3% | 0.2% | $81k | 16.1% | 13.4% | 15.9% | 95.1% | 2.5% | 0.0% |
Douglas: 24 precincts
| Precinct | Population | Voting-age pop. | % White non-Hisp. | % Hispanic | % Black | % Asian | Median income* | % Bachelor's+ | % 18-29 (of adults) | % 65+ | % Homeowners | % Below poverty | % Spanish at home (adults) |
|---|---|---|---|---|---|---|---|---|---|---|---|---|---|
| Benton No. 1 Voting District | 1,649 | 1,239 | 96.2% | 1.9% | 0.3% | 0.4% | $52k | 12.2% | 17.1% | 22.8% | 68.9% | 12.5% | 0.1% |
| Benton No. 2 Voting District | 1,027 | 751 | 95.1% | 1.0% | 1.9% | 0.1% | $43k | 16.3% | 19.4% | 20.2% | 55.6% | 21.8% | 0.0% |
| Boone Voting District | 1,165 | 897 | 92.3% | 3.2% | 1.0% | 0.7% | $38k | 16.4% | 21.1% | 23.0% | 72.9% | 25.9% | 0.0% |
| Brown Voting District | 314 | 221 | 90.5% | 0.9% | 2.0% | 0.0% | $64k | 9.9% | 7.9% | 16.8% | 80.3% | 7.2% | 0.0% |
| Brush Creek Voting District | 225 | 200 | 89.1% | 4.2% | 3.1% | 0.0% | $43k | 11.4% | 12.3% | 32.2% | 96.7% | 15.4% | 0.0% |
| Bryan Voting District | 175 | 134 | 93.9% | 0.1% | 0.0% | 0.0% | $43k | 11.0% | 10.8% | 35.6% | 86.8% | 13.6% | 0.0% |
| Buchanan Voting District | 461 | 328 | 87.3% | 7.6% | 0.0% | 0.0% | $45k | 17.5% | 8.1% | 21.1% | 88.2% | 24.3% | 1.1% |
| Campbell Voting District | 619 | 439 | 87.0% | 7.8% | 0.0% | 0.0% | $45k | 17.6% | 7.9% | 21.0% | 88.1% | 24.7% | 1.0% |
| Cass Voting District | 313 | 221 | 90.3% | 1.1% | 2.1% | 0.0% | $64k | 9.5% | 8.2% | 17.2% | 80.8% | 7.2% | 0.0% |
| Champion Voting District | 223 | 197 | 89.3% | 4.1% | 3.0% | 0.0% | $43k | 11.3% | 12.3% | 32.3% | 96.3% | 15.3% | 0.0% |
| Clay Voting District | 318 | 224 | 90.3% | 0.9% | 2.0% | 0.0% | $65k | 9.7% | 8.1% | 17.2% | 80.5% | 7.1% | 0.0% |
| Clinton Voting District | 172 | 133 | 94.0% | 0.0% | 0.0% | 0.0% | $48k | 11.0% | 10.8% | 35.6% | 86.6% | 13.6% | 0.0% |
| Findley Voting District | 803 | 683 | 90.6% | 0.3% | 1.0% | 0.0% | $53k | 16.8% | 14.3% | 33.0% | 80.3% | 19.4% | 0.1% |
| Jackson Voting District | 254 | 209 | 89.5% | 3.2% | 2.8% | 0.0% | $49k | 10.8% | 11.1% | 26.6% | 91.9% | 12.4% | 0.0% |
| Lincoln Voting District | 543 | 414 | 96.8% | 0.0% | 0.0% | 0.0% | $51k | 15.4% | 13.9% | 25.8% | 92.9% | 11.9% | 2.0% |
| McKinley Voting District | 176 | 137 | 93.6% | 0.3% | 0.3% | 0.0% | $43k | 11.0% | 11.0% | 35.3% | 87.6% | 13.7% | 0.0% |
| McMurtrey Voting District | 305 | 227 | 90.9% | 1.3% | 2.0% | 0.0% | $58k | 12.0% | 8.2% | 19.9% | 84.0% | 9.9% | 0.0% |
| Miller Voting District | 813 | 695 | 89.8% | 0.4% | 1.1% | 0.0% | $52k | 16.9% | 14.4% | 32.8% | 78.9% | 20.7% | 0.0% |
| Richland Voting District | 221 | 195 | 89.2% | 4.1% | 3.0% | 0.0% | $43k | 11.3% | 12.3% | 32.3% | 96.4% | 15.3% | 0.0% |
| Spencer Voting District | 415 | 308 | 96.1% | 1.2% | 0.0% | 0.0% | $49k | 15.8% | 13.3% | 23.7% | 91.8% | 13.5% | 2.0% |
| Spring Creek Voting District | 614 | 438 | 87.2% | 7.6% | 0.0% | 0.0% | $45k | 17.8% | 7.8% | 21.2% | 88.1% | 24.7% | 1.0% |
| Walls Voting District | 400 | 340 | 96.3% | 0.4% | 0.1% | 0.0% | $42k | 26.0% | 4.3% | 27.5% | 88.5% | 23.4% | 0.0% |
| Washington Voting District | 553 | 410 | 95.8% | 1.4% | 0.0% | 0.0% | $49k | 15.7% | 13.1% | 23.7% | 91.7% | 13.9% | 2.0% |
| Wood Voting District | 187 | 142 | 93.5% | 0.2% | 0.3% | 0.0% | $64k | 10.8% | 10.5% | 32.9% | 85.7% | 12.7% | 0.0% |
Mississippi: 22 precincts
| Precinct | Population | Voting-age pop. | % White non-Hisp. | % Hispanic | % Black | % Asian | Median income* | % Bachelor's+ | % 18-29 (of adults) | % 65+ | % Homeowners | % Below poverty | % Spanish at home (adults) |
|---|---|---|---|---|---|---|---|---|---|---|---|---|---|
| Anniston Rural Voting District | 186 | 155 | 95.0% | 0.7% | 0.0% | 1.4% | $68k | 11.3% | 22.5% | 21.4% | 81.6% | 13.4% | 0.3% |
| Anniston Ward 1 | 5 | 4 | 95.4% | 0.8% | 0.0% | 1.4% | $67k | 10.7% | 22.8% | 21.5% | 81.6% | 13.5% | 0.5% |
| Anniston Ward 2 | 10 | 8 | 95.4% | 0.7% | 0.0% | 1.4% | $67k | 10.8% | 22.7% | 21.5% | 81.4% | 13.6% | 0.4% |
| Bertrand Rural Voting District | 1,444 | 1,312 | 67.8% | 3.2% | 21.9% | 0.0% | $66k | 11.4% | 14.9% | 18.2% | 81.2% | 13.3% | 0.7% |
| Bertrand Ward 1 | 36 | 31 | 72.2% | 5.7% | 9.4% | 0.0% | $59k | 11.1% | 18.6% | 21.6% | 81.1% | 18.8% | 0.0% |
| Bertrand Ward 2 | 32 | 27 | 72.2% | 5.7% | 9.5% | 0.0% | $59k | 11.1% | 18.6% | 21.6% | 81.1% | 18.7% | 0.0% |
| Charleston 1A Voting District | 378 | 271 | 65.4% | 0.0% | 22.2% | 0.0% | $64k | 21.2% | 16.8% | 24.9% | 82.9% | 10.2% | 0.0% |
| Charleston 1B Voting District | 155 | 111 | 63.2% | 0.0% | 25.0% | 0.0% | $64k | 20.6% | 18.2% | 24.2% | 79.2% | 11.4% | 0.0% |
| Charleston 2 Voting District | 81 | 59 | 34.2% | 0.0% | 64.4% | 0.0% | 9.4% | 37.2% | 15.4% | 27.0% | 30.1% | 0.0% | |
| Charleston 3 Voting District | 102 | 73 | 11.9% | 1.6% | 69.3% | 0.0% | $14k | 3.7% | 10.4% | 7.3% | 11.0% | 63.6% | 7.6% |
| Charleston 4 Voting District | 204 | 147 | 44.1% | 0.2% | 37.5% | 11.6% | $41k | 14.3% | 29.4% | 24.0% | 54.4% | 7.1% | 0.7% |
| Charleston Rural Voting District | 3,797 | 2,983 | 49.5% | 0.8% | 39.6% | 1.0% | $48k | 13.0% | 17.6% | 17.4% | 53.5% | 24.8% | 1.7% |
| Dorena Voting District | 280 | 173 | 78.9% | 0.0% | 0.0% | 0.0% | $85k | 33.8% | 12.0% | 14.4% | 90.0% | 4.7% | 0.0% |
| East Prairie Rural Voting District | 2,978 | 2,313 | 92.6% | 0.2% | 1.1% | 0.4% | $50k | 14.8% | 23.5% | 21.9% | 64.1% | 16.6% | 0.1% |
| East Prairie Ward 1 | 241 | 200 | 89.1% | 0.0% | 2.5% | 0.0% | $34k | 15.0% | 18.5% | 27.5% | 57.4% | 11.4% | 0.0% |
| East Prairie Ward 2 | 726 | 515 | 85.9% | 0.0% | 2.3% | 0.0% | $36k | 12.4% | 8.9% | 17.5% | 50.0% | 21.0% | 0.0% |
| East Prairie Ward 3 | 538 | 368 | 95.3% | 0.0% | 0.7% | 0.0% | $55k | 16.3% | 31.7% | 14.9% | 49.9% | 26.5% | 0.0% |
| Wilson City Voting District | 0 | 0 | 55.6% | 5.6% | 16.7% | 0.0% | $30k | 16.7% | 15.4% | 11.1% | 75.0% | 44.4% | 0.0% |
| Wolf Island Voting District | 552 | 350 | 77.2% | 0.2% | 2.0% | 0.0% | $81k | 31.6% | 12.2% | 14.4% | 89.1% | 7.1% | 0.2% |
| Wyatt Rural Voting District | 181 | 127 | 57.9% | 2.9% | 18.1% | 0.0% | $32k | 15.8% | 15.1% | 13.8% | 80.2% | 42.5% | 2.2% |
| Wyatt Ward 1 | 0 | 0 | 59.3% | 3.7% | 18.5% | 0.0% | $34k | 16.7% | 15.8% | 14.8% | 81.8% | 44.4% | 0.0% |
| Wyatt Ward 2 | 4 | 3 | 57.9% | 3.0% | 18.2% | 0.0% | $32k | 15.6% | 15.0% | 13.8% | 80.6% | 42.9% | 2.1% |
Wayne: 20 precincts
| Precinct | Population | Voting-age pop. | % White non-Hisp. | % Hispanic | % Black | % Asian | Median income* | % Bachelor's+ | % 18-29 (of adults) | % 65+ | % Homeowners | % Below poverty | % Spanish at home (adults) |
|---|---|---|---|---|---|---|---|---|---|---|---|---|---|
| Brunot Voting District | 104 | 86 | 98.8% | 0.0% | 0.0% | 0.0% | $63k | 20.2% | 13.3% | 28.7% | 84.5% | 3.9% | 1.4% |
| Cascade Voting District | 56 | 51 | 100.0% | 0.0% | 0.0% | 0.0% | $43k | 17.0% | 0.0% | 47.9% | 93.6% | 9.4% | 0.0% |
| Chaonia Voting District | 172 | 150 | 89.5% | 0.0% | 0.0% | 0.0% | $67k | 3.8% | 15.4% | 22.0% | 95.2% | 6.4% | 0.0% |
| Clubb Voting District | 261 | 216 | 95.7% | 3.5% | 0.4% | 0.0% | $42k | 11.5% | 6.3% | 35.3% | 87.2% | 21.7% | 0.3% |
| Coldwater Voting District | 112 | 102 | 99.9% | 0.0% | 0.0% | 0.0% | $44k | 17.3% | 1.1% | 46.3% | 93.0% | 8.9% | 0.1% |
| Cool Springs Voting District | 159 | 137 | 89.8% | 0.0% | 0.0% | 0.0% | $65k | 5.1% | 14.4% | 22.8% | 94.3% | 6.5% | 0.0% |
| Greenville Voting District | 351 | 271 | 95.6% | 3.3% | 0.3% | 0.0% | $54k | 10.3% | 7.4% | 19.6% | 84.9% | 14.5% | 1.2% |
| Hiram Voting District | 116 | 108 | 95.5% | 0.7% | 0.1% | 0.0% | $44k | 8.6% | 9.2% | 38.4% | 93.6% | 12.2% | 0.0% |
| Lowndes Voting District | 262 | 242 | 94.9% | 0.3% | 0.0% | 0.0% | $48k | 6.6% | 11.1% | 32.9% | 94.7% | 9.5% | 0.3% |
| McGee Voting District | 400 | 380 | 93.9% | 0.0% | 0.0% | 0.0% | $53k | 4.1% | 12.0% | 32.1% | 86.3% | 14.7% | 0.0% |
| Mill Spring Voting District | 1,004 | 735 | 91.9% | 3.4% | 0.0% | 0.0% | $49k | 16.5% | 15.9% | 21.8% | 72.1% | 32.5% | 0.0% |
| Patterson Voting District | 688 | 594 | 93.8% | 4.4% | 0.7% | 0.0% | $62k | 15.8% | 6.4% | 39.6% | 73.9% | 10.6% | 0.6% |
| Peach Tree Voting District | 412 | 334 | 95.8% | 1.2% | 0.7% | 0.0% | $56k | 18.0% | 14.5% | 26.4% | 69.0% | 20.5% | 0.6% |
| Piedmont Ward No. 1 | 1,926 | 1,394 | 95.5% | 0.2% | 0.0% | 1.0% | $39k | 16.2% | 18.6% | 21.1% | 64.6% | 45.1% | 0.0% |
| Piedmont Ward No. 2 | 1,543 | 1,235 | 94.4% | 0.1% | 0.9% | 0.8% | $45k | 18.2% | 18.6% | 22.2% | 61.3% | 28.5% | 0.0% |
| Shook Voting District | 350 | 315 | 94.8% | 0.4% | 0.0% | 0.0% | $57k | 6.1% | 10.4% | 26.1% | 84.2% | 13.7% | 0.4% |
| Silva Voting District | 766 | 571 | 92.1% | 6.2% | 0.7% | 0.0% | $44k | 5.5% | 14.1% | 22.9% | 76.9% | 32.0% | 0.7% |
| Smith Mill Voting District | 250 | 187 | 96.9% | 1.4% | 0.1% | 0.0% | $50k | 11.1% | 11.3% | 20.5% | 74.1% | 30.9% | 0.6% |
| Wappapello Voting District | 1,270 | 1,086 | 80.6% | 0.2% | 1.3% | 0.0% | $59k | 5.9% | 9.9% | 22.5% | 78.9% | 20.8% | 0.7% |
| Williamsville Voting District | 669 | 542 | 89.0% | 1.1% | 0.0% | 0.0% | $47k | 17.9% | 9.9% | 26.2% | 80.4% | 19.2% | 0.0% |
Ripley: 8 precincts
| Precinct | Population | Voting-age pop. | % White non-Hisp. | % Hispanic | % Black | % Asian | Median income* | % Bachelor's+ | % 18-29 (of adults) | % 65+ | % Homeowners | % Below poverty | % Spanish at home (adults) |
|---|---|---|---|---|---|---|---|---|---|---|---|---|---|
| Doniphan P1 & Doniphan P2 | 4,191 | 3,191 | 89.7% | 2.7% | 0.4% | 0.2% | $38k | 12.3% | 18.8% | 14.9% | 70.8% | 30.6% | 1.4% |
| Flatwoods & Johnson P2 & Washington | 1,273 | 979 | 93.8% | 1.1% | 0.0% | 0.5% | $45k | 15.9% | 21.7% | 21.9% | 89.3% | 21.5% | 1.2% |
| Gatewood & Union Voting District | 588 | 443 | 95.7% | 0.0% | 0.0% | 0.0% | $37k | 8.5% | 11.8% | 22.6% | 78.7% | 12.9% | 0.0% |
| Harris & Varner P1 Voting District | 965 | 666 | 90.1% | 0.6% | 0.8% | 0.0% | $46k | 12.4% | 7.9% | 21.2% | 82.0% | 24.4% | 0.0% |
| Jordan/Johnson P1 | 847 | 664 | 94.9% | 1.8% | 0.0% | 1.6% | $49k | 13.8% | 6.9% | 37.2% | 89.4% | 25.9% | 3.7% |
| Poynor & Current River & West Doniphan Voting District | 822 | 578 | 97.8% | 0.2% | 0.0% | 0.0% | $37k | 18.2% | 16.9% | 24.4% | 88.5% | 12.5% | 0.1% |
| Shirley & Kelly & Pine Voting District | 827 | 733 | 96.1% | 0.0% | 0.0% | 0.0% | $45k | 11.2% | 18.1% | 16.0% | 87.9% | 22.4% | 0.0% |
| Thomas & Varner P2 Voting District | 1,175 | 854 | 93.1% | 0.6% | 0.6% | 0.0% | $45k | 8.3% | 9.8% | 20.4% | 72.1% | 24.0% | 0.0% |
Bollinger: 9 precincts
| Precinct | Population | Voting-age pop. | % White non-Hisp. | % Hispanic | % Black | % Asian | Median income* | % Bachelor's+ | % 18-29 (of adults) | % 65+ | % Homeowners | % Below poverty | % Spanish at home (adults) |
|---|---|---|---|---|---|---|---|---|---|---|---|---|---|
| Drum-Dongola Voting District | 589 | 488 | 91.9% | 0.7% | 0.0% | 0.2% | $75k | 16.6% | 13.1% | 19.6% | 85.3% | 4.8% | 0.0% |
| Hurricane Voting District | 535 | 441 | 94.8% | 3.4% | 0.1% | 0.0% | $82k | 5.5% | 1.7% | 41.6% | 85.0% | 23.0% | 0.0% |
| Lutesville Voting District | 1,765 | 1,317 | 91.2% | 4.1% | 1.2% | 0.1% | $57k | 13.3% | 22.0% | 16.9% | 70.1% | 21.8% | 0.8% |
| Marble Hill Voting District | 2,215 | 1,649 | 91.8% | 2.0% | 1.5% | 0.0% | $57k | 12.1% | 20.1% | 16.3% | 81.3% | 13.3% | 0.3% |
| Patton Voting District | 1,457 | 1,230 | 96.1% | 1.0% | 0.3% | 0.0% | $80k | 10.3% | 14.1% | 28.6% | 84.0% | 9.2% | 0.5% |
| Scopus Voting District | 731 | 645 | 87.6% | 1.3% | 2.4% | 0.0% | $94k | 34.6% | 6.1% | 19.9% | 87.0% | 11.5% | 0.0% |
| Sedgewickville Voting District | 1,470 | 1,090 | 97.3% | 0.1% | 0.6% | 0.0% | $63k | 15.1% | 13.6% | 19.2% | 85.8% | 3.5% | 0.0% |
| Sitze Voting District | 712 | 560 | 95.7% | 1.0% | 0.3% | 0.0% | $49k | 12.3% | 12.9% | 24.0% | 87.4% | 24.3% | 0.4% |
| Zalma Voting District | 1,095 | 850 | 96.5% | 0.3% | 0.1% | 0.1% | $60k | 9.5% | 12.0% | 20.3% | 87.0% | 15.6% | 0.2% |
Iron: 9 precincts
| Precinct | Population | Voting-age pop. | % White non-Hisp. | % Hispanic | % Black | % Asian | Median income* | % Bachelor's+ | % 18-29 (of adults) | % 65+ | % Homeowners | % Below poverty | % Spanish at home (adults) |
|---|---|---|---|---|---|---|---|---|---|---|---|---|---|
| Annapolis Voting District | 1,202 | 967 | 94.7% | 2.0% | 0.6% | 0.0% | $62k | 14.8% | 11.1% | 20.4% | 78.7% | 22.8% | 0.7% |
| Arcadia Voting District | 2,369 | 1,939 | 90.7% | 3.2% | 1.2% | 0.0% | $60k | 22.8% | 10.6% | 28.7% | 77.3% | 20.2% | 0.9% |
| Belleview Voting District | 1,009 | 803 | 92.9% | 1.0% | 0.0% | 4.6% | $48k | 20.0% | 20.9% | 23.5% | 70.8% | 28.8% | 0.7% |
| Des Arc Voting District | 180 | 152 | 99.2% | 0.0% | 0.0% | 0.0% | $78k | 16.6% | 19.2% | 16.0% | 80.1% | 11.6% | 0.7% |
| Ghermanville Voting District | 498 | 412 | 90.4% | 0.7% | 0.1% | 2.5% | $46k | 12.6% | 21.7% | 21.1% | 70.7% | 19.7% | 0.4% |
| Ironton Voting District | 1,958 | 1,395 | 91.5% | 2.0% | 0.6% | 0.9% | $53k | 26.5% | 17.1% | 15.6% | 71.9% | 12.5% | 0.3% |
| Pilot Knob Voting District | 765 | 642 | 89.6% | 1.2% | 0.2% | 1.1% | $47k | 9.2% | 17.9% | 24.4% | 76.5% | 10.8% | 0.1% |
| Viburnum Voting District | 1,348 | 1,052 | 90.0% | 3.4% | 0.0% | 1.5% | $40k | 14.7% | 15.5% | 21.9% | 74.5% | 24.2% | 1.1% |
| Vulcan Voting District | 148 | 125 | 99.2% | 0.0% | 0.0% | 0.0% | $78k | 16.6% | 19.2% | 16.0% | 80.1% | 11.6% | 0.6% |
Ozark: 10 precincts
| Precinct | Population | Voting-age pop. | % White non-Hisp. | % Hispanic | % Black | % Asian | Median income* | % Bachelor's+ | % 18-29 (of adults) | % 65+ | % Homeowners | % Below poverty | % Spanish at home (adults) |
|---|---|---|---|---|---|---|---|---|---|---|---|---|---|
| Barren Fork Voting District | 710 | 584 | 94.8% | 0.8% | 0.2% | 0.0% | $53k | 22.4% | 7.8% | 32.2% | 81.3% | 22.8% | 0.1% |
| Bayou Voting District | 1,394 | 1,000 | 98.4% | 0.7% | 0.0% | 0.0% | $56k | 11.0% | 10.0% | 24.2% | 85.8% | 13.0% | 2.3% |
| Big Creek Voting District | 1,289 | 1,159 | 93.8% | 0.2% | 0.0% | 0.0% | $41k | 9.2% | 15.1% | 29.9% | 89.6% | 17.4% | 0.0% |
| Bridges Voting District | 1,986 | 1,655 | 92.6% | 3.1% | 1.1% | 0.0% | $41k | 15.0% | 6.3% | 32.4% | 73.3% | 29.2% | 0.0% |
| Dawt Voting District | 411 | 296 | 95.2% | 2.2% | 0.0% | 0.0% | $44k | 15.4% | 10.7% | 28.9% | 89.5% | 18.6% | 2.3% |
| Jackson Voting District | 215 | 173 | 93.8% | 0.9% | 0.0% | 0.0% | $69k | 31.0% | 2.6% | 37.7% | 75.9% | 6.0% | 0.4% |
| Lick Creek Voting District | 341 | 324 | 89.9% | 5.5% | 0.0% | 0.0% | $33k | 12.3% | 0.0% | 44.2% | 87.7% | 28.1% | 0.0% |
| Pontiac Voting District | 201 | 172 | 95.4% | 0.8% | 0.4% | 0.0% | $46k | 18.7% | 10.6% | 33.5% | 82.8% | 27.6% | 0.0% |
| Richland Voting District | 1,397 | 1,063 | 90.2% | 4.7% | 0.0% | 0.0% | $58k | 19.0% | 24.2% | 24.5% | 77.7% | 19.3% | 4.1% |
| Thornfield Voting District | 921 | 754 | 93.5% | 1.2% | 0.0% | 0.0% | $45k | 17.0% | 11.6% | 26.7% | 87.2% | 27.1% | 0.3% |
Oregon: 15 precincts
| Precinct | Population | Voting-age pop. | % White non-Hisp. | % Hispanic | % Black | % Asian | Median income* | % Bachelor's+ | % 18-29 (of adults) | % 65+ | % Homeowners | % Below poverty | % Spanish at home (adults) |
|---|---|---|---|---|---|---|---|---|---|---|---|---|---|
| Big Apple Voting District | 682 | 518 | 91.5% | 1.4% | 0.0% | 0.7% | $57k | 9.3% | 15.4% | 27.4% | 74.8% | 23.2% | 0.9% |
| Cedar Bluff Voting District | 140 | 105 | 95.9% | 0.9% | 0.0% | 0.0% | $26k | 6.4% | 20.2% | 11.3% | 55.6% | 25.1% | 0.0% |
| Couch Voting District | 471 | 374 | 94.2% | 2.9% | 0.0% | 0.2% | $92k | 8.1% | 18.7% | 28.3% | 92.9% | 6.4% | 0.2% |
| Highland Voting District | 622 | 477 | 91.8% | 1.5% | 0.0% | 0.8% | $57k | 9.0% | 15.7% | 26.6% | 76.9% | 22.6% | 0.9% |
| Jeff Voting District | 261 | 211 | 93.4% | 3.6% | 0.0% | 0.0% | $98k | 8.3% | 17.1% | 31.2% | 91.1% | 5.2% | 0.5% |
| Jobe & Billmore Voting District | 212 | 159 | 96.0% | 1.3% | 0.0% | 0.0% | $34k | 6.2% | 20.1% | 14.3% | 59.9% | 22.2% | 0.0% |
| Johnson & Ozark Voting District | 236 | 183 | 92.5% | 0.7% | 0.0% | 0.1% | $35k | 12.6% | 18.3% | 13.7% | 59.4% | 22.3% | 0.0% |
| King Voting District | 58 | 54 | 74.4% | 0.0% | 0.0% | 0.0% | $70k | 37.1% | 8.8% | 25.8% | 66.8% | 11.3% | 0.0% |
| Moore & Blackpond Voting District | 484 | 420 | 97.9% | 1.0% | 0.0% | 0.3% | $29k | 7.7% | 5.0% | 33.6% | 85.8% | 40.8% | 0.0% |
| Myrtle Voting District | 167 | 126 | 95.9% | 1.3% | 0.0% | 0.0% | $34k | 6.2% | 20.1% | 14.5% | 60.3% | 22.0% | 0.0% |
| Piney No. 1 Voting District | 1,000 | 771 | 89.8% | 2.1% | 0.5% | 1.1% | $54k | 12.1% | 18.3% | 19.1% | 74.9% | 13.7% | 0.3% |
| Piney No. 2 Voting District | 921 | 707 | 91.6% | 1.1% | 0.3% | 1.3% | $57k | 11.6% | 20.8% | 16.8% | 81.6% | 13.9% | 0.0% |
| Thayer No. 1 Voting District | 1,596 | 1,246 | 92.7% | 2.1% | 0.0% | 0.1% | $52k | 19.9% | 13.1% | 26.4% | 72.7% | 20.5% | 0.9% |
| Thayer No. 2 Voting District | 1,568 | 1,088 | 93.4% | 0.7% | 0.0% | 0.1% | $33k | 12.4% | 14.5% | 19.0% | 69.7% | 41.4% | 0.2% |
| Woodside Voting District | 254 | 226 | 90.8% | 0.7% | 0.0% | 0.2% | $40k | 16.7% | 5.5% | 31.9% | 79.8% | 32.7% | 0.0% |
Shannon: 10 precincts
| Precinct | Population | Voting-age pop. | % White non-Hisp. | % Hispanic | % Black | % Asian | Median income* | % Bachelor's+ | % 18-29 (of adults) | % 65+ | % Homeowners | % Below poverty | % Spanish at home (adults) |
|---|---|---|---|---|---|---|---|---|---|---|---|---|---|
| Bartlett Voting District | 578 | 443 | 91.9% | 0.8% | 0.1% | 0.1% | $56k | 11.9% | 15.8% | 20.0% | 82.0% | 16.1% | 0.6% |
| Birch Tree Voting District | 908 | 691 | 93.3% | 0.2% | 0.0% | 0.1% | $59k | 13.0% | 13.9% | 16.2% | 80.6% | 16.6% | 1.6% |
| Delaware Voting District | 540 | 368 | 96.7% | 0.1% | 0.1% | 0.2% | $69k | 7.9% | 14.4% | 11.5% | 91.2% | 11.4% | 0.0% |
| Eminence Voting District | 1,763 | 1,366 | 90.2% | 0.5% | 0.4% | 0.5% | $49k | 13.2% | 15.1% | 24.9% | 72.1% | 30.2% | 0.0% |
| Montier I & II Voting District | 557 | 376 | 97.9% | 0.1% | 0.0% | 0.2% | $68k | 7.0% | 15.3% | 10.8% | 95.4% | 9.2% | 0.0% |
| Moore Voting District | 133 | 121 | 92.5% | 1.8% | 0.0% | 4.5% | $56k | 16.2% | 7.6% | 44.8% | 91.2% | 11.2% | 0.0% |
| Newton Voting District | 297 | 245 | 92.2% | 1.0% | 0.2% | 2.0% | $65k | 18.9% | 6.5% | 32.3% | 85.2% | 13.3% | 0.0% |
| Spring Creek Voting District | 213 | 168 | 88.1% | 1.5% | 0.0% | 0.0% | $60k | 18.1% | 18.9% | 25.1% | 85.2% | 20.2% | 0.2% |
| Spring Valley Voting District | 563 | 429 | 97.2% | 0.2% | 0.0% | 0.3% | $77k | 23.5% | 1.3% | 23.0% | 93.1% | 4.4% | 0.0% |
| Winona Voting District | 1,628 | 1,345 | 89.1% | 1.4% | 0.3% | 0.2% | $44k | 9.8% | 15.4% | 27.9% | 73.0% | 16.9% | 0.2% |
Reynolds: 13 precincts
| Precinct | Population | Voting-age pop. | % White non-Hisp. | % Hispanic | % Black | % Asian | Median income* | % Bachelor's+ | % 18-29 (of adults) | % 65+ | % Homeowners | % Below poverty | % Spanish at home (adults) |
|---|---|---|---|---|---|---|---|---|---|---|---|---|---|
| Black Voting District | 279 | 231 | 91.3% | 1.2% | 2.7% | 0.1% | $47k | 11.3% | 14.7% | 26.8% | 85.4% | 12.2% | 0.0% |
| Bluffview Voting District | 413 | 369 | 91.1% | 0.6% | 0.4% | 0.5% | $40k | 12.5% | 7.8% | 22.9% | 85.1% | 18.3% | 0.0% |
| Bunker Voting District | 681 | 532 | 91.0% | 0.8% | 2.3% | 0.1% | $48k | 12.4% | 16.3% | 24.8% | 81.8% | 14.4% | 0.0% |
| Centerville Voting District | 355 | 291 | 89.9% | 1.3% | 1.7% | 0.6% | $44k | 14.8% | 14.1% | 25.4% | 81.8% | 14.3% | 0.0% |
| Corridon/Reynolds Voting District | 270 | 194 | 91.0% | 0.2% | 1.3% | 0.0% | $47k | 13.7% | 19.4% | 20.9% | 71.8% | 16.9% | 0.0% |
| Dagonia Voting District | 392 | 286 | 91.6% | 0.3% | 1.0% | 0.0% | $46k | 12.8% | 19.2% | 20.2% | 68.8% | 15.8% | 0.0% |
| Ellington No. 1 Voting District | 865 | 707 | 91.0% | 3.8% | 2.1% | 0.0% | $42k | 19.3% | 16.2% | 24.8% | 83.1% | 23.6% | 0.4% |
| Ellington No. 2 Voting District | 1,291 | 1,041 | 92.7% | 1.9% | 0.8% | 0.0% | $42k | 12.9% | 17.0% | 21.1% | 70.4% | 15.3% | 0.1% |
| Garwood Voting District | 232 | 207 | 91.6% | 1.1% | 0.6% | 0.3% | $40k | 12.8% | 8.1% | 23.0% | 85.7% | 19.9% | 0.1% |
| Lesterville Voting District | 741 | 605 | 87.7% | 1.4% | 1.2% | 1.1% | $43k | 19.0% | 12.8% | 25.9% | 83.5% | 16.5% | 0.1% |
| Oates Voting District | 145 | 120 | 91.3% | 1.2% | 2.7% | 0.1% | $47k | 11.3% | 14.6% | 26.7% | 85.2% | 12.3% | 0.0% |
| Redford Voting District | 215 | 176 | 90.5% | 4.2% | 2.4% | 0.0% | $42k | 20.7% | 16.0% | 25.6% | 85.8% | 25.4% | 0.5% |
| Webb Creek Voting District | 156 | 128 | 90.7% | 4.0% | 2.3% | 0.0% | $42k | 20.0% | 15.4% | 25.4% | 85.8% | 25.1% | 0.5% |
Carter: 7 precincts
| Precinct | Population | Voting-age pop. | % White non-Hisp. | % Hispanic | % Black | % Asian | Median income* | % Bachelor's+ | % 18-29 (of adults) | % 65+ | % Homeowners | % Below poverty | % Spanish at home (adults) |
|---|---|---|---|---|---|---|---|---|---|---|---|---|---|
| Colemansville Voting District | 531 | 448 | 97.4% | 1.1% | 0.2% | 0.0% | $46k | 10.4% | 15.1% | 26.2% | 70.8% | 14.5% | 0.9% |
| Eastwood Voting District | 153 | 88 | 82.9% | 0.8% | 0.0% | 0.5% | $39k | 23.1% | 1.9% | 23.2% | 40.2% | 11.7% | 0.0% |
| Ellsinore Voting District | 1,099 | 848 | 89.3% | 6.4% | 1.2% | 0.0% | $61k | 10.7% | 20.5% | 18.0% | 56.9% | 12.2% | 6.3% |
| Fremont Voting District | 558 | 391 | 85.6% | 0.2% | 0.0% | 0.2% | $52k | 14.1% | 17.6% | 20.3% | 59.9% | 20.7% | 0.0% |
| Grandin Voting District | 783 | 641 | 92.8% | 3.4% | 0.5% | 0.0% | $61k | 7.5% | 20.7% | 20.2% | 72.7% | 12.6% | 2.7% |
| Hunter Voting District | 521 | 431 | 93.5% | 2.7% | 0.4% | 0.0% | $60k | 6.8% | 20.7% | 20.7% | 75.9% | 12.7% | 2.0% |
| Van Buren Voting District | 1,656 | 1,165 | 96.0% | 0.1% | 0.1% | 0.0% | $29k | 9.6% | 12.3% | 20.6% | 50.4% | 36.1% | 0.0% |
*Median income is approximate (see note above). ACS 2020-2024 5-year.
Nonpartisan voter information. GOTV Polling does not endorse any candidate.