
Mississippi's 1st Congressional District
U.S. House · Mississippi · District 1 · General election: Tuesday, November 3, 2026
Candidates on the November 3 ballot
- Johnny BaucomLibertarian
- Cliff JohnsonDemocratic
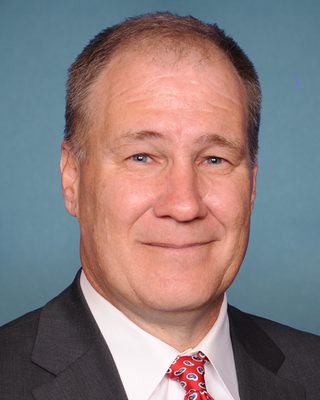 Trent KellyRepublicanPhoto: U.S. Congress
Source: Mississippi Secretary of State, Candidate Qualifying List, November 3, 2026 General Election, certified list (list retrieved 2026-10-30; retrieved 2026-10-30). Order of names does not reflect ballot order. Incumbent tags appear only where the official list marks incumbents. Photos come from the Candidate Alerts database where one is on file; otherwise initials are shown.
Federal campaign finance filings for this seat: FEC election page (FEC registration is not the same as ballot qualification).
Certified candidates
- Trent Kelly RepublicanIncumbent @RepTrentKelly
- Cliff Johnson Democratic
Certified candidate list from Candidate Alerts, as of 2026-09-24, based on Mississippi Secretary of State. Includes candidates the database marks as on the November 3 ballot. Incumbent tags here follow the database.
Past election results
Demographics
2020 Census demographics by district are not yet published in this data set.
0 of 404 precincts are above 50%, and 0 are above 25%. Source: Census American Community Survey 2020-2024 5-year block groups, allocated to current precinct shapes by area.
Poll status
Map
Share of adults (18+) who speak Spanish at home, by precinct. Census ACS 2020-2024 5-year estimates on the current precinct layer. Hover a precinct for its value.
District shown in red: U.S. Census Bureau cartographic boundary file for the 119th Congress (cb_2024_us_cd119_500k). These are the lines in effect for 2026 in this state per the Candidate Alerts district registry.
Precinct map: past elections and demographics
Choose a layer above. Hover a precinct for its values.
Precinct results
Precinct demographics
Demographics are Census American Community Survey (ACS) 2020-2024 5-year estimates for block groups, assigned to precincts by area share. They describe the resident population, not registered or likely voters, and include non-citizens. ACS margins of error are not shown; small precincts carry large error. Area weighting assumes people are spread evenly within each block group, so large rural precincts are the least reliable. Median income is a household-weighted average of block-group medians, an approximation.
| Area | Population | Voting-age pop. | % White non-Hisp. | % Hispanic | % Black | % Asian | Median income* | % Bachelor's+ | % 18-29 (of adults) | % 65+ | % Homeowners | % Below poverty | % Spanish at home (adults) |
|---|---|---|---|---|---|---|---|---|---|---|---|---|---|
| District | 746,019 | 571,840 | 63.5% | 4.0% | 27.8% | 0.8% | $69k | 24.6% | 21.3% | 16.5% | 73.4% | 15.5% | 2.7% |
| DeSoto (in district) | 190,713 | 142,977 | 56.4% | 5.8% | 32.7% | 1.3% | $91k | 29.0% | 20.1% | 13.5% | 77.9% | 9.7% | 4.3% |
| Lee (in district) | 83,055 | 62,314 | 62.4% | 3.5% | 29.9% | 1.0% | $75k | 28.6% | 19.6% | 15.8% | 70.8% | 14.6% | 2.2% |
| Lafayette (in district) | 58,058 | 47,505 | 68.5% | 3.7% | 22.6% | 2.2% | $79k | 46.5% | 37.0% | 13.8% | 63.8% | 18.5% | 1.5% |
| Lowndes (in district) | 57,640 | 43,948 | 49.1% | 2.3% | 43.5% | 1.0% | $59k | 28.2% | 21.4% | 17.3% | 61.3% | 17.2% | 1.5% |
| Alcorn (in district) | 34,263 | 26,612 | 79.7% | 3.8% | 10.1% | 0.5% | $56k | 18.6% | 18.1% | 19.0% | 67.8% | 15.8% | 2.1% |
| Marshall (in district) | 33,997 | 26,937 | 47.1% | 5.1% | 42.8% | 0.1% | $61k | 14.6% | 20.1% | 19.0% | 79.1% | 23.0% | 4.1% |
| Monroe (in district) | 33,794 | 26,230 | 66.3% | 1.6% | 29.7% | 0.3% | $55k | 16.4% | 17.1% | 20.4% | 76.3% | 18.0% | 1.0% |
| Pontotoc (in district) | 31,539 | 23,307 | 74.0% | 7.1% | 14.7% | 0.0% | $53k | 18.5% | 20.1% | 15.5% | 69.8% | 16.7% | 5.3% |
| Tate (in district) | 28,338 | 22,019 | 64.0% | 3.2% | 29.2% | 0.1% | $71k | 23.6% | 22.9% | 16.7% | 75.9% | 16.9% | 2.4% |
| Union (in district) | 28,153 | 21,106 | 76.5% | 4.9% | 13.7% | 0.3% | $59k | 19.2% | 20.2% | 16.6% | 74.6% | 15.1% | 3.8% |
| Prentiss (in district) | 25,226 | 19,631 | 79.4% | 1.5% | 12.9% | 0.5% | $55k | 19.7% | 23.2% | 17.4% | 77.4% | 16.8% | 0.3% |
| Itawamba (in district) | 24,026 | 18,915 | 88.2% | 1.9% | 5.1% | 0.5% | $65k | 16.0% | 23.1% | 17.5% | 79.0% | 15.5% | 0.8% |
| Tippah (in district) | 21,475 | 16,408 | 76.0% | 5.2% | 14.0% | 0.2% | $55k | 17.9% | 20.3% | 17.4% | 74.9% | 18.9% | 3.9% |
| Tishomingo (in district) | 18,664 | 14,650 | 90.4% | 3.2% | 1.2% | 0.6% | $55k | 17.8% | 16.2% | 21.2% | 79.5% | 18.0% | 2.4% |
| Clay (in district) | 18,370 | 14,227 | 36.9% | 0.2% | 60.1% | 0.1% | $48k | 17.3% | 19.0% | 19.8% | 71.3% | 20.9% | 0.3% |
| Chickasaw (in district) | 16,930 | 12,730 | 49.4% | 1.1% | 47.7% | 0.4% | $45k | 12.0% | 19.7% | 18.6% | 70.3% | 23.5% | 1.1% |
| Calhoun (in district) | 12,913 | 10,056 | 63.7% | 6.3% | 26.4% | 0.1% | $46k | 12.1% | 17.6% | 20.8% | 72.0% | 20.4% | 3.2% |
| Webster (in district) | 9,964 | 7,527 | 77.8% | 1.9% | 18.7% | 0.3% | $63k | 20.9% | 17.6% | 18.2% | 76.1% | 16.4% | 0.7% |
| Choctaw (in district) | 8,123 | 6,384 | 67.0% | 1.9% | 27.8% | 0.9% | $50k | 20.1% | 16.4% | 23.2% | 79.4% | 18.5% | 1.1% |
| Benton (in district) | 7,583 | 5,986 | 60.4% | 2.4% | 34.4% | 0.3% | $46k | 12.8% | 14.1% | 21.0% | 86.0% | 21.5% | 1.8% |
| Oktibbeha (in district) | 3,196 | 2,372 | 70.7% | 2.2% | 18.9% | 0.1% | $51k | 34.6% | 11.7% | 27.2% | 87.5% | 13.2% | 0.2% |
DeSoto: 41 precincts
| Precinct | Population | Voting-age pop. | % White non-Hisp. | % Hispanic | % Black | % Asian | Median income* | % Bachelor's+ | % 18-29 (of adults) | % 65+ | % Homeowners | % Below poverty | % Spanish at home (adults) |
|---|---|---|---|---|---|---|---|---|---|---|---|---|---|
| Alphaba Cockrum Voting District | 2,120 | 1,463 | 70.5% | 2.9% | 4.3% | 2.7% | $113k | 37.1% | 15.5% | 8.3% | 98.9% | 1.6% | 1.9% |
| Baker's Chapel Voting District | 3,167 | 2,240 | 89.2% | 0.6% | 6.9% | 0.0% | $124k | 41.8% | 22.5% | 10.8% | 96.8% | 4.3% | 0.0% |
| Bridgetown Voting District | 3,499 | 2,681 | 82.6% | 1.9% | 12.7% | 0.4% | $129k | 37.5% | 23.4% | 14.1% | 94.6% | 2.0% | 1.9% |
| Colonial Hills Voting District | 2,826 | 2,030 | 50.8% | 6.7% | 33.5% | 1.4% | $52k | 7.7% | 22.5% | 15.3% | 63.8% | 15.4% | 5.2% |
| Cumberland Voting District | 2,709 | 2,104 | 41.9% | 3.8% | 48.1% | 3.7% | $91k | 29.0% | 23.5% | 12.9% | 68.0% | 3.4% | 2.4% |
| DeSoto Central Voting District | 4,159 | 3,048 | 62.9% | 5.9% | 26.5% | 1.3% | $122k | 44.3% | 11.9% | 12.0% | 91.4% | 1.0% | 4.0% |
| Elmore Voting District | 4,569 | 3,680 | 60.2% | 3.9% | 32.6% | 1.0% | $122k | 44.3% | 14.0% | 15.2% | 90.1% | 1.2% | 1.1% |
| Endora Voting District | 2,941 | 2,386 | 78.4% | 3.2% | 18.0% | 0.0% | $75k | 22.1% | 22.8% | 19.1% | 88.8% | 4.9% | 2.8% |
| Fairhaven Voting District | 6,212 | 4,572 | 40.6% | 15.0% | 38.3% | 4.4% | $117k | 31.0% | 19.7% | 10.7% | 91.5% | 6.5% | 13.3% |
| Greenbrook North Voting District | 4,931 | 3,766 | 50.1% | 3.3% | 40.3% | 4.2% | $78k | 33.5% | 18.9% | 17.7% | 85.9% | 4.1% | 2.3% |
| Greenbrook South Voting District | 9,625 | 7,223 | 60.6% | 4.4% | 33.5% | 0.8% | $71k | 22.6% | 21.9% | 15.4% | 83.9% | 15.4% | 2.4% |
| Hack's Cross Voting District | 7,321 | 5,676 | 47.5% | 8.1% | 40.5% | 0.4% | $78k | 20.5% | 23.2% | 9.3% | 69.7% | 6.7% | 5.6% |
| Hernando Central Voting District | 4,492 | 3,093 | 79.3% | 6.9% | 6.8% | 1.8% | $72k | 28.5% | 15.6% | 10.6% | 81.4% | 6.5% | 5.5% |
| Hernando East Voting District | 5,806 | 4,638 | 79.8% | 1.0% | 13.5% | 2.3% | $92k | 39.7% | 20.8% | 22.1% | 87.7% | 8.7% | 0.0% |
| Hernando West Voting District | 5,846 | 4,516 | 74.6% | 5.9% | 18.0% | 0.1% | $86k | 34.1% | 14.4% | 18.9% | 76.8% | 5.8% | 3.4% |
| Horn Lake Central Voting District | 4,627 | 3,345 | 37.5% | 8.9% | 50.3% | 0.1% | $59k | 15.0% | 30.9% | 11.9% | 60.3% | 25.2% | 8.4% |
| Horn Lake East Voting District | 7,006 | 4,959 | 41.2% | 5.1% | 50.0% | 0.4% | $53k | 14.2% | 25.5% | 9.5% | 53.9% | 31.9% | 6.8% |
| Horn Lake High School Voting District | 4,180 | 3,486 | 50.3% | 3.2% | 37.8% | 1.9% | $75k | 22.4% | 24.9% | 17.2% | 64.1% | 8.2% | 3.5% |
| Horn Lake Intermediate School Voting District | 3,763 | 2,837 | 31.9% | 21.5% | 44.7% | 0.0% | $71k | 17.8% | 18.7% | 9.2% | 76.7% | 16.8% | 11.5% |
| Horn Lake North Voting District | 3,892 | 3,207 | 42.7% | 10.4% | 45.1% | 0.0% | $72k | 17.4% | 22.4% | 20.4% | 68.1% | 9.4% | 8.0% |
| Horn Lake West Voting District | 4,443 | 3,049 | 27.3% | 10.3% | 56.6% | 2.2% | $46k | 13.9% | 23.0% | 8.0% | 55.9% | 11.4% | 10.8% |
| Ingram's Mill Voting District | 3,488 | 2,473 | 75.6% | 5.5% | 12.5% | 0.0% | $120k | 22.5% | 20.4% | 12.2% | 97.5% | 6.6% | 3.7% |
| Lake Cormorant Voting District | 2,267 | 1,738 | 50.2% | 7.5% | 38.6% | 1.4% | $77k | 20.7% | 14.1% | 11.7% | 60.8% | 17.8% | 6.5% |
| Lewisburg East Voting District | 1,438 | 1,033 | 80.9% | 4.3% | 6.8% | 3.3% | $143k | 37.3% | 16.1% | 12.5% | 97.5% | 5.0% | 0.4% |
| Lewisburg Voting District | 5,983 | 4,335 | 80.3% | 2.8% | 8.6% | 1.3% | $139k | 50.9% | 12.1% | 10.7% | 98.1% | 2.3% | 4.8% |
| Love Voting District | 3,665 | 2,666 | 91.4% | 1.9% | 3.7% | 0.0% | $115k | 38.2% | 7.5% | 15.3% | 95.4% | 5.0% | 0.0% |
| Miller Voting District | 4,670 | 3,396 | 63.5% | 2.7% | 25.6% | 3.0% | $117k | 33.2% | 14.6% | 12.8% | 92.7% | 6.0% | 2.3% |
| Mineral Wells Voting District | 5,265 | 4,009 | 51.0% | 2.8% | 38.2% | 1.2% | $109k | 32.7% | 13.2% | 15.6% | 87.8% | 5.3% | 2.0% |
| Nesbit East Voting District | 5,417 | 4,038 | 49.4% | 3.5% | 38.4% | 4.0% | $129k | 48.3% | 8.5% | 9.7% | 87.1% | 3.2% | 2.7% |
| Nesbit West Voting District | 5,135 | 3,877 | 71.4% | 11.4% | 13.8% | 0.2% | $90k | 30.3% | 22.0% | 18.4% | 91.5% | 8.0% | 7.6% |
| Northwest Community College Voting District | 5,016 | 4,010 | 49.1% | 3.7% | 41.7% | 0.5% | $50k | 27.3% | 26.5% | 9.1% | 39.1% | 24.2% | 4.0% |
| Olive Branch East Voting District | 3,294 | 2,397 | 45.9% | 6.0% | 40.5% | 0.7% | $105k | 25.5% | 34.6% | 6.8% | 91.5% | 7.7% | 3.4% |
| Olive Branch North Voting District | 6,240 | 4,630 | 44.5% | 4.0% | 46.0% | 3.6% | $102k | 24.7% | 29.1% | 11.4% | 73.3% | 3.3% | 2.7% |
| Olive Branch South Voting District | 4,786 | 3,752 | 53.5% | 3.9% | 40.2% | 1.2% | $101k | 23.4% | 24.6% | 9.7% | 88.3% | 4.0% | 2.7% |
| Olive Branch West Voting District | 2,642 | 2,215 | 63.7% | 1.3% | 27.3% | 1.4% | $101k | 30.7% | 16.6% | 21.6% | 83.3% | 6.9% | 0.8% |
| Pleasant Hill North Voting District | 7,109 | 5,251 | 67.5% | 7.0% | 19.9% | 1.4% | $133k | 41.1% | 11.0% | 15.9% | 91.6% | 3.5% | 4.2% |
| Southhaven North Voting District | 7,236 | 5,188 | 47.6% | 6.5% | 43.3% | 0.3% | $55k | 14.9% | 28.6% | 14.5% | 61.2% | 21.8% | 5.4% |
| Southhaven South Voting District | 2,928 | 2,108 | 37.1% | 8.4% | 47.6% | 0.4% | $42k | 20.8% | 29.3% | 11.4% | 20.5% | 29.1% | 8.4% |
| Southhaven West Voting District | 6,201 | 4,123 | 23.0% | 5.3% | 63.0% | 0.0% | $87k | 22.9% | 24.3% | 8.9% | 70.0% | 16.3% | 3.0% |
| Summershill Voting District | 4,736 | 3,708 | 71.1% | 2.8% | 22.7% | 1.6% | $123k | 38.2% | 14.6% | 20.2% | 89.5% | 2.0% | 1.2% |
| Walls Voting District | 5,066 | 4,030 | 42.9% | 8.3% | 43.2% | 1.3% | $86k | 19.4% | 17.7% | 13.7% | 75.4% | 12.8% | 6.1% |
Lee: 36 precincts
| Precinct | Population | Voting-age pop. | % White non-Hisp. | % Hispanic | % Black | % Asian | Median income* | % Bachelor's+ | % 18-29 (of adults) | % 65+ | % Homeowners | % Below poverty | % Spanish at home (adults) |
|---|---|---|---|---|---|---|---|---|---|---|---|---|---|
| Auburn Voting District | 2,636 | 1,972 | 88.2% | 2.6% | 9.2% | 0.0% | $80k | 17.1% | 18.2% | 13.1% | 81.4% | 14.6% | 1.0% |
| Baldwin Voting District | 1,298 | 1,012 | 51.9% | 0.0% | 47.9% | 0.2% | $55k | 21.1% | 7.4% | 25.2% | 83.1% | 21.9% | 0.0% |
| Beech Springs Voting District | 644 | 522 | 72.7% | 9.4% | 14.6% | 0.0% | $57k | 30.9% | 22.6% | 24.3% | 60.8% | 17.7% | 0.1% |
| Belden Voting District | 4,415 | 3,484 | 68.4% | 1.3% | 21.7% | 2.3% | $101k | 43.4% | 20.4% | 15.4% | 67.3% | 6.8% | 0.9% |
| Birmingham Ridge Voting District | 2,370 | 1,754 | 87.5% | 2.9% | 6.2% | 0.1% | $100k | 40.0% | 11.5% | 13.2% | 92.4% | 5.0% | 0.5% |
| Bissell Voting District | 9,339 | 6,733 | 62.6% | 6.6% | 27.0% | 2.5% | $96k | 38.0% | 11.6% | 18.7% | 79.2% | 10.4% | 3.8% |
| Brewer Voting District | 462 | 356 | 74.4% | 0.8% | 19.4% | 0.0% | $73k | 25.2% | 15.3% | 32.0% | 87.0% | 16.1% | 0.0% |
| Cedar Hill Voting District | 3,453 | 2,274 | 79.6% | 1.8% | 16.9% | 0.0% | $94k | 22.1% | 18.8% | 9.4% | 92.1% | 15.5% | 0.4% |
| Eggville Voting District | 952 | 629 | 81.4% | 2.7% | 15.9% | 0.0% | $63k | 9.1% | 16.8% | 11.7% | 64.7% | 41.2% | 2.2% |
| Euclautubba Voting District | 881 | 673 | 83.7% | 0.2% | 11.5% | 0.0% | $90k | 44.2% | 15.5% | 19.3% | 95.5% | 0.8% | 1.2% |
| Fellowship Voting District | 2,242 | 1,751 | 80.6% | 5.2% | 12.8% | 0.1% | $67k | 17.8% | 21.7% | 15.4% | 73.0% | 16.0% | 0.4% |
| Friendship Voting District | 390 | 275 | 87.9% | 0.5% | 7.4% | 4.2% | $50k | 20.6% | 20.2% | 18.4% | 92.9% | 10.9% | 1.1% |
| Gilvo Voting District | 736 | 532 | 94.4% | 0.2% | 3.8% | 0.4% | $98k | 32.3% | 27.5% | 10.9% | 75.8% | 9.4% | 0.0% |
| Guntown Voting District | 1,606 | 1,243 | 76.4% | 2.0% | 14.2% | 1.9% | $58k | 28.6% | 16.6% | 11.9% | 77.3% | 12.6% | 1.9% |
| Hebron Voting District | 708 | 486 | 100.0% | 0.0% | 0.0% | 0.0% | $61k | 18.1% | 11.2% | 15.6% | 93.5% | 6.8% | 1.8% |
| Kedron Voting District | 670 | 508 | 75.6% | 0.3% | 19.6% | 0.0% | $72k | 32.5% | 16.0% | 21.5% | 85.2% | 14.5% | 1.0% |
| Mooreville Voting District | 3,022 | 2,159 | 88.0% | 1.7% | 9.2% | 0.2% | $98k | 33.3% | 25.9% | 12.1% | 78.7% | 5.5% | 0.0% |
| Nettleton Voting District | 1,829 | 1,445 | 81.5% | 0.1% | 16.7% | 0.0% | $64k | 7.1% | 21.8% | 17.9% | 81.4% | 14.5% | 0.0% |
| Old Union Voting District | 835 | 613 | 60.3% | 0.0% | 35.2% | 0.0% | $25k | 17.3% | 22.4% | 15.0% | 66.4% | 30.1% | 1.7% |
| Palmetto Voting District | 3,224 | 2,395 | 26.1% | 3.9% | 63.9% | 0.7% | $51k | 12.9% | 27.6% | 10.6% | 42.6% | 20.7% | 3.5% |
| Petersburg Voting District | 745 | 526 | 81.6% | 0.0% | 16.3% | 0.0% | $65k | 22.8% | 16.3% | 12.7% | 82.6% | 15.5% | 1.0% |
| Plantersville Voting District | 1,735 | 1,280 | 49.8% | 0.0% | 46.7% | 0.1% | $47k | 20.4% | 27.1% | 14.8% | 51.9% | 28.8% | 0.2% |
| Pleasant Grove Voting District | 2,130 | 1,512 | 46.4% | 2.0% | 49.6% | 0.0% | $53k | 23.8% | 28.3% | 12.9% | 72.6% | 22.5% | 2.8% |
| Pratts Voting District | 688 | 485 | 87.7% | 0.5% | 7.6% | 4.2% | $50k | 20.5% | 20.2% | 18.5% | 92.9% | 11.0% | 1.1% |
| Richmond Voting District | 998 | 811 | 73.8% | 0.0% | 14.5% | 0.0% | $68k | 23.6% | 19.5% | 12.4% | 74.1% | 15.5% | 0.7% |
| Saltillo Voting District | 3,985 | 3,032 | 79.3% | 3.5% | 13.7% | 0.1% | $86k | 33.2% | 22.7% | 15.4% | 86.0% | 5.0% | 0.7% |
| Shannon Voting District | 699 | 563 | 43.9% | 8.3% | 42.8% | 0.0% | $52k | 17.5% | 25.8% | 24.1% | 80.2% | 18.0% | 9.9% |
| Tupelo 1 Voting District | 1,211 | 930 | 63.7% | 0.9% | 28.8% | 6.5% | $161k | 43.3% | 11.4% | 31.8% | 68.2% | 15.6% | 0.0% |
| Tupelo 2 Voting District | 6,512 | 4,875 | 61.9% | 4.8% | 26.9% | 0.5% | $75k | 39.8% | 20.7% | 15.2% | 63.9% | 16.0% | 4.3% |
| Tupelo 3 Voting District | 5,415 | 4,185 | 49.1% | 3.1% | 40.0% | 2.5% | $72k | 35.3% | 17.4% | 22.6% | 79.1% | 8.3% | 1.7% |
| Tupelo 4 North Voting District | 4,113 | 3,102 | 39.5% | 5.9% | 49.8% | 1.0% | $53k | 25.1% | 17.5% | 12.6% | 42.8% | 29.7% | 6.8% |
| Tupelo 4 South Voting District | 2,718 | 2,022 | 11.2% | 4.4% | 80.0% | 0.7% | $55k | 19.9% | 20.1% | 13.6% | 49.7% | 13.6% | 3.2% |
| Tupelo 5 Voting District | 3,075 | 2,463 | 37.6% | 10.0% | 48.7% | 0.0% | $63k | 26.5% | 31.4% | 13.7% | 50.9% | 18.5% | 5.1% |
| Unity Voting District | 1,071 | 757 | 91.6% | 0.6% | 4.9% | 1.6% | $55k | 20.9% | 14.1% | 15.6% | 89.5% | 8.9% | 1.8% |
| Verona Voting District | 2,760 | 2,053 | 26.0% | 2.8% | 67.7% | 1.4% | $63k | 15.7% | 25.9% | 14.5% | 46.4% | 20.6% | 2.5% |
| Veteran's Park Voting District | 3,489 | 2,902 | 73.4% | 4.2% | 21.8% | 0.0% | $69k | 23.8% | 18.9% | 16.3% | 73.8% | 17.1% | 0.1% |
Lafayette: 18 precincts
| Precinct | Population | Voting-age pop. | % White non-Hisp. | % Hispanic | % Black | % Asian | Median income* | % Bachelor's+ | % 18-29 (of adults) | % 65+ | % Homeowners | % Below poverty | % Spanish at home (adults) |
|---|---|---|---|---|---|---|---|---|---|---|---|---|---|
| Abbeville Voting District | 1,744 | 1,494 | 39.9% | 0.0% | 57.5% | 1.7% | $41k | 20.1% | 22.5% | 17.9% | 73.4% | 14.1% | 0.3% |
| Airport Grocery Voting District | 618 | 482 | 96.8% | 1.4% | 1.0% | 0.0% | $82k | 22.2% | 13.4% | 18.7% | 92.9% | 35.8% | 0.3% |
| Anchor-Taylor 4 Voting District | 2,231 | 1,417 | 80.1% | 8.7% | 5.9% | 0.2% | $90k | 44.7% | 21.3% | 9.3% | 82.4% | 11.3% | 2.1% |
| Burgess Voting District | 674 | 584 | 56.1% | 2.1% | 37.2% | 0.7% | $57k | 31.2% | 18.6% | 19.4% | 76.1% | 21.4% | 0.4% |
| College Hill Voting District | 3,943 | 3,267 | 81.0% | 0.9% | 13.9% | 3.9% | $108k | 61.7% | 25.1% | 18.3% | 65.7% | 15.4% | 1.1% |
| Harmontown Voting District | 1,158 | 1,067 | 95.4% | 0.0% | 1.5% | 0.0% | $49k | 5.7% | 26.2% | 20.0% | 91.8% | 11.6% | 0.0% |
| Lafayette Springs Voting District | 1,492 | 1,181 | 84.8% | 0.0% | 15.1% | 0.0% | $93k | 9.9% | 23.1% | 10.6% | 82.2% | 37.5% | 0.0% |
| Oxford 1 Voting District | 8,961 | 7,706 | 72.6% | 2.8% | 21.4% | 1.4% | $100k | 47.3% | 56.0% | 10.5% | 70.2% | 19.6% | 1.4% |
| Oxford 2 Voting District | 9,947 | 8,092 | 70.2% | 5.4% | 20.1% | 1.0% | $82k | 54.8% | 19.9% | 20.4% | 67.6% | 12.6% | 1.7% |
| Oxford 4 Voting District | 7,405 | 6,138 | 56.4% | 4.2% | 29.1% | 4.7% | $67k | 53.0% | 45.1% | 9.5% | 45.2% | 18.3% | 2.5% |
| Oxford 5 Voting District | 8,092 | 6,794 | 57.9% | 6.3% | 28.3% | 4.4% | $74k | 57.4% | 65.4% | 9.0% | 40.3% | 29.6% | 2.5% |
| Paris Voting District | 503 | 392 | 99.9% | 0.0% | 0.0% | 0.0% | $62k | 21.5% | 14.1% | 17.9% | 92.1% | 32.2% | 0.0% |
| Philadelphia Voting District | 734 | 620 | 81.4% | 0.0% | 18.3% | 0.0% | $64k | 13.4% | 21.0% | 16.6% | 91.5% | 14.4% | 0.0% |
| Taylor 3 Voting District | 2,123 | 1,625 | 60.2% | 7.8% | 21.7% | 0.4% | $82k | 38.1% | 18.1% | 14.4% | 76.4% | 14.8% | 0.7% |
| Tula Voting District | 1,112 | 741 | 100.0% | 0.0% | 0.0% | 0.0% | $62k | 22.8% | 19.5% | 10.0% | 82.2% | 4.4% | 0.0% |
| Union West Voting District | 572 | 514 | 48.7% | 2.4% | 46.6% | 0.0% | $45k | 33.5% | 22.6% | 20.5% | 71.8% | 25.4% | 0.0% |
| West Spring Hill - Oxford 3 Voting District | 5,613 | 4,556 | 64.2% | 1.7% | 28.9% | 2.4% | $76k | 53.7% | 29.4% | 14.9% | 57.7% | 18.2% | 0.8% |
| Yocona Voting District | 1,137 | 834 | 90.1% | 0.0% | 8.2% | 1.1% | $105k | 36.5% | 24.2% | 11.1% | 86.6% | 23.8% | 1.0% |
Lowndes: 20 precincts
| Precinct | Population | Voting-age pop. | % White non-Hisp. | % Hispanic | % Black | % Asian | Median income* | % Bachelor's+ | % 18-29 (of adults) | % 65+ | % Homeowners | % Below poverty | % Spanish at home (adults) |
|---|---|---|---|---|---|---|---|---|---|---|---|---|---|
| 15th Street Church Voting District | 1,543 | 1,124 | 10.5% | 0.0% | 89.4% | 0.0% | $19k | 12.4% | 15.0% | 22.2% | 25.3% | 64.6% | 0.0% |
| Air Base Voting District | 3,417 | 2,465 | 77.1% | 5.1% | 9.9% | 1.6% | $65k | 37.3% | 40.8% | 6.5% | 38.7% | 11.0% | 0.9% |
| Artesia Voting District | 376 | 290 | 40.8% | 0.0% | 52.2% | 1.7% | $50k | 37.6% | 6.4% | 29.4% | 78.6% | 12.8% | 0.5% |
| Brandon Voting District | 4,430 | 3,605 | 56.5% | 3.4% | 33.2% | 3.9% | $72k | 44.0% | 27.1% | 18.3% | 57.7% | 7.9% | 3.5% |
| Caledonia Voting District | 5,958 | 4,214 | 76.5% | 4.8% | 10.5% | 0.7% | $93k | 31.7% | 20.1% | 11.6% | 82.3% | 9.8% | 1.9% |
| Coleman Voting District | 1,053 | 732 | 12.6% | 4.6% | 79.4% | 1.8% | $19k | 5.2% | 31.0% | 16.1% | 28.0% | 61.5% | 6.9% |
| Crawford Voting District | 1,256 | 1,011 | 31.2% | 1.4% | 60.6% | 0.3% | $56k | 20.7% | 12.6% | 19.4% | 81.0% | 17.9% | 3.9% |
| East Columbus Gym Voting District | 4,608 | 3,832 | 26.6% | 1.2% | 68.0% | 1.5% | $52k | 22.7% | 23.7% | 20.4% | 64.3% | 7.9% | 0.1% |
| First Assembly Voting District | 4,609 | 3,592 | 55.8% | 1.5% | 34.1% | 2.3% | $76k | 41.2% | 14.0% | 26.0% | 77.8% | 11.5% | 1.4% |
| Hunt Voting District | 2,752 | 2,157 | 17.0% | 3.1% | 78.2% | 0.3% | $24k | 3.1% | 16.7% | 18.5% | 26.6% | 43.3% | 1.5% |
| Immanuel Voting District | 1,229 | 973 | 62.1% | 2.1% | 26.3% | 1.1% | $76k | 31.3% | 13.5% | 19.0% | 81.9% | 16.0% | 0.2% |
| New Hope Voting District | 8,200 | 5,905 | 71.2% | 1.8% | 24.6% | 0.0% | $77k | 30.9% | 18.3% | 15.0% | 74.6% | 9.7% | 0.9% |
| Plum Grove Voting District | 666 | 557 | 23.9% | 0.5% | 75.5% | 0.0% | $65k | 13.8% | 9.9% | 13.9% | 52.2% | 13.5% | 0.6% |
| Rural Hill Voting District | 4,142 | 3,073 | 44.8% | 1.4% | 51.5% | 0.5% | $49k | 17.9% | 28.7% | 14.8% | 53.3% | 21.1% | 0.5% |
| Southside Church Voting District | 6,152 | 4,348 | 24.5% | 1.3% | 72.0% | 0.0% | $43k | 15.2% | 19.9% | 12.7% | 54.5% | 26.8% | 2.5% |
| Steens Voting District | 1,291 | 1,025 | 64.2% | 0.6% | 19.5% | 0.0% | $71k | 28.6% | 18.0% | 20.2% | 75.3% | 10.2% | 0.1% |
| Townsend Park Voting District | 989 | 827 | 37.5% | 3.1% | 51.6% | 1.1% | $41k | 36.7% | 28.9% | 18.3% | 44.4% | 30.6% | 1.9% |
| Trinity Voting District | 1,789 | 1,483 | 22.8% | 0.5% | 75.1% | 0.0% | $46k | 26.7% | 18.8% | 26.8% | 66.2% | 7.4% | 1.3% |
| University Voting District | 1,994 | 1,750 | 61.1% | 2.7% | 25.7% | 2.2% | $49k | 46.7% | 26.9% | 25.1% | 48.4% | 20.0% | 1.5% |
| West Lowndes Voting District | 1,186 | 985 | 44.7% | 1.3% | 49.6% | 1.1% | $78k | 40.5% | 5.5% | 30.7% | 78.3% | 9.2% | 1.8% |
Alcorn: 17 precincts
| Precinct | Population | Voting-age pop. | % White non-Hisp. | % Hispanic | % Black | % Asian | Median income* | % Bachelor's+ | % 18-29 (of adults) | % 65+ | % Homeowners | % Below poverty | % Spanish at home (adults) |
|---|---|---|---|---|---|---|---|---|---|---|---|---|---|
| Bethel Voting District | 866 | 706 | 67.8% | 2.0% | 8.9% | 0.0% | $55k | 12.6% | 14.3% | 19.5% | 79.6% | 21.2% | 2.6% |
| Biggersville Voting District | 1,304 | 1,023 | 72.0% | 3.2% | 12.4% | 0.0% | $58k | 9.8% | 11.8% | 20.9% | 75.8% | 17.9% | 4.1% |
| Central Voting District | 2,160 | 1,678 | 89.9% | 1.4% | 4.6% | 0.0% | $53k | 12.2% | 19.5% | 19.4% | 74.3% | 12.1% | 0.9% |
| College Hill Voting District | 2,070 | 1,642 | 58.2% | 10.5% | 23.7% | 0.0% | $29k | 13.4% | 19.9% | 15.0% | 22.1% | 31.2% | 1.5% |
| East Corinth Voting District | 1,998 | 1,484 | 69.8% | 1.9% | 23.6% | 3.3% | $60k | 28.7% | 20.0% | 15.2% | 63.6% | 12.4% | 2.2% |
| Five-Point Voting District | 4,017 | 2,995 | 93.6% | 0.6% | 3.9% | 0.7% | $63k | 23.8% | 22.7% | 14.9% | 80.7% | 10.8% | 0.7% |
| Glen Voting District | 1,690 | 1,211 | 91.5% | 1.0% | 0.1% | 0.0% | $57k | 13.0% | 10.4% | 16.7% | 91.9% | 10.8% | 1.0% |
| Jacinto Voting District | 876 | 658 | 87.2% | 0.1% | 0.0% | 0.0% | $68k | 16.8% | 8.8% | 14.2% | 96.7% | 7.8% | 0.2% |
| Kossuth Voting District | 2,121 | 1,667 | 89.3% | 0.7% | 6.3% | 0.0% | $69k | 14.8% | 14.1% | 15.3% | 85.5% | 13.3% | 0.8% |
| North Corinth Voting District | 2,940 | 2,288 | 94.0% | 0.0% | 3.0% | 0.0% | $107k | 51.3% | 17.7% | 24.2% | 80.6% | 6.4% | 0.1% |
| Pinecrest Voting District | 1,499 | 1,064 | 55.1% | 4.5% | 32.1% | 3.7% | $57k | 18.9% | 27.0% | 15.3% | 61.0% | 13.2% | 4.2% |
| Rienzi Voting District | 1,444 | 1,147 | 70.8% | 2.3% | 2.3% | 0.0% | $59k | 8.8% | 10.6% | 17.3% | 83.1% | 21.4% | 3.0% |
| Shady Grove Voting District | 3,428 | 2,842 | 75.2% | 5.0% | 9.6% | 0.0% | $43k | 13.9% | 17.2% | 24.2% | 58.0% | 16.0% | 4.5% |
| South Corinth Voting District | 1,460 | 1,139 | 57.1% | 9.0% | 31.3% | 0.0% | $38k | 11.0% | 16.0% | 22.6% | 56.3% | 24.6% | 4.1% |
| Union Center Voting District | 1,783 | 1,358 | 97.4% | 0.3% | 0.0% | 0.4% | $50k | 14.5% | 17.6% | 19.6% | 83.9% | 16.3% | 0.4% |
| Wenasoga Voting District | 3,143 | 2,522 | 83.3% | 8.1% | 6.8% | 0.0% | $43k | 11.9% | 21.6% | 23.4% | 55.5% | 18.5% | 3.3% |
| West Corinth Voting District | 1,464 | 1,187 | 61.5% | 16.3% | 18.8% | 0.0% | $31k | 16.1% | 23.4% | 18.3% | 39.2% | 27.6% | 3.7% |
Marshall: 24 precincts
| Precinct | Population | Voting-age pop. | % White non-Hisp. | % Hispanic | % Black | % Asian | Median income* | % Bachelor's+ | % 18-29 (of adults) | % 65+ | % Homeowners | % Below poverty | % Spanish at home (adults) |
|---|---|---|---|---|---|---|---|---|---|---|---|---|---|
| Barton Voting District | 1,655 | 1,380 | 73.0% | 0.1% | 12.9% | 1.9% | $52k | 27.6% | 8.9% | 28.8% | 94.1% | 23.7% | 0.1% |
| Bethlehem Voting District | 425 | 371 | 77.0% | 5.1% | 17.9% | 0.0% | $41k | 7.9% | 10.2% | 26.8% | 88.7% | 23.7% | 1.1% |
| Byhalia Voting District | 4,125 | 3,122 | 50.8% | 18.8% | 27.8% | 0.0% | $52k | 11.1% | 22.4% | 20.4% | 70.9% | 27.3% | 13.3% |
| Cayce Voting District | 1,523 | 1,170 | 65.7% | 3.2% | 30.7% | 0.0% | $52k | 12.6% | 15.6% | 20.2% | 85.2% | 8.3% | 2.9% |
| Chulahoma Voting District | 1,129 | 900 | 32.2% | 0.0% | 67.3% | 0.0% | $41k | 19.1% | 22.6% | 17.4% | 85.3% | 26.3% | 1.2% |
| Cornersville Voting District | 273 | 239 | 77.1% | 5.1% | 17.8% | 0.0% | $41k | 7.9% | 10.2% | 26.7% | 88.7% | 23.7% | 1.1% |
| Early Grove Voting District | 496 | 404 | 69.6% | 0.0% | 20.6% | 0.0% | $64k | 12.3% | 30.5% | 18.7% | 72.3% | 7.7% | 0.0% |
| Hudsonville Voting District | 874 | 712 | 64.7% | 0.3% | 21.5% | 0.0% | $71k | 11.9% | 25.9% | 20.4% | 80.1% | 9.6% | 0.0% |
| Laws Hill Voting District | 370 | 318 | 39.9% | 0.0% | 60.1% | 0.0% | $49k | 17.6% | 16.1% | 24.1% | 98.5% | 38.5% | 0.0% |
| Marianna Voting District | 1,538 | 1,259 | 41.4% | 6.9% | 45.8% | 0.0% | $87k | 25.4% | 18.5% | 11.7% | 80.1% | 11.4% | 7.9% |
| Mt. Pleasant Voting District | 1,680 | 1,344 | 63.2% | 3.2% | 29.6% | 0.0% | $56k | 13.7% | 8.1% | 30.6% | 90.8% | 10.9% | 2.1% |
| N. Holly Springs Dist. 1 | 2,779 | 2,461 | 26.7% | 1.2% | 67.0% | 0.6% | $47k | 7.6% | 35.2% | 13.5% | 78.3% | 30.9% | 0.9% |
| N. Holly Springs Dist. 2 | 1,567 | 1,264 | 23.0% | 0.7% | 72.7% | 0.1% | $69k | 15.1% | 12.2% | 24.2% | 77.7% | 16.2% | 0.6% |
| North Cayce Voting District | 1,350 | 976 | 55.0% | 14.8% | 23.8% | 0.0% | $47k | 8.9% | 26.2% | 15.4% | 71.3% | 12.5% | 4.2% |
| Potts Camp Voting District | 792 | 462 | 77.2% | 1.1% | 15.7% | 0.0% | $47k | 13.0% | 17.8% | 12.1% | 72.7% | 32.8% | 0.9% |
| Redbanks Voting District | 1,960 | 1,537 | 27.8% | 5.3% | 63.2% | 0.0% | $86k | 24.7% | 16.6% | 20.5% | 86.5% | 18.6% | 5.5% |
| Slayden Voting District | 1,389 | 1,187 | 57.9% | 1.0% | 19.9% | 0.0% | $93k | 12.0% | 17.8% | 25.3% | 91.6% | 7.1% | 0.0% |
| South Holly Springs Voting District | 2,941 | 2,291 | 32.5% | 0.7% | 63.3% | 0.1% | $63k | 19.6% | 25.5% | 12.0% | 75.9% | 41.2% | 0.8% |
| Victoria Voting District | 683 | 463 | 34.7% | 7.1% | 56.8% | 0.0% | $60k | 9.7% | 20.1% | 17.3% | 69.9% | 38.2% | 7.0% |
| Wall Hill Voting District | 1,157 | 924 | 60.5% | 3.4% | 31.2% | 0.0% | $42k | 11.9% | 25.6% | 13.8% | 65.1% | 32.1% | 9.3% |
| Warsaw Voting District | 1,019 | 704 | 29.8% | 5.2% | 62.9% | 0.0% | $88k | 4.8% | 19.9% | 16.2% | 71.2% | 43.5% | 4.3% |
| Waterford Voting District | 1,132 | 904 | 69.4% | 3.1% | 26.7% | 0.0% | $43k | 11.4% | 12.8% | 22.5% | 87.0% | 29.2% | 0.9% |
| Watson Voting District | 1,577 | 1,238 | 65.4% | 7.6% | 22.8% | 0.0% | $65k | 9.3% | 21.3% | 13.3% | 73.1% | 23.0% | 12.0% |
| West Holly Springs Voting District | 1,562 | 1,308 | 14.0% | 2.3% | 79.9% | 0.0% | $66k | 14.2% | 14.5% | 21.4% | 70.6% | 16.5% | 2.2% |
Monroe: 26 precincts
| Precinct | Population | Voting-age pop. | % White non-Hisp. | % Hispanic | % Black | % Asian | Median income* | % Bachelor's+ | % 18-29 (of adults) | % 65+ | % Homeowners | % Below poverty | % Spanish at home (adults) |
|---|---|---|---|---|---|---|---|---|---|---|---|---|---|
| Aberdeen 3 Voting District | 1,296 | 1,028 | 47.2% | 0.0% | 52.2% | 0.0% | $64k | 15.7% | 15.7% | 24.5% | 80.2% | 21.4% | 0.0% |
| Amory 1 Voting District | 744 | 586 | 89.9% | 1.6% | 6.9% | 0.0% | $98k | 24.5% | 7.2% | 22.4% | 88.5% | 8.7% | 1.1% |
| Amory 2 Voting District | 3,510 | 2,733 | 64.8% | 3.4% | 25.0% | 0.2% | $47k | 16.4% | 20.9% | 17.2% | 53.8% | 17.0% | 2.0% |
| Amory 5 Voting District | 1,043 | 840 | 31.2% | 0.6% | 67.0% | 0.0% | $35k | 10.9% | 22.7% | 19.9% | 51.4% | 21.9% | 1.1% |
| Athens Voting District | 859 | 628 | 88.3% | 0.1% | 10.6% | 0.0% | $63k | 23.9% | 21.6% | 9.6% | 89.6% | 20.1% | 0.1% |
| Bartahatchie Voting District | 929 | 643 | 95.6% | 2.2% | 1.8% | 0.0% | $64k | 15.1% | 21.2% | 10.9% | 86.0% | 13.0% | 1.4% |
| Becker Voting District | 2,523 | 2,057 | 77.5% | 3.9% | 14.7% | 0.1% | $66k | 15.9% | 14.0% | 20.3% | 87.6% | 10.7% | 2.5% |
| Bigbee 1 Voting District | 466 | 430 | 94.5% | 1.0% | 4.2% | 0.0% | $54k | 20.7% | 16.3% | 33.3% | 77.1% | 16.9% | 0.2% |
| Boyds Voting District | 383 | 377 | 98.3% | 1.2% | 0.0% | 0.0% | $51k | 23.9% | 17.0% | 43.5% | 72.7% | 12.9% | 0.3% |
| Central Grove Voting District | 642 | 539 | 62.3% | 0.1% | 37.6% | 0.0% | $40k | 7.0% | 29.7% | 16.9% | 77.9% | 29.0% | 0.0% |
| Darracott Voting District | 371 | 309 | 75.5% | 1.5% | 17.0% | 0.0% | $55k | 6.2% | 22.6% | 19.9% | 54.4% | 19.9% | 1.8% |
| Gibson Voting District | 611 | 453 | 23.9% | 0.2% | 73.2% | 0.4% | $35k | 14.2% | 13.2% | 20.5% | 84.6% | 30.5% | 1.1% |
| Greenwood Springs Voting District | 350 | 226 | 96.2% | 0.0% | 2.9% | 0.0% | $65k | 14.0% | 26.0% | 7.8% | 92.2% | 18.3% | 0.0% |
| Hamilton Voting District | 2,387 | 1,826 | 66.3% | 1.9% | 27.6% | 3.6% | $56k | 21.1% | 19.0% | 19.8% | 83.5% | 9.5% | 1.2% |
| Hatley Voting District | 2,941 | 2,265 | 91.8% | 0.8% | 5.0% | 0.1% | $68k | 17.7% | 12.7% | 26.0% | 84.9% | 8.9% | 0.8% |
| Lackey Voting District | 1,274 | 1,046 | 82.7% | 1.8% | 14.2% | 0.0% | $63k | 28.2% | 17.3% | 14.0% | 83.8% | 16.6% | 1.0% |
| Nettleton Voting District | 1,345 | 1,050 | 57.5% | 10.9% | 31.3% | 0.0% | $37k | 6.9% | 17.5% | 15.9% | 66.8% | 30.5% | 4.9% |
| North Aberdeen 4 Voting District | 2,424 | 1,800 | 22.0% | 0.5% | 76.5% | 0.0% | $28k | 16.4% | 12.8% | 33.9% | 70.3% | 35.5% | 0.1% |
| North Greenwood Springs Voting District | 1,190 | 861 | 94.3% | 0.0% | 2.8% | 0.0% | $76k | 19.8% | 22.3% | 16.0% | 94.1% | 11.6% | 0.0% |
| Parham Voting District | 531 | 411 | 91.9% | 0.0% | 3.2% | 0.0% | $88k | 24.4% | 22.8% | 19.1% | 96.6% | 6.9% | 0.0% |
| Prairie Voting District | 768 | 549 | 24.7% | 0.6% | 69.6% | 0.8% | $38k | 11.2% | 14.0% | 23.4% | 76.1% | 35.7% | 2.7% |
| Smithville Voting District | 1,436 | 1,098 | 94.8% | 0.0% | 2.5% | 0.1% | $73k | 20.0% | 16.8% | 21.6% | 88.6% | 5.2% | 0.3% |
| South Aberdeen 4 Voting District | 1,848 | 1,471 | 22.9% | 0.1% | 76.2% | 0.0% | $37k | 8.1% | 18.5% | 21.4% | 51.6% | 23.6% | 0.2% |
| Williams Voting District | 608 | 491 | 95.0% | 0.0% | 1.1% | 0.0% | $84k | 28.2% | 17.2% | 23.0% | 97.7% | 3.7% | 0.0% |
| Willis Voting District | 1,429 | 986 | 43.1% | 0.0% | 56.7% | 0.0% | $48k | 7.1% | 12.2% | 13.1% | 70.8% | 25.2% | 0.0% |
| Wren Voting District | 1,888 | 1,527 | 80.8% | 0.5% | 18.6% | 0.0% | $58k | 13.8% | 15.5% | 15.3% | 85.2% | 24.5% | 0.0% |
Pontotoc: 28 precincts
| Precinct | Population | Voting-age pop. | % White non-Hisp. | % Hispanic | % Black | % Asian | Median income* | % Bachelor's+ | % 18-29 (of adults) | % 65+ | % Homeowners | % Below poverty | % Spanish at home (adults) |
|---|---|---|---|---|---|---|---|---|---|---|---|---|---|
| Algoma Voting District | 1,006 | 703 | 67.1% | 2.3% | 18.8% | 0.0% | $45k | 17.2% | 23.1% | 13.9% | 73.7% | 22.1% | 0.9% |
| Bankhead Voting District | 1,503 | 1,146 | 65.9% | 5.9% | 24.0% | 0.0% | $48k | 15.5% | 18.8% | 13.3% | 71.1% | 16.2% | 4.6% |
| Beckham Voting District | 1,479 | 1,178 | 83.7% | 1.8% | 4.7% | 0.0% | $55k | 17.9% | 13.4% | 13.8% | 85.4% | 9.7% | 0.6% |
| Bethel Voting District | 1,208 | 877 | 71.4% | 9.7% | 15.2% | 0.0% | $50k | 18.5% | 20.7% | 11.7% | 61.9% | 18.9% | 8.0% |
| Buchanan Voting District | 1,050 | 727 | 95.6% | 1.5% | 2.6% | 0.0% | $73k | 12.8% | 8.1% | 12.8% | 69.5% | 17.6% | 1.9% |
| Cherry Creek Voting District | 1,556 | 1,145 | 74.1% | 14.7% | 10.8% | 0.0% | $67k | 20.2% | 16.7% | 12.8% | 61.5% | 12.0% | 14.1% |
| Ecru Voting District | 2,555 | 1,835 | 70.9% | 8.0% | 19.0% | 0.0% | $81k | 14.4% | 28.1% | 17.2% | 69.1% | 13.8% | 6.7% |
| Friendship Voting District | 625 | 433 | 80.3% | 7.0% | 12.7% | 0.0% | $53k | 14.9% | 3.9% | 25.7% | 66.3% | 20.6% | 9.1% |
| Hoyle Voting District | 1,335 | 910 | 50.2% | 4.9% | 36.3% | 0.0% | $39k | 9.0% | 15.8% | 15.7% | 56.0% | 23.9% | 2.1% |
| Hurricane Voting District | 1,061 | 848 | 96.0% | 0.6% | 1.8% | 0.0% | $67k | 17.4% | 17.3% | 21.9% | 81.3% | 13.9% | 0.1% |
| Judah Voting District | 944 | 708 | 98.1% | 1.1% | 0.7% | 0.0% | $61k | 13.0% | 32.3% | 12.8% | 92.9% | 22.8% | 0.5% |
| Longview Voting District | 714 | 490 | 50.8% | 2.1% | 38.6% | 0.0% | $41k | 9.3% | 17.7% | 13.2% | 60.0% | 25.9% | 0.0% |
| Oak Hill Voting District | 563 | 422 | 70.5% | 10.2% | 17.5% | 0.0% | $65k | 20.8% | 15.5% | 11.5% | 67.4% | 14.6% | 9.8% |
| Pontotoc 1 Voting District | 508 | 365 | 71.8% | 10.0% | 16.1% | 0.0% | $60k | 37.3% | 12.4% | 15.6% | 63.4% | 12.0% | 8.1% |
| Pontotoc 2 Voting District | 1,097 | 831 | 67.8% | 9.6% | 22.2% | 0.0% | $49k | 26.3% | 14.9% | 20.6% | 65.2% | 15.9% | 8.8% |
| Pontotoc 3 Voting District | 2,518 | 1,810 | 54.0% | 19.2% | 19.7% | 0.0% | $35k | 27.5% | 18.5% | 18.0% | 49.4% | 19.6% | 15.8% |
| Pontotoc 4 Voting District | 1,676 | 1,227 | 71.7% | 2.1% | 19.9% | 0.0% | $51k | 20.0% | 22.0% | 15.4% | 71.9% | 6.3% | 1.5% |
| Pontotoc 5 Voting District | 1,373 | 995 | 59.8% | 10.3% | 25.7% | 0.0% | $39k | 28.3% | 23.3% | 16.1% | 56.0% | 13.6% | 8.4% |
| Randolph Voting District | 1,372 | 1,061 | 85.0% | 4.1% | 7.0% | 0.0% | $50k | 12.4% | 36.5% | 15.6% | 70.2% | 23.9% | 0.6% |
| Robbs Voting District | 503 | 364 | 100.0% | 0.0% | 0.0% | 0.0% | $58k | 12.1% | 35.3% | 10.9% | 92.8% | 24.5% | 0.0% |
| Sherman Voting District | 572 | 451 | 90.3% | 2.8% | 4.7% | 0.0% | $68k | 34.2% | 31.0% | 12.7% | 78.8% | 16.9% | 0.0% |
| Springville Voting District | 1,121 | 769 | 65.9% | 3.7% | 19.4% | 0.0% | $39k | 17.2% | 26.3% | 13.1% | 70.0% | 23.7% | 1.5% |
| Thaxton Voting District | 1,214 | 980 | 84.2% | 7.2% | 6.8% | 0.0% | $52k | 20.4% | 21.9% | 20.5% | 86.6% | 15.1% | 3.3% |
| Toccopola Voting District | 946 | 735 | 74.1% | 12.3% | 11.2% | 0.0% | $43k | 20.1% | 26.2% | 14.8% | 81.9% | 18.6% | 5.5% |
| Troy Voting District | 867 | 662 | 90.6% | 0.1% | 4.4% | 0.0% | $49k | 9.6% | 6.4% | 14.3% | 80.8% | 13.3% | 0.0% |
| Turnpike Voting District | 767 | 548 | 89.6% | 4.9% | 4.9% | 0.0% | $63k | 15.4% | 13.1% | 13.0% | 75.3% | 17.6% | 3.3% |
| Woodland Voting District | 448 | 271 | 96.7% | 0.9% | 0.8% | 0.0% | $52k | 22.6% | 13.5% | 6.9% | 84.3% | 25.9% | 0.8% |
| Zion Voting District | 961 | 816 | 72.3% | 18.1% | 6.5% | 0.0% | $47k | 14.2% | 11.8% | 19.2% | 69.2% | 7.3% | 13.0% |
Tate: 20 precincts
| Precinct | Population | Voting-age pop. | % White non-Hisp. | % Hispanic | % Black | % Asian | Median income* | % Bachelor's+ | % 18-29 (of adults) | % 65+ | % Homeowners | % Below poverty | % Spanish at home (adults) |
|---|---|---|---|---|---|---|---|---|---|---|---|---|---|
| Arkabutla Voting District | 1,314 | 1,177 | 67.3% | 0.0% | 30.4% | 0.1% | $66k | 21.6% | 20.0% | 25.4% | 71.1% | 18.6% | 0.0% |
| Coldwater Voting District | 2,577 | 2,131 | 43.2% | 9.4% | 44.4% | 0.0% | $68k | 14.0% | 23.8% | 21.1% | 77.1% | 19.1% | 7.6% |
| Evansville Voting District | 682 | 528 | 82.0% | 0.0% | 17.6% | 0.0% | $55k | 12.9% | 22.5% | 17.0% | 67.0% | 23.3% | 0.0% |
| Independence Voting District | 2,242 | 1,938 | 77.0% | 4.9% | 17.4% | 0.0% | $58k | 19.0% | 19.5% | 24.8% | 88.2% | 13.5% | 4.9% |
| Looxahoma Voting District | 1,755 | 1,334 | 55.0% | 1.0% | 36.1% | 0.0% | $85k | 24.5% | 13.6% | 18.4% | 95.0% | 7.8% | 0.3% |
| Palestine Voting District | 758 | 617 | 55.0% | 30.3% | 14.6% | 0.0% | $82k | 13.0% | 29.9% | 16.9% | 91.5% | 3.9% | 24.2% |
| Poagville 4 Voting District | 961 | 787 | 78.1% | 0.4% | 12.6% | 0.0% | $86k | 24.4% | 12.8% | 21.9% | 96.6% | 2.7% | 0.5% |
| Poagville 5 Voting District | 331 | 285 | 75.7% | 0.2% | 17.9% | 0.0% | $81k | 16.9% | 8.2% | 24.2% | 98.3% | 7.0% | 0.3% |
| Sarah Voting District | 876 | 574 | 100.0% | 0.0% | 0.0% | 0.0% | $82k | 15.2% | 23.3% | 10.5% | 83.7% | 20.3% | 0.0% |
| Senatobia 3 Voting District | 1,470 | 1,202 | 53.0% | 1.8% | 39.2% | 0.2% | $66k | 21.4% | 30.9% | 20.1% | 53.6% | 26.6% | 1.0% |
| Senatobia No.1 Voting District | 3,226 | 2,337 | 54.2% | 0.4% | 42.0% | 0.0% | $53k | 34.8% | 15.8% | 18.4% | 69.6% | 29.7% | 0.0% |
| Senatobia No.2 Voting District | 3,686 | 3,029 | 56.5% | 4.5% | 36.1% | 0.4% | $67k | 28.4% | 46.3% | 13.0% | 54.2% | 11.0% | 2.6% |
| Senatobia No.4 Voting District | 2,923 | 2,112 | 60.2% | 0.0% | 29.3% | 0.0% | $87k | 37.5% | 20.0% | 13.5% | 76.8% | 15.0% | 0.0% |
| Sherrod Voting District | 400 | 335 | 94.8% | 0.1% | 3.2% | 0.0% | $71k | 19.8% | 12.9% | 19.9% | 59.3% | 3.5% | 0.0% |
| Strayhorn 1 Voting District | 847 | 589 | 99.0% | 0.0% | 0.6% | 0.0% | $79k | 16.4% | 20.4% | 12.6% | 76.5% | 16.7% | 0.0% |
| Strayhorn 2 Voting District | 1,093 | 725 | 99.7% | 0.0% | 0.2% | 0.0% | $81k | 15.4% | 22.8% | 10.9% | 82.3% | 19.7% | 0.0% |
| Taylor Voting District | 305 | 260 | 78.0% | 0.0% | 17.9% | 0.1% | $113k | 34.1% | 17.8% | 25.3% | 96.7% | 8.2% | 0.0% |
| Thyatira Voting District | 838 | 609 | 57.8% | 3.0% | 38.0% | 0.0% | $70k | 10.9% | 12.1% | 10.3% | 80.2% | 20.3% | 0.2% |
| Tyro Voting District | 1,221 | 855 | 57.9% | 3.8% | 38.3% | 0.0% | $87k | 30.7% | 10.2% | 5.3% | 85.7% | 19.9% | 1.0% |
| Wyatte Voting District | 834 | 593 | 58.9% | 3.4% | 37.5% | 0.0% | $71k | 15.0% | 11.8% | 7.4% | 78.8% | 21.6% | 0.3% |
Union: 20 precincts
| Precinct | Population | Voting-age pop. | % White non-Hisp. | % Hispanic | % Black | % Asian | Median income* | % Bachelor's+ | % 18-29 (of adults) | % 65+ | % Homeowners | % Below poverty | % Spanish at home (adults) |
|---|---|---|---|---|---|---|---|---|---|---|---|---|---|
| B.F. Ford Voting District | 1,297 | 1,023 | 49.5% | 6.6% | 41.6% | 0.4% | $38k | 29.0% | 27.8% | 17.2% | 55.7% | 14.2% | 7.5% |
| Beacon Hill Voting District | 1,233 | 767 | 63.3% | 14.1% | 13.1% | 0.0% | $63k | 20.4% | 29.2% | 8.4% | 62.7% | 26.7% | 5.1% |
| Blue Springs Voting District | 1,359 | 853 | 86.0% | 3.1% | 9.3% | 0.0% | $66k | 16.7% | 14.1% | 16.2% | 77.4% | 18.9% | 0.9% |
| Blythe Voting District | 673 | 507 | 79.9% | 0.0% | 0.0% | 0.0% | $25k | 14.3% | 18.7% | 11.8% | 60.7% | 41.0% | 0.0% |
| Center Voting District | 734 | 526 | 89.6% | 4.4% | 0.2% | 0.2% | $55k | 26.0% | 14.5% | 23.6% | 98.5% | 0.9% | 4.4% |
| Central Maintenance Voting District | 1,655 | 1,329 | 77.1% | 9.0% | 4.4% | 1.0% | $55k | 14.2% | 18.4% | 24.8% | 88.6% | 10.7% | 6.6% |
| Courthouse Voting District | 2,258 | 1,668 | 63.1% | 4.7% | 23.8% | 0.6% | $55k | 21.0% | 21.2% | 12.2% | 53.8% | 13.6% | 4.6% |
| East Union Voting District | 2,533 | 1,836 | 82.9% | 0.3% | 15.7% | 0.0% | $56k | 15.8% | 13.5% | 13.4% | 86.2% | 24.4% | 0.0% |
| Glenfield Voting District | 1,993 | 1,508 | 60.1% | 7.8% | 30.4% | 0.0% | $76k | 22.2% | 19.1% | 21.5% | 64.2% | 9.8% | 8.1% |
| Imgomar Voting District | 1,580 | 1,185 | 86.9% | 0.0% | 5.2% | 0.6% | $65k | 19.3% | 18.2% | 13.5% | 81.4% | 12.9% | 1.1% |
| Jericho Voting District | 800 | 627 | 95.4% | 1.2% | 1.2% | 0.0% | $58k | 15.4% | 35.5% | 14.9% | 82.2% | 7.7% | 0.0% |
| Keownville Voting District | 1,073 | 863 | 77.3% | 16.0% | 1.8% | 0.0% | $59k | 12.5% | 24.5% | 16.7% | 92.5% | 6.1% | 16.4% |
| Kings Chapel Voting District | 1,058 | 688 | 63.3% | 12.9% | 13.5% | 0.2% | $67k | 18.8% | 29.3% | 7.0% | 60.6% | 26.5% | 5.0% |
| Macedonia Voting District | 635 | 498 | 85.6% | 0.0% | 0.5% | 0.0% | $44k | 16.9% | 15.4% | 18.1% | 68.8% | 28.0% | 0.0% |
| Myrtle Voting District | 2,230 | 1,650 | 73.6% | 0.0% | 25.2% | 0.0% | $77k | 16.4% | 24.7% | 16.9% | 70.6% | 7.2% | 0.1% |
| Northeast MS Community College Voting District | 1,482 | 1,193 | 66.4% | 13.0% | 15.8% | 1.6% | $51k | 12.9% | 15.9% | 18.6% | 79.7% | 14.6% | 8.0% |
| Pinedale Voting District | 939 | 760 | 97.2% | 1.2% | 0.7% | 0.0% | $62k | 17.3% | 17.1% | 22.1% | 91.3% | 11.8% | 0.7% |
| Pleasant Ridge Voting District | 1,057 | 831 | 94.5% | 0.7% | 3.0% | 0.0% | $55k | 15.6% | 24.7% | 17.3% | 83.2% | 11.6% | 0.0% |
| Sportsplex Voting District | 2,186 | 1,678 | 79.0% | 3.5% | 13.6% | 0.3% | $66k | 32.3% | 18.1% | 15.8% | 66.4% | 15.2% | 4.4% |
| West Union Voting District | 1,378 | 1,115 | 95.1% | 0.6% | 0.9% | 0.0% | $65k | 18.3% | 14.6% | 23.4% | 86.7% | 12.4% | 0.3% |
Prentiss: 15 precincts
| Precinct | Population | Voting-age pop. | % White non-Hisp. | % Hispanic | % Black | % Asian | Median income* | % Bachelor's+ | % 18-29 (of adults) | % 65+ | % Homeowners | % Below poverty | % Spanish at home (adults) |
|---|---|---|---|---|---|---|---|---|---|---|---|---|---|
| Baldwyn Voting District | 2,375 | 1,706 | 52.9% | 0.6% | 33.5% | 1.6% | $48k | 13.8% | 17.2% | 15.6% | 64.5% | 19.9% | 0.0% |
| Blackland Voting District | 1,142 | 905 | 91.5% | 0.6% | 2.5% | 0.0% | $64k | 16.3% | 25.3% | 13.5% | 71.2% | 17.3% | 0.4% |
| Booneville Voting District | 3,154 | 2,493 | 74.5% | 3.0% | 17.6% | 0.1% | $57k | 19.6% | 29.1% | 15.4% | 70.6% | 18.6% | 0.4% |
| Crossroads Voting District | 1,061 | 884 | 95.5% | 3.1% | 1.1% | 0.0% | $81k | 20.4% | 30.4% | 13.0% | 73.7% | 12.3% | 0.0% |
| East Booneville Voting District | 1,912 | 1,507 | 76.5% | 1.7% | 9.2% | 3.7% | $51k | 14.6% | 17.3% | 15.8% | 68.9% | 23.6% | 0.2% |
| Hills Chapel-New Hope Voting District | 2,382 | 1,735 | 92.6% | 0.5% | 0.2% | 0.1% | $46k | 16.5% | 18.2% | 17.0% | 94.4% | 11.2% | 0.0% |
| Ingram Voting District | 747 | 541 | 78.5% | 0.5% | 9.3% | 0.5% | $64k | 20.2% | 22.6% | 14.3% | 83.1% | 20.2% | 0.6% |
| Marietta Voting District | 1,102 | 905 | 96.6% | 1.5% | 0.9% | 0.0% | $58k | 18.4% | 13.9% | 33.2% | 92.8% | 13.3% | 0.0% |
| New Site Voting District | 958 | 750 | 95.8% | 2.8% | 0.1% | 0.0% | $50k | 13.5% | 25.6% | 16.9% | 93.4% | 5.5% | 0.0% |
| North Booneville Voting District | 1,586 | 1,334 | 51.6% | 4.0% | 37.4% | 0.1% | $44k | 13.0% | 49.9% | 12.8% | 46.4% | 19.9% | 0.2% |
| Odom Hill Voting District | 729 | 552 | 94.0% | 0.0% | 0.0% | 0.0% | $40k | 13.9% | 19.0% | 23.5% | 90.0% | 24.9% | 0.0% |
| Thrasher Voting District | 1,241 | 929 | 82.4% | 0.0% | 16.7% | 0.3% | $63k | 26.5% | 13.5% | 20.9% | 87.3% | 14.1% | 0.0% |
| Tuscumbia-New Chandler Voting District | 1,316 | 1,013 | 95.0% | 0.4% | 0.5% | 0.0% | $36k | 5.4% | 24.8% | 20.5% | 71.3% | 32.3% | 0.0% |
| West Booneville Voting District | 3,445 | 2,811 | 76.8% | 1.2% | 18.2% | 0.3% | $66k | 41.1% | 20.3% | 18.4% | 84.4% | 7.8% | 0.9% |
| Wheeler Voting District | 2,075 | 1,567 | 82.3% | 1.6% | 7.8% | 0.1% | $66k | 12.0% | 19.7% | 17.9% | 81.4% | 20.4% | 0.2% |
Itawamba: 24 precincts
| Precinct | Population | Voting-age pop. | % White non-Hisp. | % Hispanic | % Black | % Asian | Median income* | % Bachelor's+ | % 18-29 (of adults) | % 65+ | % Homeowners | % Below poverty | % Spanish at home (adults) |
|---|---|---|---|---|---|---|---|---|---|---|---|---|---|
| Armory Voting District | 2,038 | 1,700 | 87.6% | 1.1% | 4.1% | 0.2% | $76k | 13.6% | 22.8% | 12.7% | 68.8% | 14.8% | 0.2% |
| Bigbee Fork/Evergreen Voting District | 873 | 622 | 85.4% | 0.0% | 14.3% | 0.0% | $70k | 9.1% | 14.5% | 13.4% | 83.3% | 28.3% | 1.9% |
| Bounds/Mt. Gilead Voting District | 530 | 456 | 93.8% | 1.0% | 0.0% | 0.0% | $32k | 13.4% | 33.7% | 22.0% | 74.5% | 23.9% | 0.2% |
| Cardsville Voting District | 220 | 174 | 100.0% | 0.0% | 0.0% | 0.0% | $105k | 13.0% | 21.8% | 7.9% | 91.5% | 8.1% | 0.0% |
| Carolina Voting District | 358 | 267 | 83.8% | 0.0% | 16.2% | 0.0% | $81k | 7.5% | 15.4% | 14.7% | 86.8% | 34.0% | 0.0% |
| Centerville Voting District | 695 | 549 | 92.6% | 2.7% | 0.8% | 0.0% | $75k | 11.5% | 21.7% | 11.8% | 81.6% | 12.6% | 0.3% |
| Clay Voting District | 1,948 | 1,589 | 94.5% | 1.0% | 1.1% | 0.0% | $83k | 27.6% | 18.3% | 25.7% | 84.7% | 5.0% | 0.4% |
| Copeland Voting District | 1,068 | 794 | 93.4% | 0.7% | 0.0% | 4.6% | $58k | 18.9% | 22.1% | 17.3% | 83.3% | 16.4% | 0.0% |
| Dorsey Voting District | 1,070 | 718 | 83.9% | 3.5% | 7.6% | 0.0% | $65k | 14.4% | 16.5% | 15.8% | 77.8% | 16.1% | 2.8% |
| Fawn Grove Voting District | 878 | 603 | 81.1% | 8.3% | 0.0% | 0.0% | $88k | 18.4% | 21.9% | 20.8% | 79.7% | 9.7% | 0.0% |
| Friendship Voting District | 952 | 744 | 82.0% | 7.3% | 1.9% | 0.0% | $59k | 10.9% | 13.3% | 15.9% | 74.7% | 11.1% | 0.7% |
| Fulton Dist.1 Courthouse | 996 | 818 | 88.1% | 0.2% | 9.7% | 0.7% | $95k | 14.2% | 37.6% | 8.5% | 80.1% | 16.2% | 0.0% |
| Fulton Dist.4 Am. Legion | 2,654 | 2,216 | 85.1% | 0.2% | 8.8% | 0.0% | $64k | 21.4% | 28.3% | 18.3% | 74.8% | 21.1% | 1.6% |
| Fulton Dist.5 Firestation | 1,183 | 1,028 | 67.7% | 1.4% | 24.1% | 0.0% | $66k | 18.0% | 48.1% | 12.9% | 57.0% | 16.3% | 0.3% |
| Greenwood Voting District | 1,409 | 933 | 86.4% | 0.0% | 12.8% | 0.0% | $51k | 11.1% | 12.6% | 12.1% | 77.0% | 21.4% | 4.8% |
| Hampton/James Creek/Turon Voting District | 856 | 682 | 95.9% | 0.0% | 0.6% | 0.0% | $60k | 16.4% | 24.2% | 24.3% | 84.8% | 9.1% | 0.0% |
| Kirkville/Ozark Voting District | 992 | 826 | 94.6% | 3.9% | 0.0% | 0.0% | $48k | 10.0% | 15.5% | 28.9% | 93.0% | 17.3% | 1.6% |
| Mantachie Voting District | 1,745 | 1,370 | 84.7% | 6.1% | 1.6% | 0.0% | $62k | 10.9% | 15.7% | 14.9% | 76.2% | 11.7% | 0.6% |
| New Salem/Tilden Voting District | 461 | 368 | 87.6% | 0.3% | 3.1% | 0.0% | $67k | 34.4% | 11.6% | 23.4% | 87.4% | 6.7% | 0.2% |
| Pineville Voting District | 984 | 820 | 98.5% | 0.0% | 0.0% | 0.0% | $30k | 11.5% | 25.7% | 24.2% | 82.6% | 22.8% | 0.0% |
| Pleasanton Voting District | 261 | 215 | 88.4% | 1.7% | 0.0% | 1.5% | $48k | 18.1% | 25.6% | 18.1% | 68.9% | 17.0% | 0.3% |
| Ratliff Voting District | 497 | 396 | 98.8% | 0.0% | 0.1% | 0.0% | $85k | 11.9% | 26.4% | 9.3% | 86.2% | 13.4% | 0.0% |
| Ryan Voting District | 806 | 586 | 91.1% | 2.2% | 0.0% | 5.9% | $72k | 19.9% | 21.9% | 17.6% | 87.4% | 14.9% | 0.7% |
| Wigginton/Oakland/Tremont Voting District | 550 | 442 | 98.5% | 0.0% | 0.0% | 0.0% | $56k | 12.1% | 28.0% | 24.5% | 84.4% | 11.4% | 0.0% |
Tippah: 24 precincts
| Precinct | Population | Voting-age pop. | % White non-Hisp. | % Hispanic | % Black | % Asian | Median income* | % Bachelor's+ | % 18-29 (of adults) | % 65+ | % Homeowners | % Below poverty | % Spanish at home (adults) |
|---|---|---|---|---|---|---|---|---|---|---|---|---|---|
| Blue Mountain Voting District | 1,955 | 1,603 | 50.0% | 13.1% | 28.3% | 1.6% | $45k | 7.9% | 36.8% | 14.1% | 76.8% | 16.9% | 8.7% |
| Brownfield Voting District | 359 | 270 | 81.1% | 1.6% | 10.8% | 0.0% | $32k | 7.1% | 19.8% | 12.0% | 55.2% | 32.0% | 3.0% |
| Chalybeate Voting District | 1,136 | 829 | 86.5% | 3.4% | 6.8% | 0.0% | $37k | 11.7% | 15.4% | 15.2% | 67.5% | 30.0% | 2.6% |
| Chapman Voting District | 776 | 495 | 97.6% | 0.0% | 2.0% | 0.0% | $39k | 5.9% | 5.8% | 13.2% | 90.3% | 44.4% | 0.0% |
| Clarysville Voting District | 399 | 313 | 99.7% | 0.1% | 0.1% | 0.0% | $48k | 14.6% | 13.7% | 21.7% | 63.5% | 8.7% | 0.2% |
| Cotton Plant Voting District | 783 | 651 | 49.9% | 2.5% | 40.6% | 0.4% | $42k | 6.7% | 13.5% | 24.8% | 67.4% | 12.4% | 2.3% |
| Dry Creek Voting District | 358 | 327 | 98.1% | 0.0% | 0.2% | 0.0% | $54k | 5.7% | 3.6% | 16.8% | 90.3% | 13.0% | 0.0% |
| Dumas Voting District | 766 | 583 | 99.2% | 0.0% | 0.0% | 0.0% | $52k | 13.9% | 15.3% | 18.2% | 64.4% | 13.8% | 0.2% |
| Falkner Voting District | 1,595 | 1,168 | 74.6% | 2.9% | 21.4% | 0.0% | $82k | 19.8% | 18.1% | 12.7% | 88.6% | 9.2% | 3.3% |
| Mitchell Voting District | 437 | 263 | 96.4% | 0.0% | 0.0% | 0.0% | $74k | 14.7% | 29.7% | 2.7% | 56.0% | 38.9% | 0.0% |
| New Hope Voting District | 864 | 684 | 76.8% | 7.0% | 10.2% | 0.0% | $70k | 32.7% | 18.2% | 28.6% | 71.0% | 18.5% | 3.8% |
| North Falkner Voting District | 417 | 285 | 64.2% | 2.7% | 31.5% | 0.0% | $87k | 22.7% | 17.3% | 12.8% | 95.2% | 3.7% | 3.1% |
| North Ripley Voting District | 2,506 | 1,967 | 76.3% | 8.2% | 12.9% | 0.0% | $56k | 19.6% | 14.6% | 20.9% | 77.8% | 12.8% | 6.0% |
| Palmer Voting District | 943 | 735 | 68.1% | 15.2% | 8.2% | 0.2% | $63k | 25.0% | 26.5% | 22.2% | 72.6% | 25.2% | 9.4% |
| Peoples Voting District | 338 | 278 | 89.9% | 0.0% | 5.1% | 0.0% | $36k | 29.8% | 34.1% | 14.5% | 80.9% | 26.1% | 0.0% |
| Pine Grove Voting District | 264 | 203 | 97.4% | 0.0% | 0.1% | 0.0% | $60k | 8.2% | 12.7% | 10.2% | 80.4% | 25.1% | 0.0% |
| Providence Voting District | 898 | 711 | 83.7% | 2.5% | 11.3% | 0.0% | $45k | 25.8% | 22.9% | 17.9% | 82.3% | 22.5% | 1.4% |
| Ripley Voting District | 1,570 | 1,222 | 79.5% | 3.0% | 13.9% | 0.0% | $49k | 18.9% | 19.8% | 25.2% | 67.1% | 18.7% | 2.0% |
| S.W. Ripley Voting District | 1,993 | 1,592 | 66.0% | 11.1% | 16.7% | 0.0% | $69k | 23.1% | 19.3% | 22.5% | 56.4% | 20.8% | 7.9% |
| Shady Grove Voting District | 141 | 109 | 84.6% | 7.0% | 1.8% | 0.3% | $67k | 19.7% | 23.5% | 11.2% | 96.8% | 10.4% | 3.3% |
| Spout Springs Voting District | 769 | 601 | 91.7% | 0.0% | 4.3% | 0.0% | $36k | 25.2% | 29.1% | 14.2% | 82.8% | 30.4% | 0.0% |
| Threeforks Voting District | 363 | 263 | 70.1% | 0.0% | 2.0% | 0.0% | $36k | 21.6% | 29.1% | 5.8% | 98.7% | 7.2% | 0.0% |
| Tiplersville Voting District | 1,192 | 768 | 70.8% | 2.6% | 22.9% | 0.0% | $77k | 19.0% | 18.2% | 10.0% | 92.0% | 7.2% | 2.7% |
| Walnut Voting District | 657 | 487 | 77.9% | 1.2% | 7.3% | 0.0% | $34k | 12.3% | 22.6% | 10.2% | 70.7% | 23.4% | 1.9% |
Tishomingo: 14 precincts
| Precinct | Population | Voting-age pop. | % White non-Hisp. | % Hispanic | % Black | % Asian | Median income* | % Bachelor's+ | % 18-29 (of adults) | % 65+ | % Homeowners | % Below poverty | % Spanish at home (adults) |
|---|---|---|---|---|---|---|---|---|---|---|---|---|---|
| Belmont Voting District | 2,046 | 1,459 | 87.3% | 8.0% | 0.0% | 0.8% | $58k | 12.7% | 21.0% | 15.8% | 77.1% | 16.8% | 6.1% |
| Burnsville Voting District | 1,720 | 1,296 | 92.6% | 0.2% | 1.1% | 0.0% | $60k | 18.0% | 21.3% | 24.1% | 76.7% | 10.8% | 0.4% |
| Coles Mill Voting District | 1,110 | 867 | 96.2% | 2.1% | 0.0% | 0.0% | $51k | 29.0% | 3.2% | 30.2% | 91.6% | 16.7% | 1.4% |
| Cotton Springs Voting District | 847 | 592 | 85.1% | 10.6% | 0.1% | 0.9% | $47k | 10.6% | 29.7% | 15.3% | 90.8% | 30.3% | 6.0% |
| Dennis Voting District | 176 | 131 | 89.6% | 7.1% | 0.1% | 1.1% | $53k | 15.0% | 28.2% | 12.8% | 85.5% | 20.3% | 3.7% |
| East Iuka Voting District | 1,952 | 1,510 | 93.5% | 0.2% | 1.7% | 0.0% | $73k | 25.1% | 15.8% | 20.5% | 79.2% | 16.4% | 0.1% |
| Golden Voting District | 1,614 | 1,204 | 84.8% | 11.8% | 0.0% | 1.9% | $58k | 10.8% | 18.1% | 13.8% | 68.2% | 14.1% | 12.9% |
| Hubbard-Salem Voting District | 402 | 368 | 89.4% | 0.1% | 0.0% | 0.0% | $34k | 33.2% | 6.4% | 31.1% | 96.6% | 30.7% | 0.1% |
| Luka Voting District | 3,849 | 3,068 | 94.7% | 0.6% | 0.8% | 0.0% | $45k | 15.2% | 11.1% | 23.8% | 75.0% | 22.8% | 0.8% |
| North Belmont Voting District | 507 | 346 | 86.8% | 6.0% | 0.0% | 0.2% | $61k | 12.7% | 17.9% | 19.8% | 78.7% | 16.4% | 3.0% |
| North Burnsville Voting District | 1,170 | 947 | 89.5% | 0.3% | 2.2% | 0.0% | $44k | 10.5% | 13.4% | 24.3% | 75.3% | 26.9% | 0.2% |
| Paden Voting District | 702 | 659 | 85.9% | 1.4% | 0.6% | 3.7% | $74k | 20.3% | 23.0% | 20.7% | 91.1% | 12.3% | 0.9% |
| Spring Hill Voting District | 1,107 | 928 | 95.0% | 1.8% | 0.5% | 0.0% | $70k | 25.5% | 17.2% | 20.6% | 95.0% | 5.4% | 0.6% |
| Tishomingo Voting District | 1,463 | 1,274 | 82.3% | 2.0% | 6.5% | 1.6% | $49k | 18.5% | 17.8% | 20.7% | 76.9% | 17.6% | 0.4% |
Clay: 14 precincts
| Precinct | Population | Voting-age pop. | % White non-Hisp. | % Hispanic | % Black | % Asian | Median income* | % Bachelor's+ | % 18-29 (of adults) | % 65+ | % Homeowners | % Below poverty | % Spanish at home (adults) |
|---|---|---|---|---|---|---|---|---|---|---|---|---|---|
| Cairo Voting District | 757 | 583 | 41.8% | 0.5% | 44.3% | 0.1% | $55k | 24.8% | 10.8% | 23.4% | 91.4% | 19.9% | 1.3% |
| Caradine Voting District | 1,155 | 894 | 23.8% | 0.2% | 70.6% | 0.0% | $58k | 9.6% | 15.3% | 10.9% | 96.3% | 12.2% | 0.5% |
| Cedar Bluff Voting District | 379 | 318 | 64.9% | 0.8% | 33.4% | 0.0% | $47k | 16.2% | 30.3% | 18.9% | 68.4% | 20.3% | 1.0% |
| Central West Point Voting District | 1,004 | 828 | 33.5% | 0.3% | 65.3% | 0.1% | $44k | 16.3% | 18.4% | 19.2% | 58.0% | 26.9% | 0.1% |
| East West Point Voting District | 1,822 | 1,626 | 61.5% | 0.0% | 34.9% | 0.3% | $61k | 33.6% | 16.3% | 33.2% | 76.1% | 10.2% | 0.2% |
| North West Point Voting District | 4,151 | 2,925 | 26.0% | 0.0% | 72.5% | 0.0% | $39k | 11.2% | 22.2% | 17.8% | 63.1% | 30.3% | 0.2% |
| Pheba Voting District | 653 | 609 | 60.2% | 2.0% | 35.9% | 0.0% | $51k | 22.3% | 26.6% | 19.1% | 78.8% | 18.6% | 2.1% |
| Pine Bluff Voting District | 422 | 324 | 42.6% | 0.5% | 42.7% | 0.0% | $55k | 25.9% | 10.4% | 24.4% | 91.2% | 20.2% | 1.4% |
| Siloam Voting District | 1,264 | 1,037 | 51.9% | 0.0% | 47.0% | 1.0% | $42k | 8.5% | 23.6% | 12.4% | 76.7% | 21.1% | 0.0% |
| South West Point Voting District | 1,438 | 1,169 | 23.6% | 0.6% | 75.0% | 0.0% | $55k | 18.2% | 28.0% | 20.0% | 60.3% | 14.3% | 0.2% |
| Tibbee Voting District | 710 | 543 | 66.2% | 0.1% | 30.9% | 0.0% | $57k | 32.7% | 28.8% | 19.9% | 76.3% | 6.3% | 0.0% |
| Union Star Voting District | 1,482 | 1,054 | 42.1% | 0.0% | 54.8% | 0.0% | $54k | 16.2% | 5.3% | 27.3% | 82.5% | 14.8% | 0.0% |
| Vinton Voting District | 898 | 688 | 29.8% | 0.0% | 68.7% | 0.0% | $57k | 28.9% | 3.5% | 21.6% | 70.6% | 15.4% | 0.0% |
| West West Point Voting District | 2,235 | 1,628 | 20.9% | 0.0% | 77.6% | 0.0% | $36k | 6.1% | 20.3% | 13.6% | 60.1% | 29.9% | 0.1% |
Chickasaw: 15 precincts
| Precinct | Population | Voting-age pop. | % White non-Hisp. | % Hispanic | % Black | % Asian | Median income* | % Bachelor's+ | % 18-29 (of adults) | % 65+ | % Homeowners | % Below poverty | % Spanish at home (adults) |
|---|---|---|---|---|---|---|---|---|---|---|---|---|---|
| Anchor Voting District | 1,672 | 1,306 | 52.8% | 0.8% | 44.2% | 1.6% | $58k | 17.9% | 24.4% | 15.0% | 75.0% | 11.4% | 0.4% |
| Buena Vista Voting District | 960 | 709 | 47.0% | 3.3% | 49.1% | 0.0% | $50k | 12.1% | 20.8% | 18.7% | 82.0% | 19.1% | 0.0% |
| East Okolona Voting District | 1,951 | 1,508 | 23.5% | 0.0% | 75.5% | 0.0% | $31k | 9.1% | 24.1% | 19.0% | 52.9% | 38.9% | 0.0% |
| Egypt Voting District | 485 | 420 | 28.2% | 0.0% | 71.4% | 0.0% | $50k | 15.1% | 19.6% | 13.6% | 73.7% | 5.9% | 0.0% |
| North Houlka Voting District | 701 | 504 | 58.7% | 2.5% | 36.6% | 0.0% | $45k | 9.8% | 14.1% | 19.0% | 72.7% | 27.3% | 1.2% |
| North Okolona Voting District | 791 | 589 | 37.1% | 0.0% | 61.8% | 0.0% | $37k | 4.7% | 17.8% | 21.1% | 88.7% | 20.2% | 0.0% |
| Northwest Houston Voting District | 2,484 | 1,948 | 49.9% | 1.5% | 45.0% | 0.2% | $44k | 11.9% | 18.0% | 20.7% | 58.1% | 29.7% | 4.2% |
| Pearsall Voting District | 555 | 383 | 74.4% | 0.4% | 24.2% | 0.8% | $60k | 15.4% | 13.0% | 20.7% | 90.2% | 11.0% | 0.2% |
| Pleasant Grove Voting District | 1,894 | 1,371 | 65.0% | 0.5% | 33.4% | 0.8% | $52k | 14.7% | 20.0% | 15.8% | 84.1% | 16.7% | 0.2% |
| South Houlka Voting District | 1,331 | 931 | 63.6% | 1.6% | 32.5% | 0.0% | $44k | 9.4% | 15.8% | 17.8% | 77.1% | 26.5% | 0.4% |
| Southeast Houston Voting District | 1,441 | 1,097 | 52.4% | 2.3% | 42.2% | 0.6% | $51k | 22.0% | 24.9% | 22.0% | 69.3% | 22.4% | 2.2% |
| Sparta Voting District | 448 | 284 | 81.8% | 0.1% | 18.1% | 0.0% | $47k | 9.6% | 0.1% | 24.7% | 91.4% | 13.5% | 0.1% |
| Van Vleet Voting District | 562 | 418 | 56.7% | 3.2% | 39.4% | 0.0% | $51k | 11.0% | 9.2% | 21.2% | 74.2% | 25.8% | 2.3% |
| West Okolona Voting District | 1,266 | 974 | 31.4% | 0.1% | 67.8% | 0.0% | $34k | 5.9% | 29.2% | 15.4% | 54.6% | 33.0% | 0.0% |
| Woodland Voting District | 388 | 286 | 43.2% | 0.6% | 56.2% | 0.0% | $47k | 0.2% | 0.4% | 21.1% | 59.4% | 21.9% | 0.4% |
Calhoun: 10 precincts
| Precinct | Population | Voting-age pop. | % White non-Hisp. | % Hispanic | % Black | % Asian | Median income* | % Bachelor's+ | % 18-29 (of adults) | % 65+ | % Homeowners | % Below poverty | % Spanish at home (adults) |
|---|---|---|---|---|---|---|---|---|---|---|---|---|---|
| Banner Voting District | 826 | 682 | 88.6% | 2.1% | 4.4% | 0.2% | $58k | 10.9% | 16.1% | 22.6% | 91.2% | 9.3% | 0.0% |
| Bruce 1 Voting District | 1,348 | 1,065 | 55.8% | 3.7% | 39.1% | 0.1% | $44k | 11.2% | 25.4% | 19.0% | 58.8% | 23.2% | 1.9% |
| Bruce 3 Voting District | 1,274 | 941 | 68.4% | 0.1% | 27.8% | 0.7% | $48k | 19.1% | 13.4% | 16.7% | 64.7% | 25.6% | 0.0% |
| Calhoun City 1 Voting District | 1,691 | 1,260 | 52.4% | 4.1% | 42.9% | 0.0% | $40k | 9.2% | 16.3% | 19.6% | 60.9% | 27.3% | 3.0% |
| Calhoun City 4 Voting District | 1,932 | 1,598 | 73.5% | 0.6% | 22.7% | 0.0% | $47k | 11.1% | 11.5% | 26.5% | 77.8% | 17.7% | 0.4% |
| Derma 5 Voting District | 745 | 579 | 73.2% | 3.0% | 23.1% | 0.0% | $47k | 17.5% | 21.9% | 19.6% | 72.4% | 13.9% | 1.8% |
| NE Calhoun Voting District | 1,138 | 913 | 62.9% | 1.3% | 28.7% | 0.0% | $45k | 8.4% | 19.0% | 23.9% | 72.8% | 12.8% | 0.0% |
| Pittsboro Voting District | 1,360 | 1,113 | 74.4% | 2.0% | 16.5% | 0.0% | $44k | 10.0% | 18.9% | 22.9% | 81.0% | 11.9% | 0.6% |
| Slate Springs Voting District | 933 | 729 | 51.7% | 6.5% | 33.7% | 0.0% | $46k | 13.4% | 15.8% | 22.1% | 65.0% | 23.3% | 4.7% |
| Vardaman Voting District | 1,667 | 1,175 | 48.4% | 32.3% | 17.5% | 0.0% | $42k | 13.4% | 21.2% | 15.0% | 75.8% | 29.4% | 17.5% |
Webster: 17 precincts
| Precinct | Population | Voting-age pop. | % White non-Hisp. | % Hispanic | % Black | % Asian | Median income* | % Bachelor's+ | % 18-29 (of adults) | % 65+ | % Homeowners | % Below poverty | % Spanish at home (adults) |
|---|---|---|---|---|---|---|---|---|---|---|---|---|---|
| Bellefontaine Voting District | 416 | 328 | 88.4% | 0.1% | 11.1% | 0.3% | $64k | 21.5% | 21.3% | 21.6% | 75.1% | 4.4% | 0.0% |
| Big Black Voting District | 420 | 323 | 79.8% | 0.0% | 20.1% | 0.0% | $71k | 23.1% | 26.9% | 14.3% | 86.4% | 12.7% | 0.0% |
| Bluff Springs Voting District | 1,089 | 815 | 74.1% | 0.0% | 24.6% | 0.1% | $65k | 25.5% | 17.2% | 23.0% | 81.9% | 17.8% | 0.0% |
| Cadaretta Voting District | 291 | 227 | 80.2% | 0.0% | 19.1% | 0.2% | $65k | 23.7% | 21.8% | 24.1% | 75.9% | 9.1% | 0.0% |
| Clarkson Voting District | 543 | 397 | 97.2% | 0.4% | 2.0% | 0.0% | $64k | 17.5% | 5.0% | 12.3% | 88.2% | 7.2% | 0.0% |
| Cumberland Voting District | 624 | 474 | 84.7% | 0.1% | 15.0% | 0.0% | $69k | 21.4% | 21.0% | 13.7% | 86.9% | 11.1% | 0.0% |
| Eupora 1 Voting District | 1,167 | 914 | 48.3% | 0.1% | 49.4% | 0.0% | $67k | 17.1% | 24.3% | 23.0% | 66.7% | 16.3% | 0.2% |
| Eupora 2 Voting District | 634 | 487 | 74.0% | 0.1% | 24.2% | 0.0% | $69k | 19.9% | 16.9% | 19.7% | 70.8% | 20.5% | 0.2% |
| Eupora 3 Voting District | 593 | 468 | 65.0% | 0.2% | 30.5% | 0.0% | $42k | 13.9% | 7.8% | 25.2% | 40.4% | 37.6% | 0.5% |
| Fame Voting District | 648 | 475 | 97.3% | 0.4% | 1.9% | 0.0% | $64k | 17.4% | 4.9% | 12.3% | 88.2% | 7.2% | 0.0% |
| Fay Voting District | 260 | 201 | 95.1% | 0.0% | 2.8% | 1.3% | $41k | 28.4% | 34.0% | 15.2% | 77.1% | 28.0% | 0.0% |
| Grady Voting District | 437 | 330 | 80.5% | 0.0% | 18.0% | 0.5% | $58k | 26.5% | 22.4% | 20.4% | 80.9% | 21.5% | 0.0% |
| Maben Voting District | 880 | 646 | 73.4% | 8.9% | 15.5% | 0.8% | $62k | 23.0% | 20.5% | 15.6% | 74.3% | 18.7% | 3.4% |
| Mantee Voting District | 777 | 570 | 96.7% | 0.4% | 2.5% | 0.0% | $64k | 17.6% | 5.6% | 12.4% | 88.2% | 7.3% | 0.0% |
| Mathiston Voting District | 709 | 507 | 69.6% | 14.3% | 12.7% | 1.3% | $57k | 22.9% | 16.4% | 16.3% | 67.3% | 22.3% | 5.6% |
| Tomnolen Voting District | 303 | 234 | 95.2% | 0.0% | 2.8% | 1.3% | $41k | 28.3% | 34.0% | 15.2% | 77.1% | 28.0% | 0.0% |
| Walthall Voting District | 173 | 131 | 75.1% | 0.0% | 23.9% | 0.1% | $66k | 24.7% | 17.9% | 23.8% | 80.0% | 14.2% | 0.0% |
Choctaw: 13 precincts
| Precinct | Population | Voting-age pop. | % White non-Hisp. | % Hispanic | % Black | % Asian | Median income* | % Bachelor's+ | % 18-29 (of adults) | % 65+ | % Homeowners | % Below poverty | % Spanish at home (adults) |
|---|---|---|---|---|---|---|---|---|---|---|---|---|---|
| Byway Voting District | 377 | 309 | 90.5% | 0.0% | 6.0% | 0.0% | $60k | 25.1% | 15.0% | 26.8% | 91.7% | 14.2% | 0.2% |
| Chester Voting District | 593 | 488 | 74.3% | 0.0% | 17.0% | 0.0% | $56k | 19.3% | 22.1% | 22.9% | 87.4% | 19.3% | 1.9% |
| District 5 | 1,853 | 1,455 | 64.9% | 3.0% | 30.5% | 0.0% | $45k | 15.8% | 9.2% | 24.7% | 66.2% | 18.9% | 0.7% |
| East Weir Voting District | 473 | 383 | 55.3% | 2.1% | 40.9% | 0.0% | $46k | 21.0% | 13.9% | 22.0% | 80.8% | 16.7% | 1.8% |
| Fentress Voting District | 372 | 307 | 67.6% | 0.8% | 23.6% | 0.0% | $51k | 16.3% | 20.0% | 23.3% | 80.1% | 23.5% | 1.9% |
| French Camp Voting District | 632 | 507 | 46.4% | 1.8% | 43.6% | 7.2% | $38k | 20.2% | 29.0% | 26.6% | 81.3% | 25.9% | 1.4% |
| Hebron Voting District | 290 | 232 | 92.0% | 0.0% | 7.9% | 0.0% | $59k | 19.5% | 29.1% | 22.4% | 80.4% | 29.6% | 0.0% |
| Kenego Voting District | 687 | 563 | 81.6% | 0.4% | 13.3% | 1.7% | $55k | 25.8% | 14.5% | 28.1% | 91.4% | 13.4% | 0.3% |
| Panhandle Voting District | 828 | 680 | 46.7% | 1.5% | 50.0% | 0.0% | $43k | 21.9% | 15.3% | 21.0% | 82.4% | 19.9% | 1.8% |
| Reform Voting District | 483 | 346 | 93.3% | 4.8% | 1.0% | 0.0% | $74k | 23.7% | 9.0% | 21.5% | 90.1% | 13.0% | 1.7% |
| SW Ackerman Voting District | 688 | 473 | 50.1% | 0.9% | 48.4% | 0.0% | $43k | 19.2% | 19.4% | 15.4% | 67.5% | 12.4% | 0.3% |
| Sherwood Voting District | 467 | 331 | 93.2% | 5.1% | 1.2% | 0.0% | $75k | 22.7% | 11.0% | 20.6% | 88.5% | 15.0% | 1.9% |
| West Weir Voting District | 381 | 309 | 53.8% | 1.2% | 36.6% | 4.6% | $44k | 19.2% | 27.1% | 24.7% | 82.9% | 24.3% | 1.8% |
Benton: 5 precincts
| Precinct | Population | Voting-age pop. | % White non-Hisp. | % Hispanic | % Black | % Asian | Median income* | % Bachelor's+ | % 18-29 (of adults) | % 65+ | % Homeowners | % Below poverty | % Spanish at home (adults) |
|---|---|---|---|---|---|---|---|---|---|---|---|---|---|
| Ashland Voting District | 1,234 | 985 | 62.3% | 1.2% | 32.4% | 0.8% | $49k | 13.8% | 10.3% | 26.2% | 90.1% | 20.2% | 0.9% |
| Canaan Voting District | 1,405 | 1,126 | 42.2% | 1.6% | 55.1% | 0.0% | $57k | 9.4% | 8.6% | 16.4% | 95.4% | 26.6% | 0.7% |
| Floyd Voting District | 1,973 | 1,463 | 74.8% | 0.6% | 21.4% | 0.7% | $46k | 12.8% | 11.1% | 25.0% | 94.6% | 23.1% | 0.4% |
| Hickory Flat Voting District | 1,622 | 1,316 | 89.6% | 2.1% | 5.0% | 0.0% | $38k | 10.0% | 14.5% | 20.4% | 70.3% | 15.9% | 0.6% |
| Lamar Voting District | 1,351 | 1,096 | 21.5% | 7.4% | 69.3% | 0.1% | $44k | 19.9% | 26.9% | 15.9% | 81.0% | 21.9% | 7.1% |
Oktibbeha: 3 precincts
| Precinct | Population | Voting-age pop. | % White non-Hisp. | % Hispanic | % Black | % Asian | Median income* | % Bachelor's+ | % 18-29 (of adults) | % 65+ | % Homeowners | % Below poverty | % Spanish at home (adults) |
|---|---|---|---|---|---|---|---|---|---|---|---|---|---|
| Maben Voting District | 394 | 260 | 49.0% | 0.0% | 29.3% | 0.0% | $45k | 33.1% | 10.7% | 22.9% | 70.7% | 15.6% | 0.0% |
| Self Creek/Double Springs Voting District | 1,456 | 953 | 84.1% | 4.6% | 0.8% | 0.0% | $49k | 25.8% | 5.1% | 19.0% | 99.8% | 14.5% | 0.5% |
| Sturgis/North Bradley Voting District | 1,345 | 1,159 | 62.6% | 0.2% | 35.6% | 0.1% | $55k | 42.5% | 17.3% | 37.3% | 78.7% | 11.2% | 0.0% |
*Median income is approximate (see note above). ACS 2020-2024 5-year.
Nonpartisan voter information. GOTV Polling does not endorse any candidate.