
Mississippi's 2nd Congressional District
U.S. House · Mississippi · District 2 · General election: Tuesday, November 3, 2026
Candidates on the November 3 ballot
- Ron EllerRepublican
- Bennie FosterIndependent
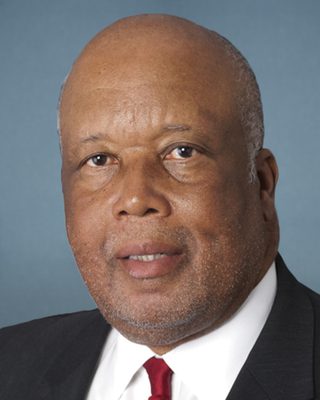 Bennie G. ThompsonDemocraticPhoto: U.S. Congress
Source: Mississippi Secretary of State, Candidate Qualifying List, November 3, 2026 General Election, certified list (list retrieved 2026-10-30; retrieved 2026-10-30). Order of names does not reflect ballot order. Incumbent tags appear only where the official list marks incumbents. Photos come from the Candidate Alerts database where one is on file; otherwise initials are shown.
Federal campaign finance filings for this seat: FEC election page (FEC registration is not the same as ballot qualification).
Certified candidates
- Bennie G. Thompson DemocraticIncumbent @BennieGThompson
- Ron Eller Republican
Certified candidate list from Candidate Alerts, as of 2026-09-24, based on Mississippi Secretary of State. Includes candidates the database marks as on the November 3 ballot. Incumbent tags here follow the database.
Past election results
Demographics
2020 Census demographics by district are not yet published in this data set.
0 of 591 precincts are above 50%, and 1 are above 25%. Source: Census American Community Survey 2020-2024 5-year block groups, allocated to current precinct shapes by area.
Poll status
Map
Share of adults (18+) who speak Spanish at home, by precinct. Census ACS 2020-2024 5-year estimates on the current precinct layer. Hover a precinct for its value.
District shown in red: U.S. Census Bureau cartographic boundary file for the 119th Congress (cb_2024_us_cd119_500k). These are the lines in effect for 2026 in this state per the Candidate Alerts district registry.
Precinct map: past elections and demographics
Choose a layer above. Hover a precinct for its values.
Precinct results
Precinct demographics
Demographics are Census American Community Survey (ACS) 2020-2024 5-year estimates for block groups, assigned to precincts by area share. They describe the resident population, not registered or likely voters, and include non-citizens. ACS margins of error are not shown; small precincts carry large error. Area weighting assumes people are spread evenly within each block group, so large rural precincts are the least reliable. Median income is a household-weighted average of block-group medians, an approximation.
| Area | Population | Voting-age pop. | % White non-Hisp. | % Hispanic | % Black | % Asian | Median income* | % Bachelor's+ | % 18-29 (of adults) | % 65+ | % Homeowners | % Below poverty | % Spanish at home (adults) |
|---|---|---|---|---|---|---|---|---|---|---|---|---|---|
| District | 721,695 | 551,780 | 31.4% | 2.3% | 63.3% | 0.5% | $51k | 22.1% | 20.8% | 17.8% | 63.5% | 25.4% | 2.0% |
| Hinds (in district) | 198,831 | 152,372 | 20.4% | 2.0% | 74.4% | 0.8% | $57k | 27.9% | 22.7% | 16.5% | 58.0% | 23.5% | 1.7% |
| Warren (in district) | 42,749 | 32,711 | 46.6% | 2.1% | 48.5% | 0.6% | $66k | 29.0% | 18.1% | 19.0% | 70.1% | 19.2% | 2.1% |
| Washington (in district) | 41,788 | 31,113 | 24.0% | 1.6% | 71.2% | 0.8% | $45k | 22.4% | 19.8% | 17.8% | 60.7% | 26.4% | 1.7% |
| Panola (in district) | 32,909 | 24,791 | 46.6% | 2.1% | 48.1% | 0.5% | $56k | 17.8% | 20.0% | 17.5% | 71.1% | 23.3% | 1.4% |
| Madison (in district) | 32,516 | 24,370 | 26.7% | 4.1% | 67.0% | 0.9% | $56k | 27.4% | 23.0% | 14.6% | 55.1% | 23.7% | 2.8% |
| Bolivar (in district) | 29,400 | 22,168 | 31.1% | 2.7% | 63.1% | 1.0% | $45k | 28.0% | 21.2% | 17.1% | 62.6% | 32.6% | 2.0% |
| Adams (in district) | 28,820 | 22,855 | 37.4% | 3.5% | 55.9% | 0.2% | $46k | 20.7% | 18.9% | 21.9% | 67.9% | 27.1% | 4.4% |
| Copiah (in district) | 27,655 | 21,460 | 43.3% | 4.5% | 50.5% | 0.3% | $54k | 19.5% | 21.1% | 19.1% | 74.6% | 22.9% | 2.4% |
| Leflore (in district) | 26,609 | 19,315 | 21.1% | 3.2% | 74.0% | 0.2% | $39k | 21.2% | 23.0% | 15.1% | 52.9% | 31.5% | 2.6% |
| Yazoo (in district) | 24,529 | 18,888 | 36.2% | 5.3% | 57.0% | 0.1% | $48k | 15.4% | 20.3% | 15.3% | 55.6% | 30.6% | 6.0% |
| Sunflower (in district) | 24,405 | 19,202 | 22.9% | 2.8% | 72.6% | 0.2% | $45k | 16.0% | 23.7% | 15.4% | 54.8% | 28.9% | 2.4% |
| Leake (in district) | 21,279 | 16,310 | 46.1% | 6.5% | 39.0% | 0.1% | $53k | 15.7% | 20.0% | 18.2% | 76.7% | 20.5% | 4.0% |
| Grenada (in district) | 20,881 | 15,836 | 50.4% | 0.5% | 44.6% | 0.0% | $52k | 21.8% | 18.5% | 18.9% | 66.9% | 24.5% | 0.7% |
| Coahoma (in district) | 20,541 | 15,000 | 18.8% | 3.1% | 74.5% | 0.3% | $43k | 19.4% | 22.3% | 16.5% | 51.9% | 35.6% | 2.5% |
| Attala (in district) | 17,717 | 13,267 | 51.4% | 2.1% | 44.5% | 0.2% | $54k | 19.8% | 18.5% | 19.4% | 75.1% | 18.1% | 0.5% |
| Holmes (in district) | 16,119 | 12,174 | 14.7% | 0.4% | 81.0% | 0.3% | $35k | 13.9% | 23.1% | 16.8% | 61.0% | 36.3% | 0.3% |
| Amite (in district) | 12,579 | 10,028 | 58.4% | 0.1% | 40.2% | 0.0% | $39k | 11.2% | 13.5% | 26.2% | 82.3% | 27.7% | 0.3% |
| Yalobusha (in district) | 12,423 | 9,708 | 57.2% | 1.7% | 37.0% | 0.2% | $51k | 15.6% | 16.6% | 21.9% | 69.3% | 21.5% | 1.4% |
| Tallahatchie (in district) | 11,778 | 9,369 | 36.6% | 0.8% | 60.8% | 0.0% | $43k | 11.7% | 21.0% | 18.2% | 64.5% | 24.5% | 0.8% |
| Carroll (in district) | 9,672 | 7,999 | 62.4% | 0.0% | 34.4% | 0.8% | $65k | 21.2% | 12.3% | 25.0% | 83.7% | 17.9% | 0.1% |
| Montgomery (in district) | 9,617 | 7,450 | 51.8% | 0.2% | 44.7% | 0.0% | $41k | 19.3% | 13.7% | 22.5% | 75.7% | 25.1% | 0.4% |
| Tunica (in district) | 9,494 | 6,861 | 18.4% | 1.8% | 79.7% | 0.0% | $45k | 13.7% | 20.9% | 14.7% | 39.7% | 31.2% | 3.0% |
| Claiborne (in district) | 8,539 | 6,685 | 11.3% | 0.3% | 85.7% | 0.1% | $35k | 18.1% | 29.9% | 19.5% | 76.6% | 30.6% | 0.5% |
| Wilkinson (in district) | 8,145 | 6,511 | 28.1% | 0.8% | 67.1% | 0.0% | $39k | 8.8% | 18.4% | 19.6% | 78.4% | 27.5% | 0.5% |
| Franklin (in district) | 7,621 | 5,856 | 62.4% | 1.1% | 35.1% | 0.0% | $52k | 18.9% | 16.9% | 21.5% | 81.6% | 25.5% | 0.1% |
| Humphreys (in district) | 7,341 | 5,505 | 20.3% | 0.4% | 78.1% | 0.2% | $40k | 19.7% | 18.6% | 19.1% | 61.8% | 27.0% | 1.1% |
| Jefferson (in district) | 7,121 | 5,656 | 13.1% | 2.0% | 82.9% | 0.5% | $40k | 13.4% | 18.3% | 20.1% | 82.9% | 32.4% | 1.4% |
| Quitman (in district) | 5,840 | 4,497 | 24.5% | 0.3% | 73.4% | 0.0% | $38k | 17.1% | 19.6% | 18.4% | 64.5% | 29.5% | 0.1% |
| Sharkey (in district) | 3,848 | 2,953 | 23.6% | 0.4% | 75.5% | 0.2% | $39k | 16.1% | 23.9% | 18.3% | 66.7% | 30.9% | 0.1% |
| Issaquena (in district) | 928 | 873 | 34.1% | 1.8% | 61.9% | 0.4% | $34k | 8.6% | 17.1% | 24.4% | 66.1% | 16.2% | 0.0% |
Hinds: 109 precincts
| Precinct | Population | Voting-age pop. | % White non-Hisp. | % Hispanic | % Black | % Asian | Median income* | % Bachelor's+ | % 18-29 (of adults) | % 65+ | % Homeowners | % Below poverty | % Spanish at home (adults) |
|---|---|---|---|---|---|---|---|---|---|---|---|---|---|
| 49 Voting District | 575 | 557 | 14.0% | 1.1% | 82.6% | 1.1% | $26k | 29.2% | 85.8% | 3.7% | 19.4% | 50.8% | 0.7% |
| Bolton Voting District | 1,602 | 1,291 | 37.4% | 2.4% | 54.8% | 0.0% | $57k | 18.1% | 8.4% | 28.6% | 84.6% | 18.2% | 0.7% |
| Brownsville Voting District | 1,093 | 946 | 45.8% | 0.0% | 47.0% | 0.0% | $58k | 30.1% | 12.6% | 28.5% | 85.3% | 2.9% | 0.0% |
| Byram 1 Voting District | 4,727 | 3,753 | 18.8% | 3.6% | 73.8% | 1.3% | $70k | 37.3% | 15.0% | 15.2% | 73.3% | 13.2% | 2.1% |
| Byram 2 Voting District | 4,319 | 3,282 | 39.0% | 1.3% | 58.0% | 0.1% | $80k | 36.8% | 12.6% | 18.9% | 90.7% | 9.0% | 1.0% |
| Byram 3 Voting District | 3,104 | 2,485 | 14.5% | 0.5% | 83.0% | 2.0% | $78k | 25.6% | 14.7% | 14.4% | 88.3% | 2.6% | 0.1% |
| Cayuga Voting District | 706 | 503 | 21.3% | 0.0% | 72.7% | 0.0% | $57k | 25.5% | 8.0% | 24.8% | 90.1% | 35.6% | 0.9% |
| Chapel Hill Voting District | 1,468 | 1,206 | 66.8% | 0.4% | 27.7% | 0.0% | $77k | 24.3% | 11.8% | 26.9% | 95.4% | 7.0% | 0.4% |
| Clinton 1 Voting District | 3,723 | 3,088 | 55.1% | 1.6% | 37.7% | 1.3% | $59k | 47.8% | 46.4% | 13.5% | 67.9% | 13.4% | 2.1% |
| Clinton 2 Voting District | 3,847 | 2,717 | 54.0% | 7.0% | 34.0% | 4.0% | $104k | 52.8% | 16.7% | 13.1% | 76.7% | 7.5% | 0.6% |
| Clinton 3 Voting District | 3,257 | 2,398 | 42.1% | 0.4% | 46.7% | 7.6% | $60k | 42.4% | 13.9% | 20.9% | 75.8% | 16.9% | 0.1% |
| Clinton 4 Voting District | 1,494 | 1,080 | 49.6% | 3.5% | 37.7% | 7.1% | $59k | 43.6% | 12.6% | 20.3% | 65.5% | 11.0% | 3.1% |
| Clinton 5 Voting District | 1,709 | 1,277 | 47.2% | 6.1% | 44.6% | 0.6% | $67k | 41.0% | 27.1% | 13.5% | 55.7% | 9.5% | 5.8% |
| Clinton 6 Voting District | 4,270 | 2,913 | 31.6% | 0.6% | 58.8% | 7.0% | $54k | 41.6% | 24.2% | 7.0% | 34.8% | 14.4% | 0.9% |
| Clinton 7 Voting District | 2,504 | 1,676 | 52.6% | 0.2% | 46.8% | 0.2% | $104k | 55.6% | 16.5% | 9.8% | 71.8% | 3.6% | 2.4% |
| Cynthia Voting District | 2,026 | 1,509 | 27.8% | 0.2% | 67.8% | 2.6% | $88k | 44.1% | 12.4% | 16.9% | 91.2% | 7.9% | 0.0% |
| Dry Grove Voting District | 1,554 | 1,265 | 69.9% | 0.7% | 25.1% | 0.0% | $74k | 26.4% | 10.6% | 27.2% | 95.6% | 7.6% | 1.0% |
| Edwards Voting District | 2,879 | 2,205 | 31.8% | 1.8% | 63.8% | 0.0% | $56k | 21.9% | 14.3% | 23.7% | 82.2% | 21.5% | 1.4% |
| Learned Voting District | 1,112 | 826 | 51.0% | 1.7% | 42.4% | 0.0% | $71k | 26.1% | 10.7% | 24.0% | 94.6% | 21.1% | 1.8% |
| Old Byram Voting District | 2,894 | 2,323 | 33.4% | 0.8% | 65.1% | 0.4% | $70k | 27.8% | 17.0% | 21.0% | 88.1% | 9.4% | 1.4% |
| Pinehaven Voting District | 4,581 | 3,561 | 38.9% | 0.8% | 48.8% | 5.3% | $124k | 40.4% | 14.3% | 20.3% | 87.4% | 9.4% | 1.1% |
| Pocahontas Voting District | 1,017 | 798 | 32.5% | 0.9% | 64.0% | 0.5% | $79k | 33.5% | 8.4% | 22.8% | 93.0% | 9.8% | 0.0% |
| Raymond 1 Voting District | 3,816 | 3,282 | 48.1% | 2.3% | 47.8% | 0.5% | $73k | 27.8% | 38.9% | 16.9% | 78.7% | 15.1% | 2.1% |
| Raymond 2 Voting District | 2,979 | 2,584 | 58.2% | 1.8% | 36.5% | 0.5% | $74k | 32.2% | 28.5% | 24.8% | 78.0% | 16.1% | 0.8% |
| Spring Ridge Voting District | 4,386 | 3,357 | 36.2% | 0.3% | 62.0% | 0.0% | $67k | 36.5% | 15.9% | 20.7% | 81.9% | 13.4% | 1.0% |
| St. Thomas Voting District | 394 | 316 | 42.1% | 0.0% | 57.0% | 0.0% | $45k | 22.1% | 7.3% | 15.5% | 73.9% | 14.8% | 1.3% |
| Terry 1 Voting District | 2,559 | 1,996 | 15.6% | 1.0% | 81.2% | 0.4% | $48k | 28.2% | 13.3% | 31.3% | 76.0% | 32.5% | 0.6% |
| Terry 2 Voting District | 4,586 | 3,633 | 58.5% | 0.8% | 38.8% | 0.1% | $91k | 33.7% | 13.4% | 18.1% | 92.1% | 5.5% | 1.5% |
| Tinnin Voting District | 1,501 | 1,194 | 38.0% | 1.0% | 55.8% | 2.2% | $79k | 35.3% | 11.1% | 23.5% | 87.0% | 6.5% | 0.7% |
| Utica 1 Voting District | 1,240 | 967 | 22.3% | 0.1% | 74.9% | 0.0% | $48k | 18.7% | 6.8% | 21.8% | 79.0% | 32.6% | 0.5% |
| Utica 2 Voting District | 529 | 482 | 24.2% | 0.0% | 74.7% | 0.0% | $41k | 26.7% | 10.6% | 32.6% | 86.4% | 19.0% | 0.1% |
| Voting District 1 | 1,845 | 1,768 | 26.5% | 1.4% | 70.1% | 1.9% | $34k | 36.4% | 36.9% | 15.1% | 5.4% | 26.1% | 3.9% |
| Voting District 10 | 571 | 352 | 0.0% | 0.0% | 93.9% | 0.0% | $30k | 15.0% | 6.7% | 17.3% | 72.6% | 43.9% | 2.8% |
| Voting District 11 | 716 | 688 | 3.4% | 0.0% | 94.8% | 0.0% | $17k | 8.8% | 10.2% | 37.4% | 24.5% | 41.6% | 0.0% |
| Voting District 12 | 566 | 472 | 3.1% | 0.0% | 94.8% | 0.0% | $12k | 5.7% | 20.8% | 16.6% | 46.9% | 58.3% | 0.0% |
| Voting District 13 | 830 | 631 | 2.4% | 0.1% | 92.5% | 0.0% | $28k | 10.3% | 29.1% | 11.3% | 39.4% | 55.5% | 0.0% |
| Voting District 16 | 1,900 | 1,219 | 33.5% | 0.6% | 57.2% | 0.6% | $59k | 43.1% | 17.0% | 6.1% | 44.6% | 48.6% | 0.1% |
| Voting District 17 | 764 | 657 | 71.9% | 0.1% | 26.7% | 1.2% | $107k | 82.8% | 16.4% | 22.2% | 66.6% | 2.6% | 0.1% |
| Voting District 18 | 615 | 479 | 4.7% | 0.0% | 92.7% | 0.0% | $24k | 19.2% | 14.4% | 16.1% | 27.8% | 25.5% | 1.1% |
| Voting District 19 | 654 | 539 | 2.0% | 0.0% | 96.6% | 0.0% | $24k | 6.2% | 10.8% | 12.7% | 34.1% | 35.0% | 2.4% |
| Voting District 2 | 416 | 324 | 3.5% | 0.1% | 96.2% | 0.0% | $46k | 6.9% | 13.1% | 17.5% | 45.4% | 17.5% | 2.1% |
| Voting District 20 | 771 | 518 | 0.3% | 0.0% | 99.2% | 0.0% | $28k | 11.9% | 15.1% | 15.2% | 47.2% | 32.6% | 0.4% |
| Voting District 21 | 647 | 496 | 15.0% | 0.0% | 84.9% | 0.0% | $57k | 18.4% | 12.2% | 15.8% | 70.8% | 16.5% | 1.8% |
| Voting District 22 | 2,198 | 1,508 | 1.9% | 0.0% | 96.2% | 0.1% | $39k | 14.6% | 18.9% | 18.1% | 57.4% | 35.4% | 1.5% |
| Voting District 23 | 2,345 | 1,581 | 0.1% | 0.0% | 99.1% | 0.0% | $29k | 7.2% | 11.1% | 21.5% | 27.8% | 50.9% | 1.6% |
| Voting District 24 | 1,071 | 692 | 2.1% | 0.0% | 95.3% | 0.0% | $36k | 11.5% | 25.3% | 11.6% | 41.4% | 47.0% | 0.0% |
| Voting District 25 | 1,749 | 1,361 | 2.3% | 0.0% | 97.2% | 0.0% | $28k | 13.1% | 26.3% | 26.4% | 62.4% | 41.8% | 0.0% |
| Voting District 26 | 1,047 | 978 | 6.8% | 0.6% | 92.5% | 0.0% | $39k | 24.4% | 31.4% | 23.0% | 49.3% | 39.9% | 0.4% |
| Voting District 27 | 953 | 759 | 1.2% | 10.4% | 86.3% | 0.0% | $39k | 22.1% | 22.2% | 21.4% | 49.8% | 29.4% | 5.9% |
| Voting District 28 | 1,129 | 943 | 0.9% | 6.2% | 91.5% | 0.0% | $28k | 13.7% | 20.5% | 20.9% | 44.0% | 35.7% | 2.8% |
| Voting District 29 | 743 | 586 | 1.3% | 0.5% | 98.2% | 0.0% | $43k | 20.4% | 12.7% | 29.8% | 71.1% | 19.0% | 0.4% |
| Voting District 30 | 995 | 787 | 5.9% | 0.0% | 94.1% | 0.0% | $34k | 7.1% | 20.9% | 28.3% | 22.7% | 41.1% | 1.2% |
| Voting District 31 | 1,430 | 1,004 | 0.2% | 0.0% | 96.5% | 0.0% | $29k | 10.3% | 18.1% | 17.9% | 36.5% | 44.5% | 0.0% |
| Voting District 37 | 1,393 | 1,179 | 36.8% | 6.0% | 56.0% | 0.0% | $63k | 34.0% | 28.9% | 22.2% | 55.1% | 17.5% | 7.6% |
| Voting District 38 | 1,157 | 812 | 15.6% | 11.5% | 72.6% | 0.0% | $39k | 24.4% | 18.7% | 8.8% | 52.0% | 33.4% | 5.2% |
| Voting District 39 | 1,631 | 1,028 | 1.7% | 1.1% | 97.2% | 0.0% | $23k | 12.2% | 6.4% | 12.2% | 59.2% | 63.8% | 4.5% |
| Voting District 4 | 457 | 327 | 1.6% | 0.1% | 96.1% | 0.0% | $42k | 8.3% | 9.2% | 17.6% | 53.2% | 25.2% | 2.4% |
| Voting District 40 | 1,546 | 1,122 | 0.6% | 0.0% | 98.3% | 0.0% | $33k | 16.9% | 16.7% | 17.6% | 39.7% | 34.0% | 0.0% |
| Voting District 41 | 2,334 | 1,515 | 0.3% | 0.0% | 98.9% | 0.0% | $42k | 18.4% | 13.5% | 18.2% | 60.0% | 36.5% | 0.0% |
| Voting District 42 | 3,039 | 2,449 | 0.7% | 5.4% | 85.1% | 0.0% | $39k | 21.0% | 45.9% | 7.1% | 18.2% | 22.0% | 0.8% |
| Voting District 43 | 3,423 | 2,561 | 5.2% | 3.4% | 89.4% | 1.1% | $50k | 22.0% | 28.3% | 6.9% | 27.6% | 18.2% | 1.1% |
| Voting District 45 | 2,225 | 1,638 | 48.9% | 3.6% | 45.5% | 0.0% | $105k | 64.0% | 20.0% | 16.9% | 90.0% | 7.3% | 1.2% |
| Voting District 46 | 3,690 | 2,830 | 18.8% | 4.9% | 76.0% | 0.0% | $82k | 50.5% | 21.6% | 20.4% | 48.5% | 23.2% | 6.3% |
| Voting District 47 | 1,478 | 1,229 | 12.8% | 4.3% | 80.9% | 0.0% | $26k | 33.0% | 29.3% | 18.1% | 29.2% | 31.2% | 5.4% |
| Voting District 50 | 1,165 | 1,119 | 14.2% | 1.0% | 82.6% | 0.8% | $25k | 26.8% | 77.6% | 5.6% | 20.6% | 55.0% | 0.9% |
| Voting District 51 | 985 | 927 | 7.1% | 0.5% | 89.0% | 2.6% | $27k | 34.4% | 58.4% | 13.1% | 24.8% | 37.2% | 2.4% |
| Voting District 52 | 966 | 870 | 1.2% | 0.0% | 95.5% | 2.9% | $26k | 25.5% | 28.5% | 20.3% | 29.8% | 37.8% | 2.7% |
| Voting District 54 | 954 | 785 | 6.1% | 0.3% | 93.4% | 0.0% | $25k | 14.1% | 37.6% | 14.1% | 33.5% | 46.4% | 0.4% |
| Voting District 55 | 1,144 | 953 | 6.5% | 0.0% | 92.3% | 0.0% | $27k | 14.4% | 30.7% | 17.0% | 36.7% | 41.5% | 0.0% |
| Voting District 56 | 394 | 321 | 2.5% | 0.0% | 92.7% | 0.4% | $32k | 21.5% | 16.0% | 26.3% | 46.2% | 22.1% | 0.2% |
| Voting District 57 | 1,082 | 996 | 0.0% | 0.0% | 98.1% | 0.0% | $35k | 23.9% | 15.8% | 16.0% | 36.1% | 39.9% | 1.5% |
| Voting District 58 | 1,136 | 894 | 0.3% | 0.2% | 99.2% | 0.0% | $36k | 19.8% | 13.1% | 22.5% | 45.2% | 37.8% | 1.1% |
| Voting District 59 | 1,323 | 1,052 | 0.2% | 2.0% | 96.8% | 0.0% | $29k | 7.9% | 13.2% | 19.2% | 53.3% | 33.8% | 2.6% |
| Voting District 6 | 2,220 | 1,775 | 20.9% | 0.6% | 70.6% | 1.1% | $34k | 15.5% | 47.7% | 13.2% | 10.3% | 48.1% | 0.7% |
| Voting District 60 | 596 | 508 | 11.9% | 0.0% | 86.4% | 0.0% | $37k | 17.8% | 15.5% | 17.3% | 46.4% | 31.0% | 0.0% |
| Voting District 61 | 1,002 | 797 | 8.5% | 0.0% | 89.6% | 0.0% | $32k | 17.5% | 16.6% | 15.7% | 45.2% | 41.6% | 0.0% |
| Voting District 62 | 2,625 | 1,959 | 1.7% | 3.3% | 94.8% | 0.0% | $35k | 30.5% | 27.9% | 15.9% | 39.9% | 32.0% | 4.8% |
| Voting District 63 | 1,625 | 1,552 | 9.2% | 1.5% | 87.2% | 0.4% | $25k | 19.8% | 68.5% | 7.3% | 34.3% | 32.3% | 1.1% |
| Voting District 64 | 532 | 416 | 1.9% | 0.4% | 89.6% | 0.0% | $23k | 24.5% | 27.1% | 15.0% | 26.4% | 42.3% | 0.4% |
| Voting District 67 | 1,721 | 1,208 | 2.5% | 4.9% | 91.4% | 0.0% | $47k | 19.9% | 30.3% | 14.6% | 41.2% | 26.1% | 2.8% |
| Voting District 68 | 2,789 | 2,033 | 3.2% | 1.9% | 88.4% | 0.0% | $57k | 12.2% | 20.6% | 12.3% | 54.8% | 50.1% | 2.8% |
| Voting District 69 | 1,714 | 1,102 | 3.1% | 4.5% | 91.1% | 0.0% | $35k | 12.9% | 16.4% | 8.0% | 63.9% | 49.1% | 2.5% |
| Voting District 70 | 1,028 | 586 | 3.3% | 0.1% | 76.9% | 0.0% | $23k | 17.8% | 45.4% | 3.3% | 8.8% | 68.9% | 0.1% |
| Voting District 71 | 1,191 | 756 | 1.2% | 7.1% | 81.5% | 0.0% | $24k | 9.5% | 26.4% | 2.0% | 9.0% | 52.6% | 8.7% |
| Voting District 72 | 1,575 | 1,079 | 2.7% | 3.4% | 93.8% | 0.0% | $57k | 13.3% | 22.8% | 6.9% | 55.8% | 48.0% | 7.2% |
| Voting District 73 | 899 | 680 | 2.6% | 0.0% | 97.4% | 0.0% | $33k | 5.3% | 30.7% | 16.3% | 22.5% | 20.4% | 0.0% |
| Voting District 74 | 1,241 | 929 | 5.7% | 0.0% | 94.2% | 0.1% | $54k | 11.2% | 22.8% | 5.5% | 43.1% | 16.3% | 0.0% |
| Voting District 75 | 686 | 648 | 33.6% | 0.0% | 65.3% | 1.1% | $36k | 16.0% | 29.9% | 9.2% | 90.7% | 21.9% | 0.0% |
| Voting District 76 | 1,114 | 889 | 7.2% | 1.2% | 91.4% | 0.0% | $35k | 7.9% | 29.5% | 7.4% | 27.9% | 52.8% | 0.0% |
| Voting District 77 | 1,694 | 1,262 | 9.7% | 8.7% | 79.7% | 0.0% | $31k | 16.2% | 36.7% | 9.6% | 26.8% | 39.3% | 8.5% |
| Voting District 79 | 3,276 | 2,547 | 15.5% | 0.0% | 83.3% | 0.0% | $72k | 25.3% | 21.0% | 6.9% | 47.9% | 6.8% | 0.3% |
| Voting District 80 | 2,832 | 2,044 | 7.7% | 0.8% | 89.1% | 0.0% | $24k | 15.4% | 23.5% | 20.0% | 17.3% | 34.0% | 1.1% |
| Voting District 81 | 2,262 | 1,699 | 0.1% | 0.4% | 98.6% | 0.0% | $75k | 51.8% | 11.4% | 19.6% | 65.1% | 8.3% | 0.6% |
| Voting District 82 | 1,404 | 1,288 | 2.4% | 0.5% | 97.0% | 0.0% | $56k | 28.1% | 23.8% | 25.2% | 79.6% | 9.0% | 0.7% |
| Voting District 83 | 2,627 | 1,836 | 1.4% | 0.9% | 94.4% | 0.0% | $53k | 27.0% | 10.6% | 21.0% | 69.5% | 26.4% | 0.0% |
| Voting District 84 | 661 | 413 | 1.5% | 1.6% | 93.8% | 0.0% | $37k | 25.9% | 20.1% | 11.0% | 61.5% | 37.8% | 0.2% |
| Voting District 85 | 2,344 | 1,893 | 1.6% | 0.0% | 92.1% | 0.5% | $41k | 19.8% | 18.8% | 22.9% | 71.9% | 35.6% | 1.6% |
| Voting District 86 | 1,574 | 1,090 | 8.4% | 0.0% | 87.3% | 0.0% | $41k | 17.8% | 26.8% | 16.3% | 48.3% | 41.4% | 0.0% |
| Voting District 87 | 2,932 | 2,175 | 5.1% | 7.5% | 83.8% | 0.9% | $48k | 20.9% | 28.0% | 16.9% | 39.4% | 23.0% | 4.3% |
| Voting District 88 | 1,801 | 1,299 | 17.9% | 4.8% | 73.1% | 1.9% | $46k | 31.3% | 24.8% | 16.6% | 51.4% | 25.8% | 2.9% |
| Voting District 89 | 1,825 | 1,370 | 4.2% | 0.9% | 94.9% | 0.0% | $35k | 18.0% | 24.4% | 11.4% | 11.7% | 39.0% | 0.7% |
| Voting District 90 | 2,417 | 1,776 | 6.4% | 4.0% | 89.5% | 0.0% | $35k | 17.7% | 44.9% | 7.5% | 16.7% | 22.2% | 1.6% |
| Voting District 91 | 2,060 | 1,623 | 9.9% | 0.3% | 89.4% | 0.0% | $63k | 31.9% | 26.5% | 11.8% | 86.0% | 9.4% | 1.2% |
| Voting District 92 | 2,840 | 2,038 | 3.7% | 2.8% | 93.2% | 0.0% | $54k | 14.4% | 21.4% | 8.0% | 54.5% | 15.2% | 0.6% |
| Voting District 93 | 1,929 | 1,482 | 6.7% | 1.4% | 89.7% | 0.0% | $48k | 22.9% | 21.6% | 14.7% | 51.8% | 24.0% | 1.8% |
| Voting District 94 | 3,826 | 2,838 | 5.5% | 3.6% | 86.4% | 0.0% | $54k | 19.5% | 26.0% | 15.2% | 74.1% | 15.2% | 0.9% |
| Voting District 95 | 1,240 | 941 | 13.1% | 2.5% | 73.6% | 0.0% | $73k | 31.8% | 13.5% | 16.5% | 87.6% | 13.9% | 0.9% |
| Voting District 96 | 3,040 | 2,036 | 5.1% | 0.1% | 93.8% | 0.3% | $81k | 43.4% | 10.6% | 15.0% | 93.7% | 11.1% | 0.2% |
| Voting District 97 | 1,763 | 1,392 | 12.7% | 9.4% | 77.1% | 0.5% | $63k | 23.6% | 24.5% | 18.4% | 64.6% | 24.4% | 10.1% |
Warren: 23 precincts
| Precinct | Population | Voting-age pop. | % White non-Hisp. | % Hispanic | % Black | % Asian | Median income* | % Bachelor's+ | % 18-29 (of adults) | % 65+ | % Homeowners | % Below poverty | % Spanish at home (adults) |
|---|---|---|---|---|---|---|---|---|---|---|---|---|---|
| American Legion Hall Voting District | 1,588 | 1,298 | 26.5% | 4.9% | 65.2% | 0.0% | $43k | 22.8% | 15.4% | 18.3% | 56.5% | 32.0% | 5.8% |
| Auditorium Voting District | 1,875 | 1,516 | 10.5% | 0.0% | 87.3% | 0.0% | $32k | 7.5% | 15.2% | 20.3% | 37.0% | 42.3% | 0.9% |
| Beechwood Voting District | 2,526 | 1,823 | 60.4% | 2.8% | 34.4% | 0.2% | $100k | 45.1% | 9.6% | 24.7% | 99.0% | 1.9% | 0.2% |
| Bovina Voting District | 3,258 | 2,491 | 76.4% | 1.4% | 20.7% | 0.6% | $85k | 34.5% | 15.1% | 23.8% | 89.2% | 10.4% | 2.3% |
| Brunswick Voting District | 701 | 634 | 88.2% | 0.0% | 10.3% | 0.5% | $56k | 12.0% | 15.6% | 24.4% | 89.1% | 6.1% | 0.0% |
| Cedar Grove Voting District | 2,187 | 1,613 | 35.5% | 2.0% | 58.2% | 2.0% | $65k | 31.5% | 22.0% | 14.9% | 55.0% | 27.6% | 2.8% |
| Cherry Street Voting District | 3,690 | 2,712 | 26.0% | 1.9% | 70.4% | 0.1% | $54k | 29.3% | 20.5% | 15.0% | 40.3% | 28.3% | 3.0% |
| Culkin Voting District | 3,652 | 2,757 | 62.1% | 2.1% | 30.8% | 2.9% | $92k | 33.1% | 19.1% | 16.6% | 74.8% | 13.2% | 1.0% |
| Elks Lodge Voting District | 2,742 | 2,143 | 17.7% | 2.8% | 79.1% | 0.0% | $56k | 30.5% | 18.2% | 14.7% | 62.4% | 15.7% | 3.3% |
| Goodrum Voting District | 1,849 | 1,550 | 63.3% | 0.1% | 28.6% | 0.2% | $62k | 21.2% | 23.1% | 17.2% | 82.7% | 13.5% | 0.0% |
| Jett Voting District | 1,629 | 1,229 | 35.0% | 3.8% | 58.5% | 0.0% | $58k | 26.0% | 15.1% | 15.9% | 73.6% | 14.4% | 5.3% |
| Kings Voting District | 3,804 | 2,742 | 44.7% | 2.2% | 50.9% | 0.9% | $75k | 33.2% | 23.2% | 15.4% | 69.3% | 25.7% | 1.7% |
| Lee Road Voting District | 341 | 250 | 52.7% | 0.0% | 46.2% | 0.4% | $82k | 39.7% | 7.7% | 24.4% | 95.1% | 5.1% | 0.0% |
| Moose Lodge Voting District | 1,897 | 1,607 | 70.3% | 0.1% | 26.9% | 0.3% | $71k | 22.7% | 14.6% | 25.4% | 95.7% | 8.8% | 0.0% |
| No.7 Fire Station Voting District | 2,329 | 1,877 | 25.0% | 5.0% | 68.4% | 0.1% | $50k | 32.4% | 9.1% | 22.5% | 70.9% | 13.6% | 5.9% |
| Oakland Voting District | 783 | 632 | 74.8% | 6.1% | 18.2% | 0.0% | $98k | 46.5% | 19.3% | 17.0% | 80.7% | 9.8% | 2.3% |
| Plumbers Hall Voting District | 2,224 | 1,828 | 40.1% | 0.7% | 58.5% | 0.3% | $85k | 36.9% | 19.8% | 27.5% | 56.0% | 21.7% | 0.6% |
| Redwood Voting District | 538 | 405 | 90.2% | 1.2% | 8.4% | 0.0% | $70k | 38.9% | 21.3% | 23.2% | 96.0% | 6.2% | 6.2% |
| St. Aloysius Voting District | 498 | 310 | 5.7% | 1.9% | 83.0% | 0.2% | $34k | 9.9% | 21.2% | 10.9% | 32.5% | 47.9% | 0.2% |
| Tingleville Voting District | 1,414 | 1,171 | 71.2% | 1.0% | 25.4% | 0.7% | $63k | 20.6% | 20.7% | 25.4% | 87.4% | 11.7% | 0.0% |
| Voting District 3-61 Store | 449 | 370 | 91.1% | 0.0% | 8.2% | 0.3% | $60k | 23.1% | 18.4% | 24.5% | 94.2% | 5.7% | 3.1% |
| Y.M.C.A. Voting District | 1,052 | 771 | 44.2% | 4.8% | 49.3% | 0.0% | $49k | 23.8% | 28.3% | 16.5% | 73.4% | 12.7% | 0.0% |
| Yokena Voting District | 1,723 | 983 | 45.4% | 1.6% | 44.9% | 0.0% | $44k | 11.1% | 24.0% | 9.3% | 56.2% | 47.0% | 2.8% |
Washington: 19 precincts
| Precinct | Population | Voting-age pop. | % White non-Hisp. | % Hispanic | % Black | % Asian | Median income* | % Bachelor's+ | % 18-29 (of adults) | % 65+ | % Homeowners | % Below poverty | % Spanish at home (adults) |
|---|---|---|---|---|---|---|---|---|---|---|---|---|---|
| Arcola Technology Center Voting District | 1,511 | 1,134 | 60.1% | 1.1% | 29.7% | 0.0% | $56k | 22.7% | 19.6% | 18.6% | 78.5% | 14.7% | 3.0% |
| Brent Center Voting District | 1,277 | 1,111 | 6.1% | 0.6% | 92.9% | 0.0% | $19k | 19.1% | 12.1% | 15.3% | 46.5% | 36.7% | 0.2% |
| Buster Brown Comm. Center Voting District | 4,013 | 2,859 | 14.6% | 0.0% | 81.7% | 0.0% | $56k | 21.2% | 21.3% | 13.9% | 78.5% | 18.7% | 0.0% |
| Covenant Presbyterian Voting District | 3,615 | 2,828 | 34.5% | 0.0% | 59.0% | 6.1% | $72k | 39.8% | 11.9% | 20.4% | 76.1% | 8.8% | 2.3% |
| Darlove Baptist Church Voting District | 665 | 541 | 52.9% | 5.7% | 37.0% | 0.2% | $53k | 26.5% | 17.3% | 22.7% | 90.8% | 5.8% | 7.0% |
| Elks Club Voting District | 3,482 | 2,743 | 8.2% | 0.3% | 90.9% | 0.0% | $37k | 15.5% | 26.0% | 19.7% | 43.9% | 22.4% | 0.0% |
| Extension Building Voting District | 1,454 | 1,156 | 3.9% | 0.0% | 95.0% | 0.0% | $22k | 4.1% | 14.9% | 15.8% | 27.9% | 46.4% | 0.0% |
| Glen Allan Health Clinic Voting District | 495 | 307 | 45.2% | 49.4% | 5.3% | 0.0% | $23k | 19.6% | 29.4% | 13.3% | 76.9% | 60.8% | 34.2% |
| Hollandale City Hall Voting District | 2,745 | 1,866 | 12.4% | 1.3% | 85.1% | 0.0% | $35k | 18.2% | 22.5% | 15.5% | 55.2% | 35.4% | 1.8% |
| Jakes Chapel M. B. Church Voting District | 2,930 | 1,941 | 1.5% | 2.1% | 95.8% | 0.0% | $23k | 12.4% | 20.5% | 20.3% | 41.1% | 55.0% | 0.1% |
| Lake Vista Masonic Lodge Voting District | 3,273 | 2,377 | 15.3% | 1.5% | 79.8% | 0.0% | $39k | 18.0% | 29.5% | 17.0% | 51.3% | 34.3% | 1.3% |
| Leland Health Dpt. Clinic Voting District | 2,011 | 1,630 | 27.6% | 1.8% | 69.6% | 0.1% | $40k | 17.1% | 17.4% | 22.9% | 70.4% | 23.1% | 3.2% |
| Leland Rotary Club Voting District | 2,570 | 1,846 | 29.6% | 1.8% | 62.6% | 0.0% | $49k | 32.6% | 21.4% | 20.8% | 66.5% | 30.3% | 3.8% |
| Metcalfe City Hall Voting District | 60 | 42 | 6.5% | 0.8% | 90.0% | 0.0% | $30k | 23.3% | 39.6% | 14.0% | 68.8% | 28.5% | 1.1% |
| St. James Epis. Church Voting District | 1,856 | 1,318 | 20.2% | 0.3% | 79.1% | 0.4% | $43k | 19.0% | 12.8% | 13.5% | 32.1% | 18.8% | 0.3% |
| Swiftwater Baptist Church Voting District | 1,908 | 1,523 | 75.5% | 0.1% | 15.0% | 0.8% | $50k | 33.5% | 18.5% | 17.8% | 79.9% | 7.9% | 1.4% |
| Tampa Drive Voting District | 931 | 798 | 45.2% | 1.6% | 48.9% | 3.4% | $54k | 30.0% | 13.0% | 17.7% | 60.2% | 25.3% | 1.7% |
| Wards Recreation Center Voting District | 4,629 | 3,416 | 27.0% | 0.0% | 69.5% | 1.1% | $55k | 25.8% | 22.2% | 17.5% | 65.9% | 22.4% | 0.1% |
| Washington Co. Convention Center Voting District | 2,364 | 1,674 | 26.4% | 3.6% | 69.6% | 0.0% | $39k | 19.0% | 16.0% | 16.9% | 70.4% | 32.2% | 3.8% |
Panola: 21 precincts
| Precinct | Population | Voting-age pop. | % White non-Hisp. | % Hispanic | % Black | % Asian | Median income* | % Bachelor's+ | % 18-29 (of adults) | % 65+ | % Homeowners | % Below poverty | % Spanish at home (adults) |
|---|---|---|---|---|---|---|---|---|---|---|---|---|---|
| Batesville Courthouse Voting District | 3,944 | 2,955 | 55.6% | 1.0% | 40.9% | 0.1% | $63k | 24.4% | 25.1% | 12.7% | 65.1% | 14.5% | 0.1% |
| Blackjack Community Center Voting District | 2,679 | 1,869 | 56.5% | 18.8% | 18.9% | 0.0% | $49k | 20.3% | 23.8% | 13.1% | 91.1% | 27.3% | 14.4% |
| Cliff Finch Voting District | 653 | 546 | 62.3% | 2.2% | 32.3% | 1.9% | $95k | 37.4% | 17.4% | 30.3% | 90.1% | 13.2% | 0.8% |
| Como Voting District | 3,130 | 2,410 | 34.3% | 0.3% | 60.9% | 0.0% | $34k | 7.3% | 16.5% | 21.8% | 52.7% | 19.7% | 0.4% |
| Courtland Baptist Voting District | 2,603 | 1,868 | 42.1% | 0.2% | 56.2% | 0.5% | $74k | 21.2% | 28.1% | 10.0% | 83.7% | 29.3% | 0.3% |
| Crenshaw Voting District | 956 | 722 | 61.8% | 0.0% | 37.8% | 0.0% | $37k | 9.7% | 30.1% | 25.0% | 66.5% | 31.7% | 0.3% |
| Crowder Voting District | 400 | 351 | 78.9% | 0.0% | 21.1% | 0.0% | $63k | 7.6% | 16.3% | 36.3% | 96.1% | 16.2% | 0.0% |
| Enon Voting District | 123 | 104 | 99.1% | 0.0% | 0.9% | 0.0% | $64k | 47.4% | 0.6% | 20.7% | 99.9% | 0.5% | 0.0% |
| Eureka Voting District | 2,039 | 1,425 | 75.5% | 0.0% | 19.9% | 2.1% | $91k | 22.8% | 21.4% | 17.0% | 81.1% | 15.5% | 0.0% |
| Longtown Voting District | 392 | 341 | 63.9% | 0.0% | 35.9% | 0.0% | $81k | 12.1% | 9.7% | 23.1% | 81.4% | 21.4% | 0.7% |
| Macedonia-Concord Comm Center Voting District | 1,794 | 1,391 | 23.7% | 0.1% | 75.7% | 0.4% | $76k | 10.2% | 21.8% | 18.3% | 86.8% | 18.4% | 0.3% |
| Mt. Olivet Voting District | 1,411 | 1,311 | 42.5% | 5.1% | 49.9% | 2.0% | $48k | 12.8% | 3.8% | 18.6% | 83.2% | 8.0% | 0.1% |
| Panola County Extension Voting District | 1,093 | 910 | 67.8% | 2.9% | 24.1% | 4.2% | $141k | 56.6% | 13.9% | 40.2% | 95.3% | 0.6% | 0.0% |
| Patton Lane Comm Center Voting District | 2,747 | 1,692 | 7.8% | 0.0% | 91.0% | 0.0% | $35k | 11.7% | 24.2% | 7.6% | 29.7% | 38.2% | 0.0% |
| Pleasant Grove Voting District | 713 | 594 | 68.0% | 0.0% | 31.6% | 0.0% | $37k | 18.0% | 13.0% | 25.5% | 80.2% | 29.0% | 1.1% |
| Pope Voting District | 1,310 | 1,046 | 71.8% | 0.0% | 27.5% | 0.0% | $56k | 22.0% | 25.5% | 17.0% | 78.5% | 13.6% | 0.0% |
| Sardis Courthouse Voting District | 1,650 | 1,245 | 35.7% | 0.8% | 61.7% | 0.0% | $48k | 6.8% | 22.4% | 15.0% | 64.4% | 26.4% | 0.7% |
| Sardis Lake Fire Station Voting District | 370 | 315 | 48.4% | 0.6% | 45.4% | 0.0% | $78k | 17.9% | 16.5% | 20.2% | 94.2% | 11.8% | 0.3% |
| South Sardis Voting District | 2,410 | 1,768 | 22.7% | 0.1% | 69.0% | 0.4% | $21k | 14.9% | 11.7% | 18.4% | 58.5% | 53.4% | 0.9% |
| Tocowa Voting District | 1,851 | 1,462 | 53.2% | 0.0% | 46.3% | 0.0% | $66k | 16.8% | 23.8% | 20.3% | 88.2% | 23.5% | 0.0% |
| Union Fire Station Voting District | 641 | 468 | 84.3% | 0.0% | 4.8% | 0.0% | $34k | 8.8% | 4.6% | 19.9% | 55.9% | 7.0% | 0.0% |
Madison: 21 precincts
| Precinct | Population | Voting-age pop. | % White non-Hisp. | % Hispanic | % Black | % Asian | Median income* | % Bachelor's+ | % 18-29 (of adults) | % 65+ | % Homeowners | % Below poverty | % Spanish at home (adults) |
|---|---|---|---|---|---|---|---|---|---|---|---|---|---|
| Anderson Lodge | 859 | 726 | 1.3% | 5.3% | 93.1% | 0.0% | $23k | 12.5% | 21.9% | 20.5% | 27.6% | 48.4% | 0.0% |
| Camden Voting District | 1,415 | 1,273 | 10.3% | 0.0% | 88.7% | 0.0% | $43k | 12.0% | 24.1% | 20.3% | 93.8% | 16.1% | 0.2% |
| Cameron Voting District | 287 | 258 | 10.1% | 0.0% | 88.8% | 0.0% | $43k | 11.9% | 24.1% | 20.2% | 93.8% | 16.1% | 0.2% |
| Canton Bible Church Voting District | 1,301 | 1,084 | 2.8% | 3.6% | 93.6% | 0.0% | $19k | 16.3% | 21.0% | 23.2% | 18.4% | 60.3% | 0.3% |
| Canton Catholic Parish Center | 3,319 | 2,646 | 19.4% | 4.5% | 76.0% | 0.0% | $44k | 16.3% | 18.6% | 18.9% | 73.1% | 25.5% | 2.1% |
| Canton Community Center | 1,289 | 1,050 | 31.4% | 4.3% | 64.1% | 0.0% | $53k | 20.2% | 13.6% | 22.7% | 64.5% | 16.9% | 1.3% |
| Canton Fire Station #4 Voting District | 3,502 | 2,265 | 54.1% | 1.5% | 30.9% | 7.1% | $119k | 74.8% | 24.0% | 5.0% | 60.5% | 0.6% | 0.8% |
| Canton National Guard Armory | 1,349 | 1,052 | 44.0% | 0.5% | 52.7% | 0.0% | $71k | 49.2% | 17.8% | 15.5% | 73.2% | 10.2% | 1.8% |
| Canton South Liberty | 2,487 | 1,806 | 41.1% | 1.4% | 55.9% | 0.0% | $57k | 29.5% | 23.0% | 12.1% | 62.9% | 34.5% | 0.7% |
| Canton St. Paul Methodist | 870 | 560 | 14.5% | 6.4% | 79.1% | 0.0% | $47k | 7.5% | 20.8% | 12.0% | 40.2% | 35.9% | 8.6% |
| Cedar Grove Voting District | 706 | 530 | 36.6% | 0.2% | 61.9% | 0.0% | $97k | 35.7% | 17.0% | 6.2% | 91.4% | 11.7% | 0.4% |
| Colonial Heights Voting District | 3,144 | 2,323 | 23.0% | 13.8% | 60.8% | 0.7% | $51k | 38.5% | 46.2% | 7.4% | 24.7% | 14.8% | 9.0% |
| Couparle Voting District | 214 | 193 | 10.1% | 0.0% | 88.8% | 0.0% | $43k | 11.9% | 24.1% | 20.2% | 93.8% | 16.1% | 0.2% |
| Farmhaven Fire Station Voting District | 839 | 624 | 19.2% | 0.4% | 80.4% | 0.0% | $61k | 17.5% | 8.1% | 26.7% | 93.0% | 15.4% | 1.1% |
| Greater Mt. Levi Church Voting District | 2,202 | 1,753 | 15.7% | 14.7% | 68.9% | 0.3% | $34k | 16.2% | 33.2% | 12.1% | 18.4% | 45.6% | 11.8% |
| Mad. Co. Bap. Fam. Lf.Ct Voting District | 1,557 | 1,095 | 0.1% | 2.3% | 97.4% | 0.0% | $22k | 3.4% | 32.9% | 8.0% | 13.6% | 61.7% | 0.8% |
| Magnolia Heights Voting District | 1,761 | 1,080 | 28.5% | 0.0% | 71.5% | 0.0% | $39k | 23.4% | 12.4% | 12.8% | 42.5% | 25.2% | 0.0% |
| Mount Hope Voting District | 1,516 | 1,189 | 65.3% | 0.6% | 33.6% | 0.3% | $71k | 33.2% | 4.0% | 27.9% | 53.0% | 13.2% | 0.4% |
| Pleasant Gift Church Voting District | 2,487 | 1,772 | 13.5% | 0.8% | 85.7% | 0.0% | $71k | 16.5% | 15.1% | 12.9% | 100.0% | 13.7% | 2.1% |
| Pleasant Green Voting District | 673 | 539 | 23.6% | 0.0% | 76.2% | 0.0% | $49k | 17.4% | 4.7% | 39.6% | 86.5% | 17.2% | 0.1% |
| Tougaloo Voting District | 738 | 552 | 36.3% | 8.3% | 52.3% | 0.9% | $64k | 38.6% | 48.4% | 7.0% | 78.1% | 5.1% | 7.6% |
Bolivar: 28 precincts
| Precinct | Population | Voting-age pop. | % White non-Hisp. | % Hispanic | % Black | % Asian | Median income* | % Bachelor's+ | % 18-29 (of adults) | % 65+ | % Homeowners | % Below poverty | % Spanish at home (adults) |
|---|---|---|---|---|---|---|---|---|---|---|---|---|---|
| Benoit Voting District | 912 | 644 | 43.4% | 3.0% | 51.6% | 2.0% | $51k | 16.1% | 15.2% | 13.7% | 76.3% | 27.7% | 0.5% |
| Beulah Voting District | 203 | 172 | 23.5% | 9.5% | 65.6% | 0.5% | $36k | 11.6% | 23.3% | 16.7% | 62.1% | 26.5% | 4.5% |
| Boyle Voting District | 1,654 | 1,216 | 66.6% | 2.7% | 25.1% | 2.9% | $62k | 40.0% | 13.9% | 17.5% | 79.0% | 21.5% | 1.7% |
| Choctaw Voting District | 483 | 359 | 6.6% | 2.9% | 90.6% | 0.0% | $23k | 17.0% | 11.9% | 13.3% | 57.5% | 44.6% | 7.1% |
| Cleveland Courthouse Voting District | 552 | 428 | 71.4% | 0.0% | 19.5% | 3.7% | $44k | 41.5% | 23.3% | 24.8% | 67.5% | 14.1% | 0.0% |
| Cleveland Eastgate Voting District | 1,177 | 815 | 1.6% | 2.5% | 95.0% | 0.0% | $17k | 7.1% | 18.2% | 20.3% | 24.5% | 57.1% | 2.2% |
| Duncan/Alligator Voting District | 638 | 520 | 20.7% | 0.5% | 77.6% | 0.0% | $41k | 11.1% | 19.4% | 23.4% | 85.7% | 28.4% | 0.0% |
| East Central Cleveland Voting District | 435 | 287 | 2.6% | 0.0% | 96.9% | 0.0% | $38k | 30.9% | 12.8% | 12.8% | 64.2% | 44.1% | 0.0% |
| East Cleveland Voting District | 2,420 | 1,819 | 10.7% | 0.7% | 86.5% | 0.0% | $27k | 27.6% | 14.5% | 21.3% | 41.7% | 51.0% | 0.4% |
| East Rosedale Voting District | 1,295 | 926 | 1.5% | 1.0% | 96.9% | 0.0% | $14k | 2.5% | 39.3% | 12.9% | 29.0% | 70.0% | 2.4% |
| Longshot Voting District | 798 | 607 | 35.9% | 3.4% | 59.3% | 1.4% | $40k | 14.1% | 16.9% | 12.6% | 71.7% | 30.7% | 2.1% |
| Merigold Voting District | 466 | 321 | 33.6% | 2.6% | 61.7% | 0.0% | $53k | 37.9% | 20.6% | 11.2% | 69.3% | 23.5% | 2.4% |
| Mound Bayou Voting District | 2,755 | 2,034 | 13.2% | 1.0% | 84.1% | 0.0% | $35k | 26.7% | 17.8% | 16.0% | 52.4% | 36.3% | 1.8% |
| North Cleveland Voting District | 365 | 275 | 31.9% | 1.4% | 63.0% | 0.0% | $43k | 39.2% | 15.2% | 19.4% | 51.4% | 34.8% | 1.3% |
| Northwest Cleveland Voting District | 1,706 | 1,331 | 69.7% | 1.6% | 27.0% | 0.4% | $61k | 49.7% | 19.2% | 21.1% | 76.2% | 14.0% | 1.6% |
| Pace Voting District | 424 | 347 | 22.3% | 11.3% | 65.4% | 0.2% | $41k | 18.7% | 20.8% | 16.0% | 64.5% | 20.5% | 5.8% |
| Renova Voting District | 243 | 162 | 34.0% | 3.0% | 61.1% | 0.0% | $51k | 39.1% | 16.5% | 10.7% | 67.4% | 24.0% | 2.3% |
| Round Lake Gunnison Deeson Voting District | 744 | 588 | 11.7% | 9.8% | 77.1% | 0.0% | $29k | 12.0% | 27.3% | 13.9% | 58.8% | 31.7% | 3.9% |
| Scott Voting District | 123 | 95 | 38.9% | 0.9% | 59.5% | 0.6% | $80k | 24.1% | 12.8% | 22.4% | 56.5% | 18.3% | 0.2% |
| Shaw Voting District | 1,452 | 1,023 | 20.1% | 6.0% | 73.9% | 0.0% | $37k | 24.1% | 8.8% | 17.5% | 66.7% | 27.0% | 1.1% |
| Shelby Voting District | 1,587 | 1,129 | 5.5% | 0.0% | 93.9% | 0.0% | $29k | 20.7% | 15.2% | 17.9% | 63.6% | 53.0% | 0.0% |
| Skene Voting District | 826 | 692 | 59.8% | 3.7% | 30.3% | 0.2% | $70k | 33.5% | 18.2% | 26.3% | 80.4% | 23.9% | 3.3% |
| South Cleveland Voting District | 1,899 | 1,292 | 11.9% | 0.0% | 88.1% | 0.0% | $38k | 21.1% | 1.4% | 18.6% | 69.2% | 26.6% | 0.0% |
| Stringtown Voting District | 80 | 64 | 35.4% | 0.3% | 64.0% | 0.0% | $85k | 26.1% | 14.1% | 25.1% | 51.7% | 14.8% | 0.4% |
| West Central Cleveland Voting District | 1,395 | 1,000 | 60.1% | 0.4% | 33.2% | 4.6% | $51k | 35.8% | 13.6% | 17.1% | 76.8% | 21.1% | 0.3% |
| West Cleveland Voting District | 3,685 | 3,121 | 54.8% | 7.2% | 28.9% | 3.0% | $73k | 48.2% | 48.1% | 9.7% | 66.2% | 21.5% | 4.7% |
| West Rosedale Voting District | 391 | 344 | 26.0% | 0.2% | 62.9% | 0.0% | $33k | 26.6% | 14.7% | 43.9% | 91.4% | 14.5% | 4.4% |
| Winstonville Voting District | 694 | 556 | 31.3% | 0.0% | 65.9% | 0.0% | $40k | 28.5% | 25.9% | 17.0% | 63.1% | 27.9% | 0.0% |
Adams: 19 precincts
| Precinct | Population | Voting-age pop. | % White non-Hisp. | % Hispanic | % Black | % Asian | Median income* | % Bachelor's+ | % 18-29 (of adults) | % 65+ | % Homeowners | % Below poverty | % Spanish at home (adults) |
|---|---|---|---|---|---|---|---|---|---|---|---|---|---|
| Airport Voting District | 681 | 630 | 39.0% | 7.5% | 49.7% | 0.1% | $47k | 11.1% | 23.6% | 19.5% | 75.4% | 15.6% | 11.0% |
| Beau Pre Voting District | 581 | 456 | 55.6% | 1.5% | 41.0% | 0.0% | $66k | 26.1% | 15.6% | 21.1% | 84.6% | 20.2% | 0.3% |
| Bellemont Voting District | 2,368 | 1,873 | 69.8% | 0.7% | 25.4% | 0.0% | $66k | 43.7% | 12.0% | 30.3% | 68.4% | 7.8% | 0.5% |
| By-Pass Firestation Voting District | 3,448 | 2,548 | 40.9% | 1.0% | 53.8% | 0.1% | $50k | 24.2% | 9.0% | 22.8% | 75.3% | 34.0% | 2.9% |
| Carpenter Voting District | 531 | 441 | 37.5% | 0.2% | 55.5% | 0.0% | $34k | 16.1% | 11.4% | 30.3% | 57.2% | 36.2% | 0.4% |
| Concord Voting District | 932 | 682 | 7.0% | 0.0% | 90.8% | 0.0% | $30k | 9.1% | 14.6% | 27.4% | 48.6% | 53.9% | 0.0% |
| Convention Center Voting District | 952 | 710 | 18.6% | 0.0% | 80.4% | 0.1% | $30k | 13.7% | 39.5% | 13.8% | 42.9% | 54.0% | 0.0% |
| Courthouse Voting District | 1,038 | 836 | 62.6% | 1.8% | 31.1% | 0.3% | $68k | 30.2% | 10.4% | 28.4% | 66.8% | 10.7% | 3.1% |
| Duncan Park Voting District | 1,874 | 1,327 | 38.4% | 0.1% | 60.2% | 0.0% | $53k | 30.9% | 27.1% | 15.1% | 51.9% | 22.9% | 0.1% |
| Foster Mound Voting District | 1,123 | 882 | 1.0% | 1.6% | 95.1% | 0.0% | $41k | 20.0% | 17.4% | 17.2% | 79.5% | 29.6% | 6.1% |
| Kingston Voting District | 850 | 754 | 72.2% | 7.0% | 14.7% | 2.3% | $46k | 6.7% | 16.7% | 27.8% | 96.4% | 9.1% | 0.0% |
| Liberty Park Voting District | 1,353 | 1,059 | 69.4% | 0.2% | 29.8% | 0.0% | $60k | 33.3% | 13.4% | 19.1% | 73.3% | 17.0% | 0.1% |
| Maryland Voting District | 1,090 | 629 | 6.0% | 0.0% | 93.0% | 0.0% | $20k | 14.9% | 30.2% | 11.7% | 27.0% | 73.6% | 0.0% |
| Morgantown Voting District | 532 | 508 | 18.6% | 33.2% | 45.3% | 0.1% | $43k | 11.1% | 19.7% | 25.9% | 80.7% | 23.2% | 15.6% |
| Northside School Voting District | 3,285 | 2,539 | 3.3% | 3.5% | 89.7% | 0.0% | $32k | 20.3% | 22.4% | 23.3% | 65.2% | 41.3% | 4.5% |
| Oakland Voting District | 2,160 | 1,660 | 32.8% | 0.7% | 65.9% | 0.3% | $38k | 11.8% | 15.1% | 20.2% | 60.6% | 23.6% | 0.5% |
| Palestine Voting District | 2,463 | 2,071 | 63.4% | 1.5% | 33.0% | 0.8% | $53k | 14.6% | 13.7% | 26.3% | 78.6% | 10.8% | 0.4% |
| Pine Ridge Voting District | 1,154 | 1,009 | 25.1% | 3.0% | 71.4% | 0.0% | $45k | 17.7% | 17.5% | 21.8% | 73.9% | 17.0% | 4.8% |
| Washington Voting District | 2,402 | 2,241 | 38.1% | 16.9% | 36.0% | 0.5% | $42k | 11.0% | 34.6% | 15.1% | 81.7% | 17.6% | 22.9% |
Copiah: 19 precincts
| Precinct | Population | Voting-age pop. | % White non-Hisp. | % Hispanic | % Black | % Asian | Median income* | % Bachelor's+ | % 18-29 (of adults) | % 65+ | % Homeowners | % Below poverty | % Spanish at home (adults) |
|---|---|---|---|---|---|---|---|---|---|---|---|---|---|
| Beauregard Voting District | 1,762 | 1,458 | 69.9% | 5.2% | 22.3% | 0.4% | $63k | 15.1% | 38.7% | 11.4% | 73.4% | 23.8% | 2.5% |
| Carpenter Voting District | 402 | 344 | 63.9% | 0.0% | 32.5% | 0.0% | $36k | 10.0% | 26.2% | 24.9% | 95.5% | 4.0% | 0.0% |
| Centerpoint Voting District | 1,120 | 953 | 77.8% | 0.0% | 21.5% | 0.0% | $50k | 18.6% | 18.2% | 28.3% | 95.0% | 3.4% | 0.9% |
| Crystal Springs East Voting District | 4,180 | 3,225 | 43.5% | 4.1% | 51.6% | 0.5% | $68k | 20.9% | 20.7% | 15.5% | 78.6% | 10.5% | 2.5% |
| Crystal Springs North Voting District | 1,376 | 1,099 | 41.2% | 12.6% | 45.4% | 0.0% | $49k | 25.4% | 3.4% | 27.1% | 83.2% | 12.8% | 5.9% |
| Crystal Springs South Voting District | 3,001 | 2,279 | 19.5% | 7.9% | 72.0% | 0.0% | $50k | 20.4% | 16.5% | 19.1% | 69.0% | 29.6% | 6.1% |
| Crystal Springs West Voting District | 2,051 | 1,268 | 40.0% | 0.0% | 57.6% | 0.5% | $38k | 16.1% | 14.0% | 19.2% | 87.5% | 35.8% | 0.2% |
| Dentville Voting District | 630 | 540 | 64.0% | 0.0% | 32.5% | 0.0% | $63k | 10.7% | 26.0% | 25.2% | 95.8% | 3.6% | 0.4% |
| Gallman Voting District | 2,621 | 2,196 | 42.7% | 0.4% | 56.2% | 0.0% | $67k | 19.3% | 15.2% | 22.7% | 86.3% | 22.7% | 2.9% |
| Georgetown North Voting District | 454 | 368 | 62.2% | 0.0% | 36.6% | 0.0% | $73k | 10.3% | 11.7% | 22.2% | 86.0% | 24.2% | 0.0% |
| Georgetown South Voting District | 669 | 532 | 69.7% | 3.7% | 26.3% | 0.0% | $45k | 13.5% | 11.9% | 19.7% | 89.1% | 21.7% | 0.0% |
| Hazlehurst East Voting District | 1,355 | 943 | 2.3% | 21.9% | 75.7% | 0.0% | $59k | 33.5% | 27.9% | 11.8% | 49.3% | 35.8% | 2.0% |
| Hazlehurst North Voting District | 199 | 159 | 14.6% | 0.2% | 84.6% | 0.0% | $78k | 9.5% | 14.4% | 22.4% | 94.3% | 31.9% | 0.2% |
| Hazlehurst South Voting District | 1,072 | 819 | 31.6% | 5.3% | 62.5% | 0.0% | $44k | 13.3% | 32.3% | 10.9% | 60.2% | 29.3% | 2.2% |
| Hazlehurst West Voting District | 2,029 | 1,657 | 27.5% | 2.7% | 63.4% | 0.3% | $43k | 27.9% | 18.2% | 26.5% | 53.4% | 31.7% | 2.7% |
| Martinsville Voting District | 1,830 | 1,413 | 37.4% | 0.2% | 59.3% | 1.0% | $50k | 22.6% | 22.5% | 21.3% | 58.9% | 19.4% | 0.2% |
| Shady Grove Voting District | 519 | 390 | 43.1% | 0.4% | 56.4% | 0.0% | $47k | 11.6% | 20.8% | 25.7% | 64.6% | 42.5% | 0.1% |
| Strong Hope-Union Voting District | 891 | 714 | 74.4% | 2.9% | 21.8% | 0.0% | $45k | 15.0% | 14.3% | 18.6% | 85.6% | 25.0% | 0.0% |
| Wesson Voting District | 1,491 | 1,104 | 69.1% | 6.0% | 21.2% | 1.3% | $55k | 12.7% | 46.6% | 9.8% | 54.8% | 27.6% | 3.8% |
Leflore: 17 precincts
| Precinct | Population | Voting-age pop. | % White non-Hisp. | % Hispanic | % Black | % Asian | Median income* | % Bachelor's+ | % 18-29 (of adults) | % 65+ | % Homeowners | % Below poverty | % Spanish at home (adults) |
|---|---|---|---|---|---|---|---|---|---|---|---|---|---|
| Central Greenwood Voting District | 847 | 513 | 47.0% | 0.2% | 41.7% | 0.0% | $28k | 14.7% | 14.0% | 14.8% | 39.1% | 26.5% | 0.1% |
| East Greenwood Voting District | 2,281 | 1,763 | 3.1% | 0.1% | 95.4% | 1.2% | $44k | 17.8% | 29.0% | 12.1% | 49.5% | 17.1% | 0.0% |
| MVSU Voting District | 109 | 101 | 19.7% | 2.8% | 76.2% | 0.1% | $56k | 27.1% | 53.3% | 10.7% | 24.1% | 22.5% | 3.0% |
| Minter City Voting District | 329 | 259 | 23.5% | 0.0% | 74.3% | 0.0% | $40k | 13.2% | 20.3% | 25.2% | 59.4% | 33.1% | 16.1% |
| Money Voting District | 181 | 179 | 67.1% | 0.0% | 32.9% | 0.0% | $31k | 8.5% | 1.4% | 64.5% | 55.7% | 12.2% | 0.0% |
| Morgan City/Swiftown Voting District | 609 | 586 | 27.0% | 0.3% | 70.9% | 0.2% | $71k | 42.2% | 63.3% | 5.8% | 29.1% | 27.4% | 0.0% |
| North Greenwood Voting District | 5,137 | 3,736 | 58.1% | 5.5% | 34.8% | 0.2% | $75k | 37.7% | 15.4% | 18.2% | 76.1% | 16.3% | 1.9% |
| North Itta Bena Voting District | 2,668 | 2,048 | 5.4% | 3.1% | 90.7% | 0.0% | $35k | 15.2% | 29.0% | 15.3% | 38.1% | 28.7% | 4.2% |
| Northeast Greenwood Voting District | 2,670 | 1,941 | 25.8% | 4.7% | 68.9% | 0.1% | $18k | 11.9% | 14.3% | 18.8% | 46.7% | 50.6% | 2.7% |
| Rising Sun Voting District | 702 | 434 | 8.9% | 0.0% | 84.2% | 0.0% | $44k | 18.3% | 20.5% | 14.3% | 60.8% | 44.1% | 0.0% |
| Schlater Voting District | 345 | 238 | 57.8% | 0.0% | 41.9% | 0.0% | $67k | 35.9% | 18.0% | 18.0% | 75.8% | 17.0% | 2.1% |
| Sidon Voting District | 491 | 435 | 22.5% | 2.8% | 73.4% | 0.0% | $61k | 10.3% | 16.1% | 10.5% | 73.3% | 31.2% | 0.0% |
| South Greenwood Voting District | 1,462 | 889 | 0.0% | 0.0% | 99.3% | 0.7% | $23k | 14.5% | 19.7% | 11.4% | 18.5% | 57.6% | 0.0% |
| South Itta Bena Voting District | 896 | 711 | 12.0% | 0.5% | 86.3% | 0.0% | $44k | 22.9% | 36.6% | 10.7% | 50.3% | 34.9% | 0.1% |
| Southeast Greenwood Voting District | 3,576 | 2,486 | 6.4% | 6.1% | 85.6% | 0.0% | $43k | 21.2% | 34.4% | 10.0% | 71.1% | 27.4% | 4.8% |
| Southwest Greenwood Voting District | 2,283 | 1,528 | 0.9% | 4.2% | 94.5% | 0.0% | $21k | 12.0% | 14.2% | 13.6% | 35.6% | 46.2% | 6.2% |
| West Greenwood Voting District | 2,023 | 1,468 | 10.7% | 1.8% | 87.3% | 0.0% | $28k | 18.1% | 15.3% | 18.9% | 44.4% | 36.3% | 2.1% |
Yazoo: 30 precincts
| Precinct | Population | Voting-age pop. | % White non-Hisp. | % Hispanic | % Black | % Asian | Median income* | % Bachelor's+ | % 18-29 (of adults) | % 65+ | % Homeowners | % Below poverty | % Spanish at home (adults) |
|---|---|---|---|---|---|---|---|---|---|---|---|---|---|
| Benton Voting District | 676 | 554 | 69.9% | 0.5% | 24.6% | 0.0% | $51k | 28.1% | 18.6% | 23.9% | 82.3% | 7.7% | 0.3% |
| Carter Voting District | 114 | 84 | 53.2% | 4.2% | 41.4% | 0.0% | $40k | 2.9% | 15.0% | 24.5% | 71.1% | 16.2% | 5.7% |
| Center Ridge Voting District | 244 | 200 | 83.8% | 0.1% | 10.6% | 0.0% | $43k | 28.5% | 18.4% | 25.5% | 69.5% | 4.3% | 0.1% |
| Deasonville Voting District | 839 | 732 | 55.8% | 0.2% | 42.6% | 0.0% | $58k | 33.5% | 14.1% | 31.8% | 89.9% | 12.8% | 0.1% |
| District 4 Ward 2 | 125 | 92 | 79.3% | 0.0% | 15.5% | 0.0% | $86k | 42.4% | 1.9% | 27.6% | 88.2% | 4.1% | 0.0% |
| Dover Voting District | 702 | 460 | 59.8% | 0.0% | 40.1% | 0.0% | $68k | 28.2% | 30.1% | 9.7% | 57.2% | 7.9% | 0.0% |
| East Bentonia Voting District | 646 | 453 | 65.4% | 0.0% | 34.4% | 0.0% | $53k | 20.0% | 21.1% | 16.2% | 61.9% | 10.0% | 0.2% |
| East Midway Voting District | 250 | 173 | 36.7% | 8.9% | 54.4% | 0.0% | $47k | 17.7% | 2.4% | 33.4% | 81.1% | 46.4% | 5.4% |
| Eden Voting District | 302 | 239 | 76.3% | 1.6% | 21.7% | 0.0% | $65k | 17.3% | 14.0% | 25.6% | 72.7% | 7.1% | 2.2% |
| Fairview Voting District | 398 | 290 | 88.5% | 1.5% | 9.8% | 0.0% | $95k | 28.2% | 33.7% | 13.1% | 78.7% | 6.0% | 0.0% |
| Free Run Voting District | 448 | 362 | 83.4% | 1.1% | 15.5% | 0.0% | $77k | 24.0% | 12.3% | 27.1% | 74.8% | 7.2% | 0.9% |
| Fugates Voting District | 621 | 503 | 60.7% | 0.0% | 32.7% | 0.0% | $58k | 25.2% | 23.1% | 16.8% | 93.1% | 5.2% | 0.0% |
| Harttown Voting District | 300 | 212 | 37.7% | 8.3% | 53.9% | 0.0% | $48k | 18.9% | 3.5% | 33.2% | 81.8% | 44.1% | 5.0% |
| Holly Bluff Voting District | 129 | 100 | 77.7% | 0.0% | 22.3% | 0.0% | $125k | 37.8% | 7.7% | 14.7% | 79.8% | 23.0% | 0.0% |
| Lake City Voting District | 1,157 | 1,091 | 27.2% | 23.3% | 47.4% | 0.2% | $97k | 5.7% | 15.3% | 3.2% | 63.4% | 15.7% | 22.4% |
| Mechanicsburg Voting District | 400 | 289 | 89.8% | 1.7% | 8.0% | 0.0% | $88k | 26.0% | 38.4% | 13.0% | 78.5% | 3.0% | 0.0% |
| Robinette Voting District | 874 | 668 | 85.7% | 0.0% | 11.6% | 0.0% | $47k | 23.3% | 15.8% | 20.7% | 68.1% | 10.8% | 0.0% |
| Satartia Voting District | 243 | 175 | 90.4% | 1.7% | 7.6% | 0.0% | $89k | 26.0% | 38.9% | 12.8% | 78.4% | 2.9% | 0.0% |
| Tinsley Voting District | 355 | 258 | 94.8% | 0.7% | 4.4% | 0.0% | $89k | 17.2% | 18.5% | 16.1% | 72.6% | 15.4% | 0.0% |
| Valley Voting District | 233 | 169 | 93.0% | 1.1% | 5.7% | 0.0% | $89k | 20.5% | 26.5% | 14.8% | 74.9% | 10.5% | 0.0% |
| Voting District 3-1 West | 1,080 | 878 | 4.5% | 0.9% | 94.6% | 0.0% | $20k | 6.6% | 17.4% | 15.5% | 13.1% | 57.5% | 0.9% |
| Voting District 3-2 East | 1,017 | 666 | 9.8% | 0.9% | 86.5% | 0.0% | $32k | 10.9% | 30.1% | 10.3% | 30.0% | 38.7% | 1.0% |
| Voting District 3-3 Jonestown | 832 | 708 | 4.9% | 1.1% | 94.1% | 0.0% | $19k | 4.4% | 11.2% | 17.3% | 11.7% | 55.5% | 1.1% |
| Voting District 3-4 South | 615 | 496 | 37.5% | 0.0% | 61.7% | 0.0% | $24k | 18.8% | 13.9% | 27.0% | 58.4% | 33.2% | 0.0% |
| Ward 2 | 997 | 689 | 27.4% | 1.8% | 65.0% | 0.0% | $42k | 16.1% | 24.4% | 15.7% | 54.3% | 20.6% | 1.8% |
| Ward 4 | 6,809 | 5,370 | 12.4% | 12.3% | 74.1% | 0.1% | $38k | 7.6% | 21.5% | 8.1% | 41.4% | 54.1% | 14.2% |
| Ward 5 | 2,449 | 1,714 | 5.0% | 2.1% | 92.0% | 0.1% | $29k | 16.1% | 30.3% | 14.9% | 24.0% | 56.9% | 2.8% |
| West Bentonia Voting District | 798 | 594 | 70.6% | 0.0% | 29.0% | 0.0% | $43k | 14.6% | 14.0% | 22.0% | 66.2% | 11.7% | 0.3% |
| West Midway Voting District | 127 | 88 | 36.8% | 8.9% | 54.3% | 0.0% | $47k | 17.8% | 2.5% | 33.4% | 81.1% | 46.2% | 5.4% |
| Zion Voting District | 747 | 580 | 83.0% | 0.1% | 14.0% | 0.0% | $81k | 32.8% | 8.9% | 26.4% | 80.8% | 3.0% | 0.3% |
Sunflower: 17 precincts
| Precinct | Population | Voting-age pop. | % White non-Hisp. | % Hispanic | % Black | % Asian | Median income* | % Bachelor's+ | % 18-29 (of adults) | % 65+ | % Homeowners | % Below poverty | % Spanish at home (adults) |
|---|---|---|---|---|---|---|---|---|---|---|---|---|---|
| Boyer-Linn Voting District | 786 | 636 | 43.8% | 2.9% | 53.0% | 0.0% | $60k | 21.6% | 20.1% | 16.9% | 82.5% | 6.6% | 2.9% |
| Doddsville Voting District | 1,140 | 974 | 24.1% | 0.5% | 75.1% | 0.0% | $38k | 9.6% | 30.0% | 24.5% | 62.2% | 30.6% | 0.7% |
| Drew Voting District | 3,108 | 2,529 | 24.4% | 4.0% | 69.8% | 0.0% | $29k | 7.8% | 20.2% | 14.7% | 47.0% | 34.3% | 2.8% |
| Fairview-Hale Voting District | 362 | 263 | 54.5% | 0.1% | 45.2% | 0.0% | $64k | 27.7% | 28.8% | 9.0% | 71.9% | 20.6% | 0.0% |
| Indianola 2 East Voting District | 777 | 549 | 5.3% | 3.6% | 90.1% | 0.0% | $36k | 18.1% | 21.9% | 21.0% | 49.7% | 39.9% | 4.5% |
| Indianola 2 West Voting District | 3,604 | 2,822 | 9.8% | 4.2% | 84.8% | 0.0% | $38k | 16.5% | 25.1% | 18.6% | 43.4% | 32.3% | 4.9% |
| Indianola 3 North Voting District | 885 | 699 | 48.3% | 2.7% | 48.0% | 0.2% | $59k | 21.0% | 27.3% | 12.6% | 46.1% | 37.9% | 2.8% |
| Indianola 3 Northeast Voting District | 1,372 | 1,040 | 26.6% | 3.3% | 60.9% | 2.7% | $83k | 28.9% | 9.6% | 20.2% | 65.9% | 12.0% | 5.2% |
| Indianola 3 South Voting District | 1,671 | 1,300 | 34.5% | 1.0% | 64.3% | 0.1% | $63k | 26.3% | 24.7% | 13.4% | 57.7% | 15.0% | 0.9% |
| Indianola Southeast Voting District | 1,653 | 1,061 | 0.4% | 0.4% | 99.2% | 0.0% | $44k | 21.6% | 16.1% | 17.1% | 62.7% | 38.4% | 0.3% |
| Inverness Voting District | 1,367 | 1,021 | 39.3% | 4.3% | 54.5% | 0.0% | $46k | 20.3% | 36.7% | 10.2% | 65.0% | 26.5% | 1.4% |
| Moorhead Voting District | 1,460 | 1,240 | 16.5% | 3.7% | 78.9% | 0.5% | $43k | 21.1% | 24.8% | 16.9% | 62.3% | 21.6% | 1.5% |
| Rome Voting District | 2,110 | 1,932 | 32.6% | 3.5% | 61.1% | 0.0% | $46k | 4.2% | 18.5% | 10.7% | 46.3% | 43.6% | 1.4% |
| Ruleville North Voting District | 1,628 | 1,207 | 20.6% | 1.0% | 78.4% | 0.0% | $38k | 15.4% | 33.8% | 13.1% | 58.7% | 28.9% | 0.9% |
| Ruleville Voting District | 901 | 656 | 4.5% | 1.2% | 92.8% | 0.0% | $25k | 15.5% | 34.1% | 10.7% | 48.4% | 30.2% | 1.0% |
| Sunflower Plantation Voting District | 590 | 522 | 41.2% | 1.8% | 55.6% | 0.0% | $53k | 5.7% | 17.9% | 9.9% | 49.3% | 31.6% | 0.7% |
| Sunflower Voting District | 992 | 751 | 17.2% | 4.8% | 77.4% | 0.0% | $31k | 18.1% | 23.3% | 15.5% | 51.2% | 35.8% | 5.6% |
Leake: 19 precincts
| Precinct | Population | Voting-age pop. | % White non-Hisp. | % Hispanic | % Black | % Asian | Median income* | % Bachelor's+ | % 18-29 (of adults) | % 65+ | % Homeowners | % Below poverty | % Spanish at home (adults) |
|---|---|---|---|---|---|---|---|---|---|---|---|---|---|
| Conway Voting District | 988 | 669 | 25.0% | 7.0% | 61.6% | 0.0% | $49k | 5.4% | 14.1% | 12.0% | 71.2% | 28.2% | 9.6% |
| East Carthage Voting District | 2,452 | 1,681 | 48.6% | 24.1% | 24.2% | 0.0% | $63k | 28.0% | 20.5% | 18.8% | 72.6% | 31.5% | 16.2% |
| Ebenezer Voting District | 591 | 507 | 75.0% | 0.0% | 22.8% | 0.0% | $48k | 16.1% | 15.0% | 20.3% | 95.6% | 11.1% | 0.0% |
| Edinburg Voting District | 703 | 615 | 77.2% | 2.9% | 18.7% | 0.0% | $55k | 16.1% | 21.5% | 19.9% | 94.7% | 15.3% | 0.3% |
| Freeny Voting District | 1,595 | 1,242 | 52.8% | 3.6% | 12.3% | 0.0% | $48k | 14.4% | 27.5% | 16.8% | 81.9% | 20.2% | 1.1% |
| Good Hope Voting District | 962 | 794 | 58.6% | 0.7% | 35.7% | 1.9% | $46k | 6.8% | 5.9% | 36.9% | 88.0% | 18.7% | 0.5% |
| Lena Voting District | 639 | 492 | 44.1% | 0.5% | 42.5% | 0.6% | $81k | 18.4% | 6.1% | 21.6% | 92.8% | 9.6% | 0.5% |
| Madden Voting District | 945 | 715 | 82.8% | 0.2% | 8.5% | 0.0% | $56k | 15.6% | 20.7% | 19.5% | 83.4% | 15.3% | 0.1% |
| North Carthage Voting District | 1,448 | 1,080 | 24.2% | 12.3% | 47.4% | 0.0% | $56k | 15.7% | 17.8% | 12.4% | 66.6% | 29.3% | 7.0% |
| Ofahoma Voting District | 787 | 655 | 31.6% | 2.4% | 59.6% | 0.0% | $40k | 8.2% | 28.8% | 16.1% | 69.9% | 14.1% | 2.2% |
| Renfroe Voting District | 883 | 733 | 81.8% | 4.1% | 12.9% | 0.0% | $69k | 19.2% | 27.6% | 18.7% | 86.4% | 19.0% | 0.5% |
| Salem Voting District | 672 | 506 | 81.9% | 0.2% | 9.0% | 0.0% | $56k | 15.5% | 21.0% | 19.4% | 82.7% | 15.5% | 0.1% |
| Singleton Voting District | 1,311 | 979 | 61.0% | 1.1% | 36.9% | 0.0% | $65k | 19.0% | 22.5% | 12.4% | 81.5% | 17.1% | 1.4% |
| South Carthage Voting District | 1,346 | 925 | 40.1% | 22.2% | 29.4% | 0.0% | $51k | 10.5% | 21.8% | 13.1% | 60.3% | 27.0% | 15.8% |
| Sunrise Voting District | 589 | 526 | 76.6% | 0.1% | 22.3% | 0.0% | $53k | 19.8% | 10.8% | 24.5% | 92.7% | 9.0% | 0.0% |
| Thomastown Voting District | 1,144 | 769 | 23.0% | 4.6% | 68.4% | 0.0% | $30k | 19.0% | 28.2% | 18.9% | 63.0% | 36.5% | 2.8% |
| Walnut Grove Voting District | 1,779 | 1,252 | 25.7% | 1.4% | 54.9% | 0.0% | $51k | 14.0% | 23.8% | 12.5% | 62.7% | 20.0% | 0.4% |
| West Carthage Voting District | 1,354 | 1,223 | 16.6% | 0.0% | 83.3% | 0.0% | $49k | 17.8% | 8.9% | 28.4% | 71.7% | 8.3% | 0.0% |
| Wiggins Voting District | 1,090 | 947 | 27.4% | 1.5% | 66.2% | 0.0% | $42k | 7.9% | 27.2% | 15.9% | 76.4% | 11.5% | 1.3% |
Grenada: 13 precincts
| Precinct | Population | Voting-age pop. | % White non-Hisp. | % Hispanic | % Black | % Asian | Median income* | % Bachelor's+ | % 18-29 (of adults) | % 65+ | % Homeowners | % Below poverty | % Spanish at home (adults) |
|---|---|---|---|---|---|---|---|---|---|---|---|---|---|
| Elliott Voting District | 1,087 | 778 | 77.2% | 0.0% | 21.8% | 0.0% | $84k | 34.2% | 10.2% | 12.9% | 83.1% | 12.1% | 2.4% |
| Futheyville Voting District | 851 | 640 | 78.5% | 0.0% | 19.1% | 0.0% | $62k | 15.7% | 17.8% | 17.2% | 82.4% | 22.1% | 0.4% |
| Geeslin Voting District | 1,122 | 957 | 58.2% | 0.7% | 32.4% | 0.0% | $42k | 6.9% | 15.7% | 30.8% | 72.9% | 34.9% | 0.2% |
| Gore Springs Voting District | 2,007 | 1,506 | 68.8% | 0.0% | 28.9% | 0.0% | $61k | 17.0% | 16.3% | 19.0% | 83.0% | 22.1% | 0.7% |
| Grenada Box 1 Southside Church of Christ Voting District | 2,089 | 1,561 | 70.1% | 0.6% | 25.8% | 0.0% | $62k | 32.5% | 13.6% | 14.7% | 84.5% | 19.8% | 0.3% |
| Grenada Box 2 Voting District | 1,061 | 751 | 37.5% | 0.0% | 62.4% | 0.0% | $49k | 14.5% | 23.6% | 4.5% | 51.5% | 32.3% | 0.0% |
| Grenada Box 3 Voting District | 3,413 | 2,324 | 18.6% | 0.3% | 77.6% | 0.0% | $39k | 15.0% | 21.7% | 11.0% | 52.9% | 26.8% | 0.0% |
| Grenada Box 4 Voting District | 2,591 | 1,775 | 21.2% | 0.3% | 75.7% | 0.0% | $33k | 14.0% | 16.0% | 19.4% | 41.7% | 33.2% | 0.0% |
| Grenada Box 5 Voting District | 3,867 | 3,447 | 57.0% | 0.3% | 34.4% | 0.0% | $51k | 33.9% | 24.4% | 30.6% | 58.3% | 23.2% | 0.4% |
| Holcomb Community Center Voting District | 1,086 | 768 | 83.3% | 2.4% | 10.7% | 0.0% | $68k | 14.3% | 16.1% | 14.6% | 87.8% | 26.8% | 6.9% |
| Mt. Nebo Voting District | 535 | 410 | 51.1% | 0.0% | 46.5% | 0.0% | $68k | 15.1% | 8.5% | 19.6% | 89.5% | 14.9% | 0.7% |
| Pleasant Grove Voting District | 342 | 261 | 50.7% | 0.0% | 47.0% | 0.0% | $68k | 15.2% | 8.0% | 19.3% | 89.7% | 14.5% | 0.7% |
| Sweethome Holcomb Voting District | 831 | 657 | 46.5% | 3.0% | 35.6% | 0.0% | $65k | 20.8% | 21.1% | 21.2% | 76.7% | 12.6% | 0.4% |
Coahoma: 18 precincts
| Precinct | Population | Voting-age pop. | % White non-Hisp. | % Hispanic | % Black | % Asian | Median income* | % Bachelor's+ | % 18-29 (of adults) | % 65+ | % Homeowners | % Below poverty | % Spanish at home (adults) |
|---|---|---|---|---|---|---|---|---|---|---|---|---|---|
| Bobo Voting District | 602 | 459 | 54.7% | 1.3% | 42.4% | 0.0% | $92k | 46.1% | 36.4% | 13.0% | 81.0% | 12.8% | 0.0% |
| Cagle Crossing Voting District | 623 | 468 | 13.9% | 18.0% | 65.2% | 0.0% | $39k | 3.8% | 20.7% | 19.5% | 44.2% | 46.7% | 23.6% |
| Clarksdale 2 Voting District | 3,291 | 2,469 | 17.6% | 1.8% | 78.8% | 0.0% | $46k | 17.8% | 22.8% | 11.7% | 47.9% | 27.5% | 1.0% |
| Clarksdale 3 Voting District | 1,374 | 1,023 | 21.3% | 11.9% | 54.1% | 0.2% | $47k | 18.2% | 12.8% | 19.7% | 68.8% | 14.3% | 3.8% |
| Clarksdale 4 North Voting District | 446 | 347 | 31.0% | 0.3% | 68.1% | 0.0% | $48k | 28.0% | 15.4% | 23.2% | 57.6% | 15.3% | 1.4% |
| Clarksdale 4 Voting District | 1,994 | 1,497 | 4.4% | 1.7% | 89.7% | 1.8% | $29k | 18.1% | 22.8% | 19.4% | 35.4% | 50.3% | 1.8% |
| Clarksdale 5 Voting District | 2,841 | 1,994 | 13.7% | 0.9% | 83.1% | 0.0% | $35k | 19.9% | 21.8% | 14.6% | 48.3% | 47.7% | 0.0% |
| Clarksdale Courthouse Voting District | 1,800 | 1,371 | 20.1% | 4.7% | 73.7% | 0.0% | $42k | 12.7% | 20.3% | 15.6% | 46.5% | 27.9% | 3.6% |
| Coahoma Voting District | 396 | 264 | 1.6% | 0.3% | 98.1% | 0.0% | $22k | 11.6% | 13.3% | 14.6% | 45.2% | 57.7% | 0.0% |
| Dublin Voting District | 715 | 535 | 23.7% | 7.6% | 49.8% | 0.0% | $51k | 17.3% | 19.3% | 14.8% | 57.1% | 27.2% | 10.0% |
| Farrell Voting District | 1,185 | 812 | 40.0% | 0.9% | 54.3% | 0.0% | $68k | 29.2% | 29.4% | 13.1% | 71.6% | 21.1% | 0.0% |
| Friar's Point Voting District | 802 | 538 | 16.2% | 0.2% | 83.5% | 0.0% | $43k | 18.3% | 15.8% | 14.3% | 52.8% | 38.0% | 0.0% |
| Jonestown Voting District | 598 | 491 | 7.5% | 0.9% | 90.8% | 0.0% | $35k | 12.1% | 16.8% | 26.4% | 71.0% | 35.0% | 0.0% |
| Lula Voting District | 831 | 642 | 49.3% | 0.1% | 50.6% | 0.0% | $40k | 25.7% | 7.7% | 24.9% | 58.1% | 31.6% | 0.0% |
| Lyons Voting District | 365 | 295 | 21.5% | 1.9% | 73.7% | 0.0% | $41k | 19.1% | 17.1% | 27.5% | 71.3% | 34.1% | 0.2% |
| Rena Lara Voting District | 262 | 172 | 56.9% | 1.4% | 30.0% | 0.0% | $83k | 30.3% | 38.1% | 12.5% | 87.4% | 8.0% | 0.0% |
| Roundaway Voting District | 370 | 278 | 16.1% | 17.1% | 64.1% | 0.0% | $40k | 5.8% | 21.6% | 19.2% | 45.3% | 45.3% | 22.2% |
| Sasse St. Fire Station Voting District | 2,046 | 1,346 | 3.8% | 0.0% | 93.6% | 0.9% | $33k | 25.5% | 37.9% | 16.5% | 41.7% | 54.7% | 0.0% |
Attala: 21 precincts
| Precinct | Population | Voting-age pop. | % White non-Hisp. | % Hispanic | % Black | % Asian | Median income* | % Bachelor's+ | % 18-29 (of adults) | % 65+ | % Homeowners | % Below poverty | % Spanish at home (adults) |
|---|---|---|---|---|---|---|---|---|---|---|---|---|---|
| Aponaug Voting District | 1,083 | 802 | 37.0% | 3.3% | 58.2% | 0.0% | $48k | 14.5% | 13.5% | 26.1% | 68.8% | 19.3% | 0.4% |
| Berea Voting District | 384 | 305 | 79.7% | 0.3% | 18.3% | 1.5% | $67k | 23.3% | 29.8% | 16.8% | 84.8% | 22.0% | 0.0% |
| Carmack Voting District | 452 | 293 | 80.6% | 2.3% | 14.5% | 1.5% | $56k | 12.0% | 26.3% | 16.1% | 90.2% | 12.5% | 0.0% |
| East Voting District | 1,520 | 1,134 | 50.2% | 1.6% | 45.3% | 0.0% | $45k | 21.9% | 20.8% | 17.6% | 64.0% | 27.1% | 0.8% |
| Ethel Voting District | 272 | 220 | 63.4% | 0.0% | 28.8% | 0.5% | $68k | 18.2% | 27.6% | 19.3% | 87.9% | 15.9% | 1.5% |
| Hesterville Voting District | 438 | 286 | 79.5% | 3.1% | 14.9% | 1.5% | $56k | 12.3% | 25.5% | 16.2% | 89.8% | 12.6% | 0.0% |
| Liberty Chapel Voting District | 617 | 484 | 64.1% | 0.3% | 27.9% | 0.6% | $64k | 16.8% | 27.1% | 19.1% | 88.5% | 14.6% | 1.5% |
| McAdams Voting District | 504 | 367 | 44.0% | 5.2% | 48.6% | 0.0% | $57k | 16.0% | 6.6% | 20.0% | 89.1% | 15.3% | 0.4% |
| McCool Voting District | 305 | 249 | 79.6% | 0.0% | 18.9% | 1.5% | $68k | 24.9% | 30.2% | 16.9% | 84.2% | 23.4% | 0.0% |
| Newport Voting District | 1,022 | 726 | 37.4% | 0.0% | 62.4% | 0.0% | $67k | 32.0% | 12.9% | 16.8% | 87.2% | 10.5% | 0.1% |
| North Central Voting District | 184 | 141 | 50.9% | 22.2% | 26.2% | 0.3% | $65k | 18.6% | 6.8% | 19.1% | 82.9% | 13.1% | 0.0% |
| Northeast Voting District | 2,332 | 1,602 | 39.2% | 1.4% | 57.0% | 0.0% | $42k | 17.9% | 23.3% | 17.6% | 53.2% | 30.7% | 0.6% |
| Northwest Voting District | 1,170 | 915 | 32.6% | 5.0% | 62.3% | 0.0% | $48k | 15.9% | 13.0% | 27.2% | 59.3% | 14.9% | 0.0% |
| Possumneck Voting District | 435 | 302 | 68.0% | 10.3% | 19.8% | 1.0% | $60k | 15.1% | 17.6% | 17.2% | 86.6% | 13.1% | 0.0% |
| Providence Voting District | 743 | 580 | 77.5% | 0.3% | 19.6% | 0.3% | $69k | 23.6% | 16.8% | 21.2% | 85.9% | 7.7% | 0.5% |
| Sallis Voting District | 1,151 | 854 | 40.5% | 4.4% | 54.4% | 0.0% | $58k | 15.3% | 9.1% | 16.9% | 89.4% | 13.9% | 0.0% |
| South Central Voting District | 1,473 | 1,141 | 32.7% | 1.3% | 64.9% | 0.0% | $38k | 18.2% | 27.9% | 13.1% | 60.2% | 25.8% | 0.3% |
| Southwest Voting District | 1,031 | 722 | 44.9% | 0.6% | 50.2% | 0.0% | $45k | 16.2% | 13.1% | 22.7% | 76.9% | 21.9% | 1.2% |
| Thompson Voting District | 483 | 394 | 79.6% | 0.0% | 18.8% | 1.5% | $68k | 24.9% | 30.2% | 16.9% | 84.2% | 23.4% | 0.0% |
| Williamsville Voting District | 1,566 | 1,342 | 65.3% | 0.5% | 34.1% | 0.0% | $60k | 29.8% | 13.8% | 23.7% | 86.9% | 6.6% | 0.9% |
| Zama Voting District | 549 | 409 | 79.6% | 0.0% | 20.4% | 0.0% | $83k | 12.1% | 9.5% | 20.0% | 80.8% | 0.9% | 0.3% |
Holmes: 16 precincts
| Precinct | Population | Voting-age pop. | % White non-Hisp. | % Hispanic | % Black | % Asian | Median income* | % Bachelor's+ | % 18-29 (of adults) | % 65+ | % Homeowners | % Below poverty | % Spanish at home (adults) |
|---|---|---|---|---|---|---|---|---|---|---|---|---|---|
| Acona Voting District | 694 | 535 | 5.2% | 0.0% | 92.3% | 0.0% | $44k | 7.3% | 18.9% | 18.5% | 72.1% | 32.2% | 0.1% |
| Beat 4 Walden Chapel Voting District | 605 | 491 | 17.8% | 0.5% | 73.1% | 0.3% | $28k | 6.1% | 27.4% | 18.2% | 74.0% | 43.8% | 0.4% |
| Coxburg Voting District | 281 | 220 | 54.1% | 0.0% | 31.9% | 0.0% | $93k | 4.5% | 4.7% | 26.1% | 98.3% | 13.9% | 0.0% |
| Cruger Voting District | 199 | 157 | 14.3% | 0.4% | 84.2% | 0.0% | $33k | 21.6% | 11.2% | 18.6% | 60.1% | 31.1% | 0.7% |
| Durant Voting District | 1,127 | 747 | 10.6% | 0.9% | 86.4% | 0.0% | $30k | 12.2% | 12.3% | 17.6% | 58.9% | 34.8% | 0.2% |
| Ebenezer Voting District | 438 | 360 | 34.5% | 0.0% | 51.0% | 0.0% | $54k | 3.9% | 9.1% | 23.1% | 98.6% | 28.5% | 0.0% |
| Goodman Voting District | 1,990 | 1,539 | 17.0% | 1.2% | 78.7% | 0.5% | $21k | 8.8% | 45.3% | 15.8% | 41.2% | 50.9% | 0.8% |
| Lexington Beat 1 Voting District | 1,883 | 1,459 | 11.4% | 0.3% | 86.6% | 0.5% | $44k | 15.3% | 22.6% | 13.7% | 49.9% | 34.3% | 0.5% |
| Lexington Beat 4 Voting District | 1,943 | 1,487 | 13.3% | 0.1% | 82.6% | 1.1% | $33k | 14.3% | 19.3% | 16.0% | 61.8% | 36.5% | 0.2% |
| Lexington Beat 5 Voting District | 759 | 540 | 32.7% | 0.0% | 66.3% | 0.1% | $47k | 19.8% | 10.4% | 17.4% | 67.1% | 24.8% | 0.1% |
| Lexington East Voting District | 480 | 346 | 10.1% | 0.4% | 88.5% | 0.0% | $31k | 11.6% | 13.9% | 28.4% | 57.7% | 27.7% | 0.0% |
| Pickens Voting District | 680 | 537 | 8.5% | 0.0% | 86.6% | 0.1% | $26k | 8.9% | 18.3% | 22.0% | 68.7% | 45.3% | 0.0% |
| Sandhill Voting District | 1,281 | 919 | 13.3% | 0.9% | 83.8% | 0.0% | $32k | 9.1% | 19.3% | 16.4% | 66.3% | 24.2% | 0.0% |
| Tchula Voting District | 2,421 | 1,792 | 4.8% | 0.1% | 93.3% | 0.0% | $35k | 21.5% | 24.9% | 12.8% | 49.9% | 42.7% | 0.2% |
| Thornton Voting District | 537 | 434 | 9.6% | 0.0% | 90.0% | 0.0% | $39k | 9.0% | 16.2% | 9.9% | 86.3% | 48.6% | 0.0% |
| West Voting District | 801 | 610 | 33.7% | 0.3% | 46.9% | 0.0% | $44k | 28.3% | 35.1% | 22.4% | 76.0% | 25.0% | 0.0% |
Amite: 21 precincts
| Precinct | Population | Voting-age pop. | % White non-Hisp. | % Hispanic | % Black | % Asian | Median income* | % Bachelor's+ | % 18-29 (of adults) | % 65+ | % Homeowners | % Below poverty | % Spanish at home (adults) |
|---|---|---|---|---|---|---|---|---|---|---|---|---|---|
| Amite River Voting District | 554 | 373 | 50.8% | 0.0% | 48.5% | 0.0% | $44k | 4.9% | 6.8% | 11.1% | 78.8% | 41.7% | 0.0% |
| Ariel Voting District | 932 | 740 | 22.3% | 0.3% | 77.1% | 0.1% | $37k | 12.8% | 15.0% | 21.3% | 78.4% | 35.1% | 0.4% |
| Berwick Voting District | 644 | 511 | 40.0% | 0.0% | 59.5% | 0.0% | $54k | 13.4% | 13.7% | 25.1% | 92.6% | 36.0% | 0.0% |
| Crosby Voting District | 196 | 148 | 59.4% | 0.0% | 40.6% | 0.0% | $35k | 13.3% | 6.2% | 28.1% | 89.7% | 30.7% | 0.0% |
| East Centreville Voting District | 606 | 472 | 60.2% | 0.0% | 38.0% | 0.0% | $57k | 10.0% | 7.5% | 23.1% | 90.3% | 24.2% | 0.0% |
| East Fork Voting District | 595 | 539 | 63.5% | 0.0% | 36.5% | 0.0% | $42k | 9.1% | 13.7% | 36.8% | 85.1% | 10.9% | 0.0% |
| East Gloster Voting District | 273 | 213 | 31.1% | 0.4% | 68.2% | 0.2% | $37k | 11.5% | 11.0% | 20.7% | 73.0% | 29.2% | 0.5% |
| East Liberty Voting District | 761 | 631 | 65.9% | 0.2% | 31.4% | 0.0% | $42k | 17.8% | 9.8% | 34.9% | 79.0% | 22.5% | 0.3% |
| Gloster Voting District | 971 | 764 | 27.1% | 0.4% | 72.2% | 0.2% | $37k | 11.8% | 12.5% | 20.5% | 74.1% | 31.0% | 0.5% |
| Homochitto Voting District | 298 | 226 | 59.4% | 0.0% | 40.6% | 0.0% | $35k | 13.3% | 6.2% | 28.1% | 89.8% | 30.8% | 0.0% |
| Liberty Voting District | 834 | 646 | 80.9% | 0.0% | 17.0% | 0.0% | $37k | 12.8% | 16.4% | 33.7% | 88.3% | 23.2% | 1.2% |
| New Zion Voting District | 554 | 425 | 65.4% | 0.0% | 32.3% | 0.0% | $36k | 9.3% | 17.6% | 33.2% | 96.4% | 44.1% | 1.4% |
| Oneil Voting District | 473 | 364 | 74.8% | 0.0% | 24.6% | 0.0% | $36k | 13.7% | 10.5% | 31.0% | 87.7% | 21.0% | 0.4% |
| Riceville Voting District | 380 | 352 | 55.4% | 0.0% | 41.2% | 0.0% | $38k | 8.2% | 10.6% | 32.9% | 77.2% | 28.7% | 0.0% |
| Smithdale Voting District | 554 | 457 | 82.5% | 0.0% | 17.5% | 0.0% | $39k | 13.4% | 15.2% | 35.6% | 87.1% | 28.6% | 0.0% |
| South Liberty Voting District | 679 | 480 | 45.6% | 0.0% | 53.3% | 0.0% | $36k | 7.3% | 10.2% | 15.2% | 75.7% | 41.9% | 0.1% |
| Tangipahoa Voting District | 876 | 665 | 94.8% | 0.0% | 5.2% | 0.0% | $39k | 13.4% | 29.4% | 11.2% | 69.5% | 8.4% | 0.0% |
| Tickfaw Voting District | 449 | 413 | 55.9% | 0.0% | 44.1% | 0.0% | $45k | 9.2% | 10.5% | 35.4% | 76.1% | 21.4% | 0.0% |
| Vance Park Voting District | 328 | 257 | 59.1% | 0.0% | 39.7% | 0.0% | $48k | 12.6% | 11.8% | 26.1% | 88.7% | 27.2% | 0.2% |
| Walls Voting District | 935 | 819 | 51.5% | 0.0% | 43.5% | 0.0% | $31k | 6.1% | 11.8% | 26.2% | 80.3% | 30.9% | 0.0% |
| Zion Hill Voting District | 686 | 531 | 86.2% | 0.0% | 11.8% | 0.0% | $37k | 12.3% | 17.7% | 34.1% | 88.7% | 19.6% | 1.3% |
Yalobusha: 12 precincts
| Precinct | Population | Voting-age pop. | % White non-Hisp. | % Hispanic | % Black | % Asian | Median income* | % Bachelor's+ | % 18-29 (of adults) | % 65+ | % Homeowners | % Below poverty | % Spanish at home (adults) |
|---|---|---|---|---|---|---|---|---|---|---|---|---|---|
| Coffeeville 4 Voting District | 585 | 434 | 19.6% | 0.0% | 78.0% | 0.1% | $63k | 10.2% | 6.0% | 22.5% | 91.6% | 47.9% | 0.3% |
| Coffeeville 5 Voting District | 1,199 | 982 | 47.1% | 1.4% | 49.7% | 0.5% | $38k | 9.7% | 10.1% | 22.2% | 63.8% | 25.5% | 1.7% |
| Oakland Voting District | 1,529 | 1,305 | 64.7% | 0.3% | 25.6% | 0.7% | $48k | 15.0% | 10.1% | 27.2% | 80.6% | 12.4% | 0.0% |
| One North Voting District | 1,063 | 778 | 60.6% | 2.4% | 32.2% | 0.0% | $62k | 27.6% | 23.6% | 22.7% | 64.2% | 17.8% | 2.4% |
| One South Voting District | 954 | 695 | 57.3% | 2.5% | 38.0% | 0.0% | $59k | 15.8% | 8.4% | 21.2% | 74.7% | 25.8% | 0.8% |
| Scobey Voting District | 102 | 102 | 61.2% | 0.0% | 37.2% | 0.0% | $47k | 7.0% | 4.1% | 45.0% | 64.2% | 24.8% | 0.0% |
| Skuna Mills Voting District | 707 | 507 | 79.8% | 4.7% | 14.4% | 0.0% | $54k | 16.3% | 9.6% | 20.4% | 58.2% | 12.3% | 1.4% |
| Sylva Rena Voting District | 1,146 | 931 | 82.1% | 0.1% | 9.6% | 0.0% | $51k | 19.1% | 9.1% | 28.2% | 85.1% | 9.9% | 0.0% |
| Three North West Voting District | 2,980 | 2,342 | 56.8% | 2.3% | 37.7% | 0.0% | $55k | 17.2% | 28.3% | 17.9% | 62.3% | 22.8% | 3.2% |
| Tillatoba Voting District | 112 | 107 | 52.6% | 0.2% | 41.7% | 0.7% | $46k | 7.7% | 6.9% | 36.9% | 68.6% | 21.3% | 0.0% |
| Two North East Voting District | 332 | 246 | 43.2% | 2.9% | 50.7% | 0.0% | $41k | 16.7% | 29.4% | 13.9% | 41.3% | 30.6% | 1.3% |
| Two South East Voting District | 1,714 | 1,279 | 45.8% | 1.9% | 50.1% | 0.0% | $45k | 10.3% | 18.4% | 19.3% | 68.0% | 25.1% | 0.6% |
Tallahatchie: 22 precincts
| Precinct | Population | Voting-age pop. | % White non-Hisp. | % Hispanic | % Black | % Asian | Median income* | % Bachelor's+ | % 18-29 (of adults) | % 65+ | % Homeowners | % Below poverty | % Spanish at home (adults) |
|---|---|---|---|---|---|---|---|---|---|---|---|---|---|
| Blue Cane Voting District | 51 | 34 | 31.8% | 0.0% | 65.7% | 0.0% | $47k | 7.7% | 26.5% | 16.1% | 72.9% | 41.5% | 0.0% |
| Brazil Voting District | 39 | 32 | 28.0% | 0.0% | 71.8% | 0.0% | $49k | 54.6% | 1.4% | 28.8% | 88.3% | 5.7% | 0.0% |
| Cascilla Voting District | 200 | 181 | 88.0% | 0.0% | 9.5% | 0.0% | $49k | 9.5% | 15.2% | 32.2% | 58.1% | 30.4% | 0.0% |
| Charleston Beat 1 Voting District | 985 | 762 | 33.4% | 1.1% | 64.6% | 0.2% | $40k | 15.3% | 19.6% | 17.7% | 65.6% | 40.5% | 0.3% |
| Charleston Beat 2 Voting District | 1,534 | 1,175 | 34.1% | 0.1% | 64.2% | 0.0% | $64k | 17.5% | 22.5% | 17.5% | 71.4% | 16.0% | 0.4% |
| Charleston Beat 3 Voting District | 923 | 772 | 33.4% | 0.2% | 65.8% | 0.0% | $41k | 10.2% | 17.7% | 26.4% | 65.1% | 21.9% | 0.1% |
| Enid Voting District | 332 | 266 | 74.3% | 0.0% | 23.6% | 0.0% | $56k | 9.4% | 31.5% | 14.4% | 91.8% | 5.2% | 0.0% |
| Glendora Voting District | 681 | 490 | 2.5% | 0.0% | 90.2% | 0.0% | $26k | 10.6% | 26.6% | 8.2% | 41.6% | 55.0% | 0.8% |
| Leverette Voting District | 393 | 309 | 55.7% | 0.0% | 43.2% | 0.0% | $49k | 5.3% | 30.0% | 21.0% | 79.3% | 34.7% | 0.0% |
| Murphreesboro Voting District | 494 | 440 | 82.2% | 0.0% | 15.5% | 0.0% | $38k | 9.0% | 8.4% | 24.1% | 75.5% | 21.2% | 0.0% |
| Paynes Voting District | 543 | 416 | 53.7% | 0.0% | 43.9% | 0.0% | $42k | 8.3% | 17.2% | 19.4% | 74.5% | 32.5% | 0.0% |
| Philipp Voting District | 425 | 317 | 40.6% | 0.0% | 59.1% | 0.0% | $26k | 2.6% | 40.2% | 15.4% | 96.8% | 36.4% | 0.1% |
| Rosebloom Voting District | 152 | 137 | 88.2% | 0.0% | 9.4% | 0.0% | $49k | 9.5% | 15.2% | 32.2% | 58.0% | 30.4% | 0.0% |
| Springhill Voting District | 327 | 288 | 81.1% | 0.0% | 16.7% | 0.0% | $39k | 9.0% | 10.7% | 22.7% | 77.7% | 19.0% | 0.0% |
| Sumner Beat 2 Voting District | 135 | 97 | 22.4% | 0.7% | 74.6% | 0.0% | $38k | 20.1% | 18.4% | 16.9% | 59.3% | 20.8% | 0.0% |
| Sumner Beat 5 Voting District | 636 | 456 | 17.3% | 0.5% | 78.6% | 0.0% | $35k | 16.7% | 21.0% | 14.4% | 54.2% | 30.0% | 0.2% |
| Teasdale Voting District | 793 | 634 | 74.4% | 0.0% | 23.5% | 0.0% | $56k | 9.4% | 31.6% | 14.4% | 91.8% | 5.2% | 0.0% |
| Tippo Voting District | 561 | 392 | 30.8% | 0.0% | 66.8% | 0.0% | $42k | 6.3% | 30.9% | 14.9% | 74.7% | 41.6% | 0.1% |
| Tutwiler Voting District | 2,084 | 1,819 | 9.2% | 3.4% | 87.1% | 0.1% | $34k | 11.2% | 15.7% | 18.4% | 36.2% | 9.0% | 3.2% |
| Webb Beat 2 Voting District | 82 | 59 | 22.6% | 0.6% | 74.6% | 0.0% | $38k | 22.0% | 17.6% | 17.4% | 60.5% | 20.2% | 0.0% |
| Webb Beat 4 Voting District | 174 | 126 | 16.8% | 0.4% | 79.1% | 0.0% | $35k | 19.2% | 20.1% | 14.8% | 55.5% | 30.4% | 0.2% |
| Webb Beat 5 Voting District | 234 | 167 | 21.2% | 0.7% | 75.4% | 0.0% | $37k | 16.5% | 20.1% | 15.7% | 56.4% | 23.6% | 0.0% |
Carroll: 14 precincts
| Precinct | Population | Voting-age pop. | % White non-Hisp. | % Hispanic | % Black | % Asian | Median income* | % Bachelor's+ | % 18-29 (of adults) | % 65+ | % Homeowners | % Below poverty | % Spanish at home (adults) |
|---|---|---|---|---|---|---|---|---|---|---|---|---|---|
| Black Hawk Voting District | 521 | 404 | 64.6% | 0.0% | 32.4% | 0.0% | $67k | 22.0% | 9.2% | 22.3% | 92.6% | 5.8% | 0.0% |
| Calvary Voting District | 329 | 300 | 66.7% | 0.0% | 23.9% | 0.0% | $39k | 22.1% | 6.2% | 28.8% | 88.2% | 16.9% | 0.9% |
| Carrollton Voting District | 593 | 426 | 55.6% | 0.0% | 43.1% | 0.4% | $56k | 18.0% | 10.6% | 15.6% | 68.9% | 20.3% | 0.1% |
| East Vaiden Voting District | 1,157 | 964 | 67.5% | 0.0% | 31.7% | 0.0% | $102k | 19.4% | 26.7% | 21.3% | 84.9% | 16.8% | 0.0% |
| Fire Tower Voting District | 891 | 738 | 47.7% | 0.0% | 50.8% | 0.1% | $55k | 23.0% | 8.7% | 23.6% | 85.8% | 26.0% | 0.0% |
| Gravel Hill Voting District | 614 | 471 | 65.6% | 0.0% | 31.4% | 0.0% | $68k | 23.1% | 8.6% | 21.8% | 92.8% | 4.0% | 0.0% |
| Jefferson Voting District | 345 | 315 | 66.8% | 0.0% | 23.7% | 0.0% | $39k | 22.2% | 6.2% | 28.7% | 88.2% | 16.8% | 0.9% |
| McCarley Voting District | 585 | 530 | 58.2% | 0.0% | 34.9% | 0.0% | $39k | 25.2% | 5.4% | 28.5% | 89.6% | 20.8% | 0.7% |
| North Carrollton Voting District | 1,025 | 772 | 61.5% | 0.0% | 36.1% | 0.9% | $58k | 18.2% | 10.9% | 20.3% | 73.0% | 17.6% | 0.1% |
| Ray's Shop Voting District | 1,269 | 1,109 | 89.1% | 0.0% | 5.8% | 4.3% | $72k | 25.2% | 10.6% | 31.4% | 87.8% | 4.9% | 0.0% |
| Salem Voting District | 401 | 365 | 38.5% | 0.0% | 60.3% | 0.0% | $45k | 25.1% | 8.2% | 29.2% | 92.4% | 34.8% | 0.0% |
| Voting District 430 School | 319 | 304 | 46.2% | 0.0% | 49.9% | 0.0% | $46k | 3.7% | 18.9% | 32.3% | 89.0% | 39.7% | 0.0% |
| West Carroll Voting District | 403 | 327 | 77.2% | 0.0% | 18.8% | 1.9% | $70k | 19.7% | 12.1% | 30.9% | 85.9% | 5.0% | 0.0% |
| West Vaiden Voting District | 1,220 | 973 | 49.2% | 0.0% | 49.9% | 0.0% | $107k | 20.5% | 14.6% | 25.1% | 69.1% | 32.7% | 0.0% |
Montgomery: 15 precincts
| Precinct | Population | Voting-age pop. | % White non-Hisp. | % Hispanic | % Black | % Asian | Median income* | % Bachelor's+ | % 18-29 (of adults) | % 65+ | % Homeowners | % Below poverty | % Spanish at home (adults) |
|---|---|---|---|---|---|---|---|---|---|---|---|---|---|
| Duck Hill Voting District | 1,078 | 856 | 51.4% | 0.0% | 35.0% | 0.1% | $35k | 10.1% | 11.8% | 12.7% | 78.9% | 12.5% | 0.0% |
| East Winona Voting District | 1,118 | 901 | 47.6% | 0.0% | 51.8% | 0.0% | $26k | 21.2% | 23.1% | 20.1% | 61.6% | 42.4% | 0.0% |
| Kilmichael Voting District | 1,036 | 872 | 51.7% | 0.1% | 45.4% | 0.0% | $49k | 24.0% | 13.5% | 25.9% | 88.4% | 17.3% | 0.5% |
| Lodi Voting District | 316 | 270 | 66.7% | 0.3% | 30.5% | 0.0% | $51k | 23.6% | 0.0% | 32.9% | 76.7% | 28.1% | 0.0% |
| Mt. Pisgah Voting District | 285 | 242 | 65.7% | 0.3% | 31.4% | 0.0% | $50k | 23.2% | 0.6% | 32.2% | 76.5% | 27.7% | 0.0% |
| Nations Voting District | 500 | 320 | 59.4% | 1.7% | 36.3% | 0.0% | $73k | 25.2% | 17.8% | 22.1% | 98.2% | 25.3% | 3.7% |
| North Duck Hill Voting District | 278 | 222 | 40.3% | 0.0% | 52.5% | 0.1% | $31k | 10.0% | 16.6% | 14.0% | 70.9% | 18.6% | 0.0% |
| North Kilmicheal Voting District | 112 | 96 | 50.4% | 0.1% | 46.4% | 0.0% | $48k | 22.2% | 10.1% | 28.0% | 80.7% | 18.5% | 0.3% |
| North Mt. Pisgah - Sweethome Voting District | 278 | 237 | 66.7% | 0.3% | 30.5% | 0.0% | $51k | 23.6% | 0.0% | 32.9% | 76.7% | 28.1% | 0.0% |
| North Winona Voting District | 899 | 729 | 57.6% | 0.0% | 40.4% | 0.0% | $26k | 24.3% | 23.9% | 18.6% | 56.7% | 39.8% | 0.0% |
| Poplar Creek Voting District | 320 | 204 | 59.4% | 1.7% | 36.3% | 0.0% | $73k | 25.2% | 17.8% | 22.1% | 98.2% | 25.3% | 3.7% |
| South Winona Voting District | 858 | 654 | 46.3% | 0.0% | 52.3% | 0.0% | $38k | 19.2% | 13.3% | 23.2% | 80.5% | 26.1% | 0.1% |
| Southeast Winona Voting District | 446 | 364 | 45.9% | 0.0% | 53.1% | 0.0% | $26k | 21.1% | 16.4% | 23.7% | 82.6% | 34.2% | 0.0% |
| Stewart Voting District | 93 | 60 | 60.1% | 1.6% | 35.6% | 0.0% | $72k | 25.2% | 17.1% | 22.5% | 97.5% | 25.2% | 3.6% |
| West Winona Voting District | 2,001 | 1,424 | 47.4% | 0.0% | 51.1% | 0.0% | $45k | 14.9% | 8.6% | 25.1% | 70.2% | 16.5% | 0.0% |
Tunica: 12 precincts
| Precinct | Population | Voting-age pop. | % White non-Hisp. | % Hispanic | % Black | % Asian | Median income* | % Bachelor's+ | % 18-29 (of adults) | % 65+ | % Homeowners | % Below poverty | % Spanish at home (adults) |
|---|---|---|---|---|---|---|---|---|---|---|---|---|---|
| Banks/Hambrick Voting District | 404 | 212 | 4.8% | 2.0% | 92.6% | 0.0% | $45k | 5.1% | 31.3% | 6.5% | 12.4% | 59.3% | 3.9% |
| Mhoon Landing Voting District | 671 | 509 | 23.7% | 1.3% | 75.0% | 0.0% | $42k | 13.2% | 16.7% | 12.5% | 25.6% | 13.8% | 4.1% |
| New Sub Voting District | 641 | 470 | 13.3% | 0.7% | 85.9% | 0.0% | $46k | 12.4% | 29.7% | 15.6% | 52.4% | 41.8% | 1.0% |
| Prichard Voting District | 808 | 527 | 12.9% | 2.6% | 84.2% | 0.0% | $52k | 13.0% | 26.6% | 13.1% | 47.1% | 46.3% | 3.9% |
| Robinsonville Voting District | 1,409 | 775 | 5.3% | 1.3% | 92.9% | 0.0% | $35k | 0.0% | 31.9% | 3.1% | 11.4% | 51.4% | 2.4% |
| Superintendent of Education Voting District | 784 | 637 | 41.8% | 0.8% | 57.1% | 0.0% | $38k | 25.2% | 15.3% | 28.8% | 48.3% | 19.6% | 1.6% |
| Tunica Auditorium Voting District | 921 | 750 | 15.9% | 1.0% | 83.0% | 0.0% | $41k | 8.7% | 13.6% | 16.5% | 35.0% | 36.4% | 3.1% |
| Tunica Voting District | 558 | 465 | 37.2% | 0.4% | 62.1% | 0.0% | $39k | 23.7% | 14.8% | 29.7% | 47.0% | 23.3% | 0.5% |
| Two Mile Lake Voting District | 899 | 717 | 28.0% | 5.3% | 66.7% | 0.0% | $58k | 20.4% | 12.9% | 18.4% | 82.1% | 13.8% | 6.4% |
| WIN Job Center Voting District | 890 | 659 | 4.9% | 0.0% | 95.1% | 0.0% | $46k | 10.3% | 24.0% | 8.5% | 12.3% | 9.6% | 0.0% |
| West End Store Voting District | 497 | 395 | 33.3% | 5.1% | 61.6% | 0.0% | $52k | 19.3% | 10.9% | 18.0% | 74.4% | 15.3% | 7.8% |
| White Oak Voting District | 1,013 | 745 | 15.8% | 1.9% | 82.4% | 0.0% | $48k | 14.4% | 26.1% | 16.0% | 55.4% | 37.6% | 3.2% |
Claiborne: 11 precincts
| Precinct | Population | Voting-age pop. | % White non-Hisp. | % Hispanic | % Black | % Asian | Median income* | % Bachelor's+ | % 18-29 (of adults) | % 65+ | % Homeowners | % Below poverty | % Spanish at home (adults) |
|---|---|---|---|---|---|---|---|---|---|---|---|---|---|
| District 1A | 1,364 | 1,062 | 12.9% | 0.0% | 86.9% | 0.0% | $37k | 23.1% | 15.3% | 29.2% | 72.4% | 24.5% | 0.1% |
| District 1B | 1,276 | 1,214 | 10.7% | 2.0% | 85.1% | 0.0% | $33k | 18.9% | 83.0% | 7.7% | 68.2% | 27.8% | 1.2% |
| District 1B | 0 | 0 | 25.0% | 0.0% | 75.0% | 0.0% | $33k | 33.3% | 33.3% | 25.0% | 50.0% | 25.0% | 0.0% |
| District 2A/B | 1,460 | 1,086 | 11.1% | 0.0% | 82.3% | 0.4% | $31k | 17.8% | 17.9% | 20.2% | 70.6% | 35.5% | 0.5% |
| District 3A | 1,113 | 850 | 13.7% | 0.0% | 81.6% | 0.3% | $46k | 25.7% | 20.2% | 24.6% | 73.8% | 33.1% | 1.2% |
| District 3B | 249 | 222 | 21.4% | 0.0% | 75.7% | 0.0% | $26k | 9.4% | 23.5% | 24.0% | 83.3% | 41.3% | 0.0% |
| District 4A/B | 773 | 618 | 16.2% | 0.0% | 79.6% | 0.4% | $30k | 13.0% | 21.0% | 21.8% | 85.4% | 33.1% | 0.0% |
| District 4C | 1 | 1 | 22.2% | 0.0% | 77.8% | 0.0% | $59k | 36.0% | 13.0% | 36.5% | 67.6% | 25.4% | 0.0% |
| District 4D | 448 | 398 | 20.8% | 0.0% | 76.5% | 0.0% | $26k | 9.6% | 23.1% | 24.2% | 83.7% | 41.3% | 0.0% |
| District 5A | 962 | 645 | 1.2% | 0.0% | 98.4% | 0.0% | $38k | 23.5% | 12.6% | 11.1% | 86.1% | 14.4% | 0.0% |
| District 5B | 894 | 588 | 5.6% | 0.0% | 94.4% | 0.0% | $29k | 7.2% | 18.4% | 17.3% | 82.1% | 36.3% | 0.0% |
Wilkinson: 10 precincts
| Precinct | Population | Voting-age pop. | % White non-Hisp. | % Hispanic | % Black | % Asian | Median income* | % Bachelor's+ | % 18-29 (of adults) | % 65+ | % Homeowners | % Below poverty | % Spanish at home (adults) |
|---|---|---|---|---|---|---|---|---|---|---|---|---|---|
| Centreville First District Precinct | 608 | 476 | 23.8% | 0.1% | 74.3% | 0.0% | $38k | 9.5% | 24.5% | 17.6% | 90.0% | 16.8% | 0.0% |
| Centreville Third District Precinct | 2,840 | 1,834 | 22.0% | 0.3% | 71.1% | 0.0% | $40k | 9.4% | 17.3% | 15.7% | 66.5% | 25.0% | 0.2% |
| Cold Springs Precinct | 244 | 209 | 53.7% | 3.4% | 42.8% | 0.0% | $39k | 8.5% | 14.0% | 24.7% | 71.7% | 36.0% | 0.0% |
| Crosby Precinct | 403 | 330 | 55.4% | 4.8% | 39.8% | 0.0% | $41k | 10.4% | 22.7% | 17.9% | 79.5% | 34.6% | 0.0% |
| Fort Adams Precinct | 507 | 446 | 32.7% | 0.0% | 66.6% | 0.0% | $32k | 3.4% | 7.5% | 30.7% | 77.5% | 46.0% | 0.0% |
| Woodville 5 Sub A Voting District | 96 | 72 | 26.6% | 0.0% | 73.4% | 0.0% | $60k | 20.6% | 22.7% | 28.0% | 80.8% | 3.0% | 0.0% |
| Woodville Fifth District Precinct | 1,461 | 1,415 | 24.2% | 1.2% | 70.8% | 0.0% | $30k | 4.0% | 21.3% | 17.0% | 85.6% | 23.4% | 1.6% |
| Woodville First District Precinct | 629 | 608 | 48.0% | 1.6% | 42.9% | 0.0% | $53k | 20.9% | 15.1% | 24.6% | 89.2% | 34.5% | 0.0% |
| Woodville Fourth District Precinct | 569 | 505 | 23.9% | 0.6% | 73.5% | 0.0% | $34k | 5.4% | 18.6% | 22.4% | 82.8% | 28.5% | 1.0% |
| Woodville Second District Precinct | 788 | 615 | 23.0% | 0.0% | 76.3% | 0.0% | $40k | 10.7% | 20.2% | 25.4% | 89.5% | 27.4% | 0.0% |
Franklin: 14 precincts
| Precinct | Population | Voting-age pop. | % White non-Hisp. | % Hispanic | % Black | % Asian | Median income* | % Bachelor's+ | % 18-29 (of adults) | % 65+ | % Homeowners | % Below poverty | % Spanish at home (adults) |
|---|---|---|---|---|---|---|---|---|---|---|---|---|---|
| Antioch Voting District | 708 | 581 | 79.7% | 0.1% | 19.4% | 0.1% | $74k | 19.7% | 15.5% | 20.3% | 86.1% | 14.1% | 0.1% |
| Bad Bayou Voting District | 482 | 347 | 87.0% | 0.3% | 6.5% | 0.0% | $67k | 18.8% | 11.6% | 27.2% | 85.9% | 20.4% | 0.0% |
| Bude Voting District | 1,055 | 753 | 42.1% | 1.3% | 55.3% | 0.0% | $34k | 18.0% | 26.2% | 16.6% | 75.7% | 38.4% | 0.2% |
| Cains Voting District | 398 | 269 | 89.1% | 0.0% | 3.2% | 0.0% | $60k | 17.7% | 13.0% | 27.9% | 80.2% | 20.7% | 0.0% |
| Eddiceton Voting District | 1,010 | 747 | 58.4% | 0.2% | 40.9% | 0.0% | $34k | 14.8% | 23.9% | 18.9% | 74.7% | 38.7% | 0.2% |
| Hamburg Voting District | 270 | 212 | 64.3% | 1.6% | 33.6% | 0.5% | $74k | 34.4% | 13.4% | 25.2% | 90.1% | 7.1% | 0.6% |
| Knoxville Voting District | 294 | 250 | 60.3% | 4.5% | 35.2% | 0.0% | $54k | 14.0% | 7.7% | 28.4% | 64.6% | 6.8% | 0.0% |
| Lucien Voting District | 242 | 193 | 76.6% | 0.5% | 22.9% | 0.0% | $46k | 20.8% | 14.1% | 21.6% | 89.9% | 28.2% | 0.0% |
| McCall Creek Voting District | 478 | 410 | 73.7% | 1.1% | 25.3% | 0.0% | $69k | 20.1% | 11.5% | 19.4% | 95.5% | 23.6% | 0.0% |
| Meadville Voting District | 370 | 280 | 48.2% | 2.6% | 48.0% | 0.1% | $50k | 25.7% | 17.0% | 19.6% | 88.1% | 23.6% | 0.1% |
| Pine Grove Voting District | 759 | 572 | 58.2% | 1.4% | 39.4% | 0.0% | $43k | 23.8% | 18.0% | 19.3% | 89.6% | 28.0% | 0.0% |
| Roxie Voting District | 812 | 649 | 40.1% | 0.9% | 58.8% | 0.0% | $52k | 11.6% | 17.9% | 15.3% | 69.5% | 23.9% | 0.0% |
| Wesley Chapel Voting District | 257 | 218 | 60.3% | 4.4% | 35.3% | 0.0% | $54k | 14.3% | 7.8% | 28.4% | 65.2% | 7.3% | 0.0% |
| Whittington Voting District | 488 | 375 | 81.2% | 0.1% | 16.3% | 0.0% | $59k | 24.0% | 10.6% | 36.1% | 95.7% | 27.5% | 0.0% |
Humphreys: 13 precincts
| Precinct | Population | Voting-age pop. | % White non-Hisp. | % Hispanic | % Black | % Asian | Median income* | % Bachelor's+ | % 18-29 (of adults) | % 65+ | % Homeowners | % Below poverty | % Spanish at home (adults) |
|---|---|---|---|---|---|---|---|---|---|---|---|---|---|
| Belzoni North 2 Voting District | 1,012 | 699 | 1.0% | 0.0% | 96.0% | 0.0% | $50k | 9.2% | 56.0% | 1.7% | 34.5% | 21.8% | 0.0% |
| Belzoni North Voting District | 1,248 | 928 | 11.3% | 0.0% | 87.7% | 0.1% | $38k | 17.3% | 15.8% | 17.0% | 55.3% | 25.9% | 1.1% |
| Belzoni South Voting District | 79 | 54 | 0.0% | 0.0% | 100.0% | 0.0% | $27k | 22.2% | 9.3% | 17.7% | 78.9% | 22.8% | 0.0% |
| Belzoni South Voting District | 389 | 379 | 6.6% | 0.1% | 91.4% | 1.9% | $41k | 29.5% | 16.6% | 28.7% | 62.2% | 15.7% | 0.1% |
| Central Belzoni Voting District | 1,337 | 1,029 | 17.7% | 0.0% | 79.8% | 0.4% | $47k | 28.3% | 12.8% | 28.2% | 66.6% | 11.6% | 3.6% |
| Four Mile Voting District | 84 | 73 | 75.9% | 0.0% | 24.1% | 0.0% | $35k | 27.4% | 17.0% | 31.7% | 70.9% | 18.6% | 0.0% |
| Gooden Lake Voting District | 126 | 94 | 29.2% | 0.1% | 70.6% | 0.0% | $29k | 18.5% | 14.0% | 18.3% | 52.6% | 50.1% | 0.1% |
| Isola Voting District | 964 | 701 | 11.3% | 0.0% | 88.6% | 0.0% | $30k | 16.9% | 12.2% | 15.9% | 59.0% | 34.6% | 0.0% |
| Louise Voting District | 373 | 249 | 25.3% | 0.0% | 74.7% | 0.0% | $22k | 13.0% | 7.9% | 22.9% | 77.3% | 59.3% | 0.0% |
| Midnight Voting District | 524 | 365 | 18.7% | 0.0% | 81.2% | 0.0% | $25k | 17.6% | 10.3% | 19.9% | 69.9% | 45.4% | 0.0% |
| Putnam Voting District | 299 | 262 | 75.1% | 0.0% | 24.9% | 0.0% | $36k | 27.3% | 17.2% | 31.4% | 70.9% | 19.0% | 0.0% |
| Silver City Voting District | 635 | 477 | 46.2% | 2.8% | 50.7% | 0.2% | $52k | 17.2% | 11.6% | 20.2% | 72.2% | 31.1% | 1.7% |
| Wolf Lake/Lake City Voting District | 271 | 193 | 59.1% | 4.4% | 36.5% | 0.0% | $66k | 13.9% | 9.3% | 19.5% | 84.9% | 27.2% | 2.7% |
Jefferson: 12 precincts
| Precinct | Population | Voting-age pop. | % White non-Hisp. | % Hispanic | % Black | % Asian | Median income* | % Bachelor's+ | % 18-29 (of adults) | % 65+ | % Homeowners | % Below poverty | % Spanish at home (adults) |
|---|---|---|---|---|---|---|---|---|---|---|---|---|---|
| Cannonsburg Voting District | 127 | 111 | 14.5% | 11.4% | 70.2% | 0.0% | $52k | 5.2% | 14.8% | 34.5% | 87.6% | 13.1% | 0.9% |
| Chambliss Voting District | 1,234 | 759 | 1.2% | 0.1% | 98.1% | 0.4% | $18k | 17.5% | 22.8% | 10.0% | 53.9% | 63.8% | 0.3% |
| Church Hill Voting District | 360 | 329 | 25.4% | 15.6% | 52.7% | 0.0% | $50k | 4.7% | 11.9% | 47.0% | 90.7% | 8.7% | 0.0% |
| City Hall Voting District | 138 | 105 | 4.9% | 0.3% | 91.9% | 1.8% | $35k | 14.1% | 18.9% | 13.0% | 69.7% | 41.1% | 1.1% |
| Community Garden Center Voting District | 668 | 495 | 0.9% | 1.7% | 96.9% | 0.3% | $36k | 12.3% | 26.7% | 8.1% | 88.4% | 47.7% | 3.0% |
| Harriston Voting District | 236 | 205 | 7.0% | 1.5% | 89.2% | 0.1% | $45k | 19.2% | 19.1% | 18.5% | 88.1% | 14.0% | 0.8% |
| Lorman Voting District | 561 | 489 | 43.1% | 0.0% | 51.9% | 0.0% | $25k | 21.9% | 9.1% | 35.6% | 90.1% | 21.5% | 0.0% |
| Mt. Isreal Bap. Church Voting District | 592 | 492 | 7.4% | 2.8% | 89.1% | 0.0% | $49k | 11.8% | 18.8% | 18.7% | 85.9% | 20.6% | 1.8% |
| Multipurpose Center Voting District | 1,034 | 893 | 6.9% | 0.8% | 88.2% | 2.6% | $54k | 12.1% | 17.0% | 15.3% | 85.4% | 18.8% | 1.6% |
| Red Lick Voting District | 370 | 335 | 11.0% | 0.0% | 85.4% | 0.0% | $42k | 25.7% | 19.3% | 20.4% | 92.1% | 8.9% | 0.0% |
| Stampley Voting District | 779 | 638 | 0.0% | 4.1% | 95.9% | 0.0% | $56k | 7.8% | 18.9% | 15.7% | 77.5% | 19.6% | 2.2% |
| Union Church Voting District | 1,021 | 804 | 37.2% | 0.0% | 62.4% | 0.0% | $39k | 10.0% | 17.5% | 30.8% | 99.1% | 41.6% | 2.6% |
Quitman: 10 precincts
| Precinct | Population | Voting-age pop. | % White non-Hisp. | % Hispanic | % Black | % Asian | Median income* | % Bachelor's+ | % 18-29 (of adults) | % 65+ | % Homeowners | % Below poverty | % Spanish at home (adults) |
|---|---|---|---|---|---|---|---|---|---|---|---|---|---|
| Crenshaw Voting District | 101 | 70 | 6.8% | 0.1% | 91.9% | 0.0% | $36k | 21.0% | 23.1% | 17.0% | 60.4% | 35.6% | 0.0% |
| Crowder Voting District | 294 | 220 | 65.8% | 0.0% | 31.9% | 0.0% | $32k | 9.4% | 7.8% | 23.7% | 73.5% | 33.7% | 0.0% |
| Darling Voting District | 235 | 171 | 25.0% | 0.0% | 75.0% | 0.0% | $33k | 28.9% | 17.3% | 18.6% | 77.5% | 25.8% | 0.0% |
| District 3 North | 538 | 420 | 27.0% | 0.0% | 71.6% | 0.0% | $39k | 21.0% | 19.1% | 15.9% | 71.0% | 21.6% | 0.4% |
| District 3 South | 677 | 505 | 30.2% | 0.0% | 68.5% | 0.0% | $45k | 29.5% | 21.2% | 22.5% | 81.1% | 27.1% | 0.0% |
| Lambert Voting District | 810 | 658 | 41.1% | 0.3% | 57.1% | 0.0% | $42k | 13.4% | 20.0% | 22.2% | 55.7% | 24.7% | 0.0% |
| Northwest Marks Voting District | 675 | 530 | 27.5% | 0.3% | 70.1% | 0.0% | $41k | 18.9% | 22.0% | 14.9% | 71.4% | 23.9% | 0.3% |
| Sledge Voting District | 861 | 597 | 6.4% | 0.1% | 92.2% | 0.0% | $36k | 21.0% | 23.1% | 17.0% | 60.2% | 35.7% | 0.0% |
| Southwest Marks Voting District | 838 | 647 | 10.8% | 0.2% | 87.5% | 0.0% | $30k | 13.2% | 12.2% | 17.1% | 53.9% | 27.6% | 0.1% |
| West Lambert Voting District | 810 | 680 | 19.3% | 1.3% | 75.3% | 0.0% | $36k | 5.9% | 24.4% | 16.7% | 60.0% | 40.1% | 0.0% |
Sharkey: 10 precincts
| Precinct | Population | Voting-age pop. | % White non-Hisp. | % Hispanic | % Black | % Asian | Median income* | % Bachelor's+ | % 18-29 (of adults) | % 65+ | % Homeowners | % Below poverty | % Spanish at home (adults) |
|---|---|---|---|---|---|---|---|---|---|---|---|---|---|
| Anguilla 4 Voting District | 672 | 542 | 29.0% | 0.0% | 69.5% | 0.0% | $33k | 22.3% | 25.6% | 16.2% | 73.0% | 36.7% | 0.0% |
| Anguilla 5 Voting District | 240 | 194 | 28.9% | 0.0% | 69.6% | 0.0% | $32k | 22.2% | 25.7% | 16.3% | 73.0% | 36.6% | 0.0% |
| Cary Voting District | 318 | 248 | 20.6% | 2.5% | 76.7% | 0.2% | $31k | 11.5% | 25.0% | 21.3% | 66.4% | 32.2% | 0.6% |
| Delta City Voting District | 191 | 151 | 31.4% | 0.2% | 68.3% | 0.0% | $66k | 36.7% | 18.1% | 29.1% | 82.4% | 13.5% | 0.2% |
| Rolling Fork 1 Voting District | 1,008 | 766 | 24.1% | 0.1% | 75.6% | 0.2% | $38k | 10.0% | 21.8% | 19.2% | 62.5% | 30.6% | 0.0% |
| Rolling Fork 2 Voting District | 103 | 74 | 4.8% | 0.0% | 94.6% | 0.5% | $47k | 11.4% | 28.6% | 15.7% | 50.1% | 13.8% | 0.0% |
| Rolling Fork 3 Voting District | 1,093 | 799 | 18.5% | 0.0% | 81.2% | 0.3% | $43k | 13.6% | 25.0% | 15.3% | 59.8% | 30.1% | 0.0% |
| Rolling Fork 4 Voting District | 5 | 4 | 6.2% | 0.0% | 93.2% | 0.6% | $47k | 12.0% | 28.2% | 15.3% | 50.9% | 16.1% | 0.0% |
| Spanish Fort Voting District | 163 | 131 | 30.4% | 3.5% | 66.0% | 0.0% | $25k | 12.5% | 23.6% | 23.0% | 73.8% | 42.4% | 0.9% |
| Straight Bayou Voting District | 54 | 43 | 30.7% | 0.0% | 69.3% | 0.0% | $66k | 37.7% | 17.5% | 31.6% | 83.3% | 8.9% | 0.0% |
Issaquena: 5 precincts
| Precinct | Population | Voting-age pop. | % White non-Hisp. | % Hispanic | % Black | % Asian | Median income* | % Bachelor's+ | % 18-29 (of adults) | % 65+ | % Homeowners | % Below poverty | % Spanish at home (adults) |
|---|---|---|---|---|---|---|---|---|---|---|---|---|---|
| District 1 Voting District | 416 | 389 | 30.2% | 2.4% | 65.3% | 0.6% | $30k | 6.6% | 17.5% | 22.2% | 61.6% | 21.6% | 0.0% |
| District 2 Voting District | 183 | 171 | 29.9% | 2.4% | 65.6% | 0.6% | $30k | 6.6% | 17.5% | 22.3% | 61.6% | 21.5% | 0.0% |
| District 3 Voting District | 21 | 20 | 29.8% | 2.4% | 65.8% | 0.6% | $29k | 6.5% | 17.5% | 22.2% | 61.4% | 21.7% | 0.0% |
| District 4 Voting District | 166 | 159 | 44.8% | 0.1% | 52.8% | 0.0% | $43k | 14.3% | 15.9% | 30.4% | 74.3% | 8.4% | 0.0% |
| District 5 Voting District | 142 | 134 | 39.2% | 1.1% | 57.5% | 0.2% | $39k | 11.4% | 16.6% | 27.2% | 70.6% | 12.1% | 0.1% |
*Median income is approximate (see note above). ACS 2020-2024 5-year.
Nonpartisan voter information. GOTV Polling does not endorse any candidate.