
Mississippi's 3rd Congressional District
U.S. House · Mississippi · District 3 · General election: Tuesday, November 3, 2026
Candidates on the November 3 ballot
- Michael A. ChiaradioDemocratic
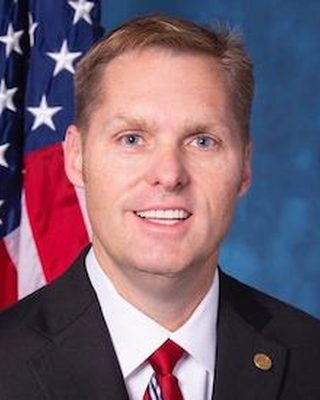 Michael GuestRepublicanPhoto: U.S. Congress
- Erik KiehleLibertarian
Source: Mississippi Secretary of State, Candidate Qualifying List, November 3, 2026 General Election, certified list (list retrieved 2026-10-30; retrieved 2026-10-30). Order of names does not reflect ballot order. Incumbent tags appear only where the official list marks incumbents. Photos come from the Candidate Alerts database where one is on file; otherwise initials are shown.
Federal campaign finance filings for this seat: FEC election page (FEC registration is not the same as ballot qualification).
Certified candidates
- Michael Guest RepublicanIncumbent @RepMichaelGuest
- Michael Alexis Chiaradio Democratic
- Erik Kiehle Libertarian
Certified candidate list from Candidate Alerts, as of 2026-09-24, based on Mississippi Secretary of State. Includes candidates the database marks as on the November 3 ballot. Incumbent tags here follow the database.
Past election results
Demographics
2020 Census demographics by district are not yet published in this data set.
0 of 499 precincts are above 50%, and 3 are above 25%. Source: Census American Community Survey 2020-2024 5-year block groups, allocated to current precinct shapes by area.
Poll status
Map
Share of adults (18+) who speak Spanish at home, by precinct. Census ACS 2020-2024 5-year estimates on the current precinct layer. Hover a precinct for its value.
District shown in red: U.S. Census Bureau cartographic boundary file for the 119th Congress (cb_2024_us_cd119_500k). These are the lines in effect for 2026 in this state per the Candidate Alerts district registry.
Precinct map: past elections and demographics
Choose a layer above. Hover a precinct for its values.
Precinct results
Precinct demographics
Demographics are Census American Community Survey (ACS) 2020-2024 5-year estimates for block groups, assigned to precincts by area share. They describe the resident population, not registered or likely voters, and include non-citizens. ACS margins of error are not shown; small precincts carry large error. Area weighting assumes people are spread evenly within each block group, so large rural precincts are the least reliable. Median income is a household-weighted average of block-group medians, an approximation.
| Area | Population | Voting-age pop. | % White non-Hisp. | % Hispanic | % Black | % Asian | Median income* | % Bachelor's+ | % 18-29 (of adults) | % 65+ | % Homeowners | % Below poverty | % Spanish at home (adults) |
|---|---|---|---|---|---|---|---|---|---|---|---|---|---|
| District | 735,014 | 565,195 | 58.3% | 3.0% | 33.6% | 1.2% | $69k | 28.7% | 21.0% | 17.4% | 72.6% | 18.2% | 2.3% |
| Rankin (in district) | 158,875 | 123,241 | 71.0% | 3.3% | 21.0% | 1.4% | $86k | 33.5% | 18.6% | 16.7% | 76.8% | 9.8% | 3.0% |
| Madison (in district) | 82,677 | 62,806 | 63.6% | 4.1% | 26.2% | 3.7% | $105k | 57.8% | 18.1% | 15.3% | 76.6% | 6.2% | 2.8% |
| Lauderdale (in district) | 71,391 | 54,674 | 50.4% | 2.6% | 40.8% | 0.7% | $60k | 23.6% | 18.9% | 18.6% | 65.1% | 26.3% | 1.9% |
| Oktibbeha (in district) | 48,499 | 40,295 | 53.7% | 2.4% | 36.4% | 3.4% | $57k | 48.1% | 49.2% | 11.2% | 45.1% | 26.5% | 1.2% |
| Pike (in district) | 39,412 | 29,361 | 41.5% | 1.7% | 53.5% | 0.5% | $46k | 15.3% | 20.8% | 17.9% | 66.8% | 27.0% | 0.8% |
| Lincoln (in district) | 34,770 | 26,738 | 67.0% | 1.3% | 30.0% | 0.5% | $57k | 19.3% | 17.6% | 17.8% | 75.0% | 21.2% | 0.4% |
| Neshoba (in district) | 28,879 | 20,937 | 57.4% | 0.8% | 21.2% | 0.7% | $66k | 17.7% | 20.7% | 16.9% | 78.1% | 23.0% | 0.4% |
| Scott (in district) | 27,641 | 19,861 | 45.9% | 15.5% | 33.8% | 0.1% | $56k | 13.5% | 19.1% | 15.9% | 71.3% | 22.1% | 10.9% |
| Simpson (in district) | 25,667 | 19,732 | 60.9% | 1.7% | 35.5% | 0.2% | $58k | 16.8% | 17.7% | 19.1% | 81.4% | 20.0% | 1.3% |
| Hinds (in district) | 25,259 | 19,210 | 45.2% | 3.8% | 47.7% | 0.7% | $78k | 61.6% | 23.6% | 15.3% | 58.6% | 18.1% | 4.0% |
| Marion (in district) | 24,184 | 18,521 | 63.4% | 1.9% | 31.2% | 0.3% | $48k | 13.7% | 18.4% | 18.8% | 77.2% | 19.7% | 1.7% |
| Newton (in district) | 21,117 | 16,037 | 59.7% | 1.9% | 31.5% | 0.5% | $51k | 19.3% | 22.2% | 17.3% | 79.1% | 24.7% | 1.5% |
| Covington (in district) | 18,128 | 13,725 | 59.4% | 2.6% | 34.8% | 0.2% | $55k | 17.4% | 18.9% | 17.6% | 77.5% | 19.7% | 2.2% |
| Winston (in district) | 17,581 | 13,684 | 49.4% | 0.6% | 47.1% | 0.1% | $57k | 19.7% | 16.9% | 21.7% | 73.0% | 26.9% | 0.7% |
| Jasper (in district) | 16,050 | 12,374 | 44.5% | 0.8% | 52.0% | 0.3% | $49k | 12.2% | 17.3% | 21.4% | 82.1% | 19.4% | 0.3% |
| Clarke (in district) | 15,327 | 11,990 | 62.7% | 1.1% | 31.2% | 0.2% | $51k | 17.5% | 17.2% | 22.3% | 82.3% | 17.4% | 0.8% |
| Smith (in district) | 14,118 | 10,890 | 73.2% | 1.7% | 23.1% | 0.3% | $58k | 15.6% | 16.3% | 20.9% | 87.4% | 17.0% | 2.6% |
| Walthall (in district) | 13,795 | 10,684 | 52.9% | 2.0% | 41.8% | 0.2% | $51k | 12.9% | 17.6% | 22.0% | 80.3% | 18.7% | 1.6% |
| Lawrence (in district) | 11,780 | 8,907 | 63.4% | 2.1% | 31.8% | 0.3% | $49k | 13.2% | 16.8% | 19.5% | 83.5% | 23.7% | 1.6% |
| Jefferson Davis (in district) | 11,148 | 8,938 | 37.8% | 0.7% | 59.4% | 0.0% | $41k | 12.7% | 16.3% | 24.5% | 84.4% | 28.6% | 1.0% |
| Noxubee (in district) | 10,017 | 7,502 | 25.5% | 0.4% | 73.5% | 0.1% | $44k | 10.7% | 20.3% | 18.2% | 73.0% | 26.3% | 1.8% |
| Jones (in district) | 9,970 | 7,970 | 63.9% | 2.9% | 28.7% | 0.8% | $62k | 19.1% | 21.4% | 19.4% | 67.6% | 17.9% | 2.2% |
| Kemper (in district) | 8,728 | 7,118 | 33.3% | 1.2% | 59.3% | 0.0% | $57k | 18.6% | 20.7% | 22.1% | 79.0% | 24.8% | 1.4% |
Rankin: 48 precincts
| Precinct | Population | Voting-age pop. | % White non-Hisp. | % Hispanic | % Black | % Asian | Median income* | % Bachelor's+ | % 18-29 (of adults) | % 65+ | % Homeowners | % Below poverty | % Spanish at home (adults) |
|---|---|---|---|---|---|---|---|---|---|---|---|---|---|
| Antioch-Mayton Voting District | 1,148 | 844 | 82.8% | 1.0% | 14.1% | 0.0% | $76k | 25.1% | 9.3% | 16.4% | 93.4% | 5.2% | 0.0% |
| Brandon Central Voting District | 3,333 | 2,685 | 75.4% | 4.4% | 19.5% | 0.2% | $85k | 34.6% | 17.7% | 19.6% | 83.2% | 5.2% | 3.2% |
| Brandon City Hall Voting District | 8,387 | 5,896 | 61.8% | 2.8% | 33.3% | 0.7% | $84k | 40.1% | 22.9% | 10.2% | 74.3% | 10.7% | 3.7% |
| Briarhill Voting District | 1,194 | 1,001 | 55.3% | 3.3% | 37.3% | 2.0% | $89k | 32.6% | 13.3% | 23.7% | 85.5% | 7.9% | 3.0% |
| Castlewoods Voting District | 5,543 | 4,305 | 77.0% | 3.4% | 15.9% | 0.6% | $112k | 46.4% | 17.4% | 18.8% | 82.2% | 2.4% | 6.8% |
| Castlewoods West Voting District | 5,582 | 4,253 | 75.9% | 2.6% | 16.0% | 2.3% | $88k | 57.6% | 17.0% | 16.4% | 72.4% | 11.6% | 1.6% |
| Cato Voting District | 1,208 | 961 | 76.9% | 0.0% | 21.2% | 0.0% | $59k | 32.1% | 19.1% | 33.9% | 82.0% | 18.4% | 0.0% |
| Clear Branch Voting District | 1,325 | 1,187 | 85.6% | 0.0% | 14.4% | 0.0% | $72k | 16.2% | 8.2% | 29.4% | 90.1% | 6.8% | 0.0% |
| Cleary Voting District | 3,229 | 2,508 | 87.9% | 1.4% | 6.9% | 2.0% | $83k | 22.9% | 18.6% | 22.1% | 81.0% | 9.2% | 1.3% |
| Crest Park Voting District | 2,286 | 1,773 | 63.2% | 8.4% | 16.5% | 3.7% | $58k | 27.1% | 23.1% | 17.8% | 71.3% | 14.6% | 8.6% |
| Crossroads Voting District | 579 | 397 | 98.1% | 0.1% | 1.7% | 0.0% | $81k | 31.3% | 11.2% | 20.4% | 91.0% | 9.6% | 0.0% |
| Cunningham Heights Voting District | 1,140 | 892 | 69.7% | 1.9% | 20.3% | 0.0% | $95k | 28.5% | 23.9% | 14.2% | 61.3% | 1.8% | 2.5% |
| Dry Creek Voting District | 3,271 | 2,790 | 72.4% | 1.6% | 23.4% | 0.8% | $73k | 20.3% | 20.4% | 27.3% | 90.5% | 10.3% | 1.2% |
| East Crossgates Voting District | 3,283 | 2,584 | 79.4% | 2.0% | 16.7% | 0.0% | $92k | 39.0% | 14.5% | 25.6% | 83.4% | 6.9% | 1.7% |
| East Steens Creek Voting District | 5,110 | 3,496 | 77.1% | 1.0% | 20.7% | 0.0% | $96k | 27.6% | 16.1% | 13.4% | 80.6% | 8.5% | 0.9% |
| Eldorado Voting District | 5,565 | 4,680 | 56.8% | 1.0% | 39.2% | 2.0% | $92k | 35.4% | 25.0% | 16.5% | 58.6% | 6.9% | 0.0% |
| Fannin Voting District | 3,480 | 2,705 | 80.6% | 0.8% | 13.7% | 1.3% | $104k | 34.1% | 11.2% | 14.7% | 90.9% | 3.0% | 0.8% |
| Flowood Library Voting District | 4,926 | 3,747 | 73.3% | 8.5% | 14.4% | 1.8% | $107k | 47.5% | 21.8% | 15.1% | 81.9% | 14.9% | 9.2% |
| Grant's Ferry Voting District | 5,999 | 4,301 | 68.1% | 3.5% | 15.9% | 3.1% | $98k | 48.4% | 19.8% | 12.7% | 83.3% | 9.5% | 2.4% |
| Greenfield Voting District | 8,211 | 6,215 | 68.7% | 1.7% | 26.6% | 1.3% | $86k | 19.8% | 20.9% | 9.4% | 86.5% | 10.5% | 2.6% |
| Highland/Patrick Farms Voting District | 4,919 | 3,751 | 47.0% | 8.2% | 42.5% | 1.0% | $63k | 20.9% | 19.5% | 15.1% | 51.6% | 22.1% | 4.7% |
| Holbrook Voting District | 3,648 | 2,862 | 86.0% | 1.7% | 9.8% | 0.8% | $98k | 43.6% | 19.9% | 7.7% | 64.9% | 5.5% | 2.2% |
| Johns Voting District | 1,206 | 898 | 83.2% | 1.0% | 14.3% | 0.0% | $76k | 26.1% | 9.5% | 17.4% | 93.8% | 4.7% | 0.0% |
| Leesburg Voting District | 1,422 | 1,158 | 90.6% | 1.5% | 3.5% | 0.0% | $68k | 17.2% | 26.0% | 25.6% | 89.3% | 8.5% | 0.0% |
| Liberty Voting District | 5,434 | 4,665 | 64.2% | 4.5% | 22.0% | 4.3% | $99k | 52.9% | 29.8% | 16.9% | 42.7% | 9.2% | 4.2% |
| Mountain Creek Voting District | 987 | 847 | 77.3% | 0.0% | 22.7% | 0.0% | $69k | 14.9% | 8.9% | 25.1% | 83.8% | 6.5% | 0.0% |
| North Brandon Voting District | 4,667 | 3,808 | 71.4% | 1.5% | 24.4% | 0.1% | $101k | 43.3% | 17.0% | 21.6% | 87.7% | 4.9% | 1.9% |
| North McLaurin Voting District | 2,008 | 1,532 | 80.9% | 0.5% | 8.2% | 3.6% | $68k | 18.5% | 21.5% | 15.5% | 82.8% | 7.7% | 0.5% |
| North Richland Voting District | 3,918 | 3,082 | 67.9% | 2.1% | 21.3% | 1.4% | $55k | 21.2% | 25.5% | 15.5% | 58.3% | 18.3% | 1.6% |
| Northeast Brandon Voting District | 3,674 | 2,695 | 75.8% | 0.3% | 21.6% | 0.0% | $122k | 42.6% | 11.4% | 17.2% | 96.2% | 4.8% | 0.1% |
| Northshore Voting District | 3,052 | 2,338 | 79.0% | 2.2% | 13.4% | 4.2% | $112k | 54.3% | 11.9% | 18.3% | 94.8% | 8.0% | 1.1% |
| Oakdale Voting District | 4,964 | 3,564 | 72.6% | 1.1% | 23.1% | 0.0% | $103k | 40.6% | 15.8% | 11.8% | 91.8% | 12.8% | 1.7% |
| Pearl City Hall Voting District | 4,131 | 3,339 | 54.0% | 10.5% | 25.6% | 6.0% | $43k | 20.5% | 23.4% | 14.1% | 46.6% | 21.9% | 8.0% |
| Pelahatchie Voting District | 4,079 | 2,921 | 73.7% | 4.0% | 17.0% | 0.0% | $64k | 24.0% | 16.2% | 13.9% | 80.5% | 10.9% | 2.1% |
| Pisgah Voting District | 1,951 | 1,501 | 71.0% | 0.8% | 24.7% | 0.0% | $103k | 26.3% | 15.4% | 10.0% | 91.2% | 4.8% | 1.9% |
| Puckett Voting District | 1,379 | 942 | 75.1% | 0.2% | 16.2% | 0.0% | $59k | 19.5% | 14.4% | 18.2% | 80.2% | 20.2% | 0.0% |
| Reservoir East Voting District | 3,128 | 2,501 | 85.1% | 1.5% | 6.9% | 2.3% | $112k | 39.3% | 10.2% | 22.3% | 98.9% | 3.0% | 0.6% |
| Reservoir West Voting District | 3,438 | 2,801 | 87.4% | 0.9% | 2.9% | 0.1% | $99k | 46.8% | 17.1% | 24.9% | 81.3% | 3.8% | 1.7% |
| Shiloh Voting District | 606 | 428 | 84.2% | 2.1% | 8.3% | 0.0% | $60k | 23.8% | 10.0% | 7.0% | 94.1% | 7.6% | 0.1% |
| South Brandon Voting District | 2,048 | 1,677 | 82.1% | 9.2% | 5.4% | 0.7% | $81k | 20.0% | 20.6% | 20.6% | 90.2% | 10.2% | 4.7% |
| South McLaurin Voting District | 1,816 | 1,436 | 74.1% | 1.1% | 21.0% | 2.8% | $41k | 20.8% | 22.2% | 16.5% | 59.1% | 22.6% | 3.9% |
| South Pearson Voting District | 4,939 | 4,363 | 33.6% | 1.7% | 58.3% | 0.0% | $116k | 25.6% | 18.8% | 9.4% | 75.6% | 6.4% | 1.7% |
| South Richland Voting District | 4,716 | 3,516 | 69.2% | 9.5% | 14.8% | 2.8% | $73k | 19.6% | 19.3% | 17.5% | 75.4% | 7.8% | 8.6% |
| Springhill Voting District | 2,019 | 1,687 | 75.4% | 4.5% | 12.8% | 5.3% | $75k | 29.5% | 18.5% | 29.5% | 78.2% | 9.2% | 4.1% |
| Star Voting District | 1,586 | 1,096 | 60.5% | 1.4% | 32.6% | 0.0% | $64k | 30.6% | 10.6% | 14.7% | 90.8% | 34.5% | 0.2% |
| West Crossgates Voting District | 2,206 | 1,846 | 89.9% | 0.1% | 9.8% | 0.0% | $104k | 47.2% | 10.4% | 31.7% | 91.8% | 2.7% | 0.1% |
| West Pearl Voting District | 2,828 | 2,114 | 55.6% | 14.8% | 22.2% | 0.5% | $68k | 20.3% | 22.3% | 10.1% | 54.6% | 15.6% | 11.5% |
| West Steens Creek Voting District | 3,308 | 2,650 | 84.5% | 5.7% | 6.9% | 0.0% | $60k | 17.3% | 13.5% | 24.8% | 78.3% | 7.3% | 4.8% |
Madison: 24 precincts
| Precinct | Population | Voting-age pop. | % White non-Hisp. | % Hispanic | % Black | % Asian | Median income* | % Bachelor's+ | % 18-29 (of adults) | % 65+ | % Homeowners | % Below poverty | % Spanish at home (adults) |
|---|---|---|---|---|---|---|---|---|---|---|---|---|---|
| 1st Presbyterian Voting District | 4,127 | 2,954 | 77.4% | 2.8% | 14.0% | 5.3% | $134k | 54.6% | 11.9% | 14.6% | 91.1% | 6.9% | 0.2% |
| Canton National Guard Armory | 1,349 | 1,052 | 44.0% | 0.5% | 52.7% | 0.0% | $71k | 49.2% | 17.8% | 15.5% | 73.2% | 10.2% | 1.8% |
| China Grove Voting District | 3,976 | 2,716 | 78.8% | 4.5% | 11.9% | 3.3% | $117k | 67.9% | 15.3% | 10.8% | 99.2% | 3.2% | 1.2% |
| Colonial Heights Voting District | 3,144 | 2,323 | 23.0% | 13.8% | 60.8% | 0.7% | $51k | 38.5% | 46.2% | 7.4% | 24.7% | 14.8% | 9.0% |
| Fellowship Bible Church Voting District | 2,193 | 1,842 | 50.9% | 0.6% | 43.9% | 0.1% | $64k | 44.1% | 17.1% | 23.0% | 58.4% | 5.1% | 2.2% |
| Ferns Chapel Freewill Voting District | 1,721 | 1,305 | 77.6% | 0.0% | 20.1% | 0.8% | $64k | 29.5% | 14.0% | 25.7% | 80.7% | 11.7% | 0.3% |
| First Baptist Voting District | 3,766 | 2,871 | 71.0% | 4.7% | 16.2% | 6.9% | $99k | 63.4% | 18.9% | 16.5% | 87.6% | 6.7% | 3.8% |
| Frankin Baptist Church Voting District | 551 | 360 | 88.8% | 0.0% | 10.9% | 0.0% | $86k | 30.2% | 3.2% | 19.5% | 85.3% | 8.6% | 0.0% |
| Gluckstadt Voting District | 3,800 | 2,547 | 66.8% | 1.4% | 20.5% | 7.4% | $130k | 73.7% | 18.2% | 7.3% | 74.0% | 1.7% | 1.5% |
| Grace Crossing Voting District | 6,864 | 4,943 | 72.2% | 4.4% | 17.7% | 3.2% | $114k | 55.5% | 13.0% | 10.6% | 96.1% | 3.7% | 1.2% |
| Highland Colony Bap. Ch. Voting District | 5,284 | 4,411 | 74.5% | 1.6% | 16.8% | 4.8% | $140k | 71.8% | 16.0% | 22.8% | 87.1% | 3.6% | 1.9% |
| Lake Caroline Clubhouse Voting District | 5,934 | 4,645 | 81.9% | 2.5% | 13.1% | 1.5% | $148k | 59.0% | 12.6% | 20.6% | 95.2% | 1.9% | 0.6% |
| Mark Apartments Voting District | 5,625 | 4,332 | 19.4% | 11.3% | 62.1% | 2.4% | $58k | 40.7% | 28.2% | 8.5% | 15.0% | 19.4% | 5.9% |
| New Life Voting District | 3,781 | 2,993 | 77.4% | 4.1% | 16.0% | 1.5% | $106k | 61.1% | 16.0% | 19.3% | 97.0% | 2.3% | 2.2% |
| NorthBay Voting District | 347 | 271 | 85.2% | 6.6% | 5.0% | 1.0% | $139k | 79.4% | 17.3% | 17.5% | 97.3% | 11.9% | 7.2% |
| Parkway Church Voting District | 5,256 | 3,794 | 76.1% | 2.3% | 11.0% | 8.1% | $153k | 70.5% | 11.9% | 12.4% | 97.3% | 1.3% | 0.7% |
| Ridgeland First Meth. Ch. Voting District | 2,965 | 2,493 | 67.0% | 2.7% | 23.6% | 2.0% | $85k | 55.8% | 18.4% | 23.1% | 81.7% | 7.7% | 1.6% |
| Ridgeland Recreational Center Voting District | 6,093 | 4,532 | 52.0% | 4.7% | 37.5% | 1.2% | $86k | 55.1% | 27.6% | 14.9% | 53.1% | 7.1% | 3.5% |
| SunnyBrook Voting District | 1,076 | 826 | 49.4% | 0.0% | 33.5% | 14.2% | $93k | 57.4% | 19.9% | 8.7% | 87.5% | 7.6% | 5.4% |
| Trace Ridge Voting District | 2,893 | 2,390 | 43.3% | 0.7% | 44.9% | 6.5% | $80k | 54.3% | 17.7% | 16.7% | 65.9% | 6.8% | 0.4% |
| Twin Lakes Baptist Voting District | 4,215 | 3,549 | 57.2% | 0.9% | 34.8% | 5.6% | $101k | 50.9% | 22.4% | 24.3% | 87.5% | 9.5% | 3.6% |
| Vertical Church Voting District | 4,317 | 3,066 | 59.4% | 9.7% | 30.3% | 0.5% | $118k | 61.0% | 5.7% | 7.8% | 95.7% | 1.6% | 10.1% |
| Victory Baptist Church Voting District | 1,023 | 776 | 86.2% | 6.9% | 3.4% | 1.2% | $150k | 80.4% | 15.8% | 15.8% | 97.2% | 14.3% | 8.2% |
| Victory Christian Voting District | 2,379 | 1,814 | 81.3% | 0.1% | 9.1% | 8.0% | $97k | 62.0% | 15.1% | 17.7% | 94.8% | 3.6% | 0.1% |
Lauderdale: 51 precincts
| Precinct | Population | Voting-age pop. | % White non-Hisp. | % Hispanic | % Black | % Asian | Median income* | % Bachelor's+ | % 18-29 (of adults) | % 65+ | % Homeowners | % Below poverty | % Spanish at home (adults) |
|---|---|---|---|---|---|---|---|---|---|---|---|---|---|
| Alamucha Voting District | 565 | 432 | 80.6% | 0.0% | 15.6% | 0.0% | $66k | 20.1% | 17.1% | 24.4% | 88.3% | 23.6% | 0.0% |
| Andrews Chapel Voting District | 1,416 | 1,049 | 62.5% | 2.5% | 26.2% | 2.0% | $83k | 40.4% | 12.6% | 20.8% | 82.2% | 17.8% | 1.1% |
| Bailey Voting District | 3,433 | 2,471 | 39.1% | 2.5% | 51.3% | 0.2% | $71k | 27.2% | 21.0% | 17.0% | 80.9% | 37.6% | 0.0% |
| Causeyville Voting District | 983 | 808 | 73.4% | 2.8% | 14.1% | 0.0% | $71k | 29.5% | 22.1% | 17.8% | 82.5% | 9.4% | 1.9% |
| Center Hill Voting District | 1,148 | 901 | 82.8% | 2.1% | 14.3% | 0.0% | $60k | 30.1% | 8.8% | 21.3% | 80.1% | 25.2% | 1.6% |
| Center Ridge Voting District | 670 | 528 | 45.4% | 1.4% | 50.8% | 0.7% | $61k | 9.8% | 20.0% | 17.8% | 76.6% | 12.6% | 2.1% |
| Clarkdale Voting District | 1,836 | 1,235 | 85.4% | 1.3% | 3.1% | 0.0% | $69k | 32.8% | 18.4% | 12.2% | 92.6% | 17.0% | 7.7% |
| Collinsville Voting District | 2,321 | 1,897 | 90.7% | 0.0% | 7.2% | 0.0% | $89k | 26.3% | 14.5% | 20.4% | 86.2% | 9.9% | 0.3% |
| Culpepper Voting District | 571 | 373 | 85.5% | 2.2% | 2.1% | 0.0% | $81k | 33.7% | 12.6% | 13.7% | 95.4% | 12.5% | 7.9% |
| Daleville Voting District | 1,023 | 684 | 90.2% | 3.0% | 3.8% | 0.1% | $88k | 43.6% | 6.2% | 11.3% | 95.5% | 15.2% | 2.6% |
| East Lauderdale Voting District | 1,866 | 1,624 | 66.9% | 6.2% | 17.4% | 2.3% | $62k | 33.1% | 34.3% | 21.5% | 63.1% | 10.8% | 4.0% |
| East Marion Voting District | 1,425 | 922 | 39.4% | 4.4% | 51.8% | 0.0% | $40k | 14.3% | 20.8% | 15.5% | 56.6% | 44.1% | 5.4% |
| Kewanee Voting District | 749 | 584 | 63.9% | 4.2% | 26.6% | 0.0% | $48k | 17.0% | 20.0% | 25.6% | 72.2% | 28.1% | 5.3% |
| Marion Voting District | 1,416 | 869 | 37.8% | 4.3% | 56.5% | 0.0% | $68k | 38.0% | 18.1% | 17.1% | 64.6% | 14.5% | 1.9% |
| Martin Voting District | 1,734 | 1,222 | 96.7% | 0.0% | 2.1% | 0.0% | $90k | 23.8% | 15.8% | 18.5% | 91.2% | 5.1% | 0.0% |
| Meehan Voting District | 1,677 | 1,452 | 59.0% | 3.9% | 33.3% | 0.0% | $42k | 12.3% | 17.0% | 19.9% | 79.9% | 25.8% | 3.1% |
| Mt. Gilead Voting District | 638 | 481 | 78.8% | 0.4% | 16.6% | 0.0% | $63k | 18.2% | 17.5% | 24.5% | 87.5% | 25.6% | 0.2% |
| New Lauderdale Voting District | 2,082 | 1,612 | 68.4% | 5.6% | 14.1% | 4.7% | $82k | 33.5% | 19.8% | 14.9% | 87.0% | 11.6% | 3.3% |
| Obadiah Voting District | 747 | 480 | 82.9% | 5.1% | 9.4% | 0.0% | $70k | 38.3% | 13.0% | 7.9% | 93.7% | 28.6% | 4.4% |
| Odom Voting District | 872 | 643 | 49.1% | 5.0% | 40.7% | 0.0% | $55k | 9.6% | 18.1% | 20.3% | 85.5% | 24.3% | 2.0% |
| Pickard Voting District | 1,003 | 725 | 37.9% | 1.5% | 52.1% | 0.0% | $48k | 18.6% | 15.6% | 19.1% | 54.2% | 41.4% | 1.9% |
| Prospect Voting District | 1,144 | 877 | 52.9% | 3.5% | 33.6% | 3.3% | $81k | 39.5% | 14.0% | 25.1% | 68.6% | 15.5% | 2.4% |
| Russell Voting District | 544 | 416 | 61.1% | 6.9% | 28.0% | 0.0% | $50k | 17.3% | 19.6% | 22.0% | 74.4% | 20.6% | 7.1% |
| Sageville Voting District | 311 | 276 | 55.4% | 4.7% | 36.9% | 0.0% | $41k | 10.1% | 17.6% | 17.1% | 78.6% | 25.9% | 3.6% |
| South Nellieburg Voting District | 1,061 | 869 | 58.7% | 1.7% | 28.2% | 1.0% | $66k | 22.5% | 10.6% | 18.8% | 89.2% | 21.9% | 2.0% |
| South Russell Voting District | 206 | 156 | 62.0% | 6.6% | 27.6% | 0.0% | $50k | 16.7% | 19.4% | 21.8% | 76.0% | 19.9% | 6.8% |
| Suqualena Voting District | 2,905 | 2,440 | 77.2% | 0.3% | 16.7% | 0.5% | $101k | 22.1% | 10.4% | 19.8% | 87.9% | 12.3% | 1.1% |
| Toomsuba Voting District | 464 | 369 | 60.8% | 6.8% | 26.2% | 0.0% | $46k | 20.6% | 21.3% | 25.4% | 64.9% | 30.3% | 7.9% |
| Valley Voting District | 451 | 326 | 81.5% | 0.4% | 9.2% | 0.0% | $51k | 28.8% | 23.4% | 13.8% | 87.0% | 24.2% | 6.0% |
| Vimville Voting District | 1,469 | 1,115 | 57.7% | 5.8% | 31.9% | 0.0% | $71k | 17.1% | 15.8% | 17.2% | 82.8% | 14.8% | 2.8% |
| Voting District 1 | 3,361 | 2,654 | 53.0% | 2.5% | 36.2% | 1.1% | $75k | 38.2% | 21.2% | 23.0% | 59.4% | 13.6% | 2.2% |
| Voting District 10 | 2,555 | 1,934 | 14.8% | 9.9% | 67.5% | 0.4% | $27k | 11.6% | 13.0% | 21.3% | 49.9% | 48.9% | 1.8% |
| Voting District 11 | 663 | 477 | 13.0% | 1.7% | 84.2% | 0.5% | $23k | 5.7% | 8.3% | 24.3% | 23.2% | 54.4% | 2.5% |
| Voting District 12 | 1,599 | 1,265 | 6.8% | 0.5% | 88.1% | 1.2% | $30k | 6.1% | 7.1% | 22.9% | 43.6% | 39.3% | 0.0% |
| Voting District 13 | 3,938 | 2,933 | 34.4% | 2.8% | 49.8% | 1.1% | $46k | 28.3% | 21.2% | 17.5% | 53.1% | 16.0% | 1.4% |
| Voting District 14 | 613 | 558 | 11.8% | 0.9% | 85.8% | 0.0% | $18k | 3.7% | 25.6% | 15.9% | 21.3% | 44.6% | 1.3% |
| Voting District 15 | 461 | 385 | 25.8% | 8.2% | 58.1% | 0.0% | $18k | 7.7% | 23.8% | 21.4% | 4.7% | 59.4% | 3.0% |
| Voting District 17 | 98 | 76 | 52.1% | 2.6% | 41.0% | 1.3% | $35k | 11.0% | 8.1% | 25.2% | 52.7% | 25.3% | 2.3% |
| Voting District 18 | 504 | 389 | 41.1% | 4.9% | 52.4% | 0.5% | $48k | 11.0% | 5.2% | 20.2% | 41.3% | 41.9% | 6.4% |
| Voting District 19 | 886 | 705 | 63.3% | 1.9% | 26.8% | 1.7% | $46k | 15.6% | 15.0% | 22.4% | 82.3% | 19.0% | 1.3% |
| Voting District 2 | 483 | 413 | 31.5% | 0.0% | 64.1% | 0.2% | $35k | 26.5% | 24.3% | 26.0% | 57.2% | 41.8% | 0.1% |
| Voting District 3 | 1,957 | 1,460 | 7.9% | 0.1% | 82.3% | 2.0% | $46k | 21.8% | 27.9% | 11.3% | 58.4% | 25.6% | 0.1% |
| Voting District 4 | 812 | 644 | 27.0% | 5.7% | 59.9% | 6.2% | $37k | 33.7% | 6.1% | 16.7% | 65.5% | 21.3% | 7.2% |
| Voting District 5 | 4,012 | 3,367 | 51.3% | 0.5% | 42.8% | 0.7% | $72k | 32.7% | 19.4% | 23.7% | 41.4% | 23.7% | 0.6% |
| Voting District 6 | 3,989 | 2,491 | 37.7% | 0.4% | 59.8% | 0.2% | $31k | 19.4% | 25.1% | 13.6% | 39.6% | 65.0% | 0.6% |
| Voting District 7 | 1,977 | 1,747 | 9.6% | 2.2% | 83.5% | 1.3% | $21k | 10.0% | 27.3% | 12.8% | 39.6% | 31.1% | 0.0% |
| Voting District 8 | 2,286 | 1,720 | 12.8% | 0.3% | 81.1% | 0.0% | $40k | 6.9% | 30.5% | 12.9% | 52.7% | 40.7% | 0.0% |
| Voting District 9 | 1,358 | 1,073 | 11.1% | 1.9% | 80.9% | 0.0% | $31k | 4.9% | 26.3% | 20.0% | 44.7% | 61.6% | 2.5% |
| West Dalewood Voting District | 516 | 456 | 88.4% | 0.5% | 7.5% | 0.0% | $72k | 23.0% | 18.4% | 35.7% | 87.8% | 5.2% | 1.6% |
| Whynot Voting District | 1,079 | 854 | 78.4% | 2.6% | 13.8% | 0.0% | $77k | 35.1% | 14.6% | 19.1% | 89.7% | 4.3% | 2.1% |
| Zero Voting District | 1,512 | 1,236 | 66.6% | 1.5% | 21.7% | 0.2% | $56k | 19.6% | 22.5% | 20.1% | 80.6% | 19.0% | 1.0% |
Oktibbeha: 17 precincts
| Precinct | Population | Voting-age pop. | % White non-Hisp. | % Hispanic | % Black | % Asian | Median income* | % Bachelor's+ | % 18-29 (of adults) | % 65+ | % Homeowners | % Below poverty | % Spanish at home (adults) |
|---|---|---|---|---|---|---|---|---|---|---|---|---|---|
| Bell Schoolhouse Voting District | 553 | 479 | 43.3% | 2.7% | 53.8% | 0.0% | $82k | 37.6% | 5.3% | 37.4% | 87.1% | 4.9% | 0.0% |
| Center Grove/North Adaton Voting District | 1,348 | 928 | 48.3% | 0.4% | 32.6% | 0.0% | $51k | 33.9% | 9.8% | 24.9% | 73.7% | 14.1% | 0.0% |
| Central Starkville Voting District | 2,020 | 1,682 | 50.6% | 2.5% | 36.2% | 8.0% | $36k | 46.0% | 52.1% | 7.6% | 26.3% | 33.6% | 0.6% |
| Craig Springs/South Bradley Voting District | 517 | 423 | 77.6% | 0.1% | 19.8% | 0.2% | $56k | 11.8% | 32.8% | 12.6% | 64.8% | 13.3% | 0.0% |
| East Starkville Voting District | 1,263 | 1,243 | 72.9% | 0.7% | 19.0% | 4.2% | $25k | 57.2% | 87.7% | 2.8% | 15.5% | 48.2% | 1.4% |
| Hickory Grove/Southeast Oktibbeha Voting District | 8,221 | 7,486 | 57.9% | 1.9% | 34.1% | 2.4% | $42k | 46.2% | 76.6% | 5.3% | 33.2% | 32.6% | 1.6% |
| Needmore Voting District Voting District | 3,953 | 3,387 | 56.9% | 0.6% | 31.4% | 6.3% | $49k | 54.2% | 56.1% | 8.9% | 35.0% | 29.5% | 0.8% |
| North Longview Voting District | 1,594 | 1,206 | 47.6% | 1.0% | 45.0% | 0.0% | $41k | 47.4% | 33.0% | 15.0% | 54.7% | 28.5% | 0.4% |
| North Starkville 2 Voting District | 1,894 | 1,416 | 39.0% | 1.2% | 56.7% | 1.2% | $36k | 36.9% | 33.7% | 12.4% | 20.7% | 46.5% | 1.2% |
| North Starkville 3 Voting District | 5,260 | 4,467 | 44.0% | 2.6% | 46.1% | 5.4% | $38k | 37.8% | 52.1% | 10.9% | 37.5% | 35.4% | 0.7% |
| Oktoc Voting District | 1,578 | 1,170 | 47.2% | 0.4% | 52.4% | 0.0% | $58k | 38.1% | 15.8% | 19.4% | 88.7% | 18.0% | 1.4% |
| Osborn Voting District | 2,643 | 1,984 | 41.3% | 1.6% | 45.2% | 0.4% | $113k | 45.0% | 17.3% | 11.0% | 87.0% | 5.5% | 0.0% |
| Sessums Voting District | 3,063 | 2,596 | 58.0% | 1.1% | 29.6% | 8.9% | $71k | 57.2% | 45.4% | 13.4% | 73.3% | 16.1% | 0.8% |
| South Adaton Voting District | 1,073 | 865 | 65.5% | 3.5% | 26.9% | 0.0% | $38k | 59.6% | 37.5% | 15.3% | 38.8% | 22.7% | 0.0% |
| South Longview Voting District | 369 | 299 | 74.7% | 0.1% | 22.4% | 0.2% | $56k | 13.5% | 32.9% | 12.4% | 64.3% | 14.9% | 0.0% |
| South Starkville Voting District | 7,087 | 5,758 | 56.4% | 1.9% | 33.3% | 4.9% | $81k | 59.3% | 39.5% | 15.0% | 49.6% | 21.5% | 1.6% |
| West Starkville Voting District | 6,062 | 4,903 | 55.8% | 8.1% | 31.8% | 0.8% | $60k | 54.6% | 48.3% | 8.7% | 31.6% | 29.9% | 2.8% |
Pike: 25 precincts
| Precinct | Population | Voting-age pop. | % White non-Hisp. | % Hispanic | % Black | % Asian | Median income* | % Bachelor's+ | % 18-29 (of adults) | % 65+ | % Homeowners | % Below poverty | % Spanish at home (adults) |
|---|---|---|---|---|---|---|---|---|---|---|---|---|---|
| Alpha Center Library Voting District | 508 | 429 | 30.2% | 5.3% | 60.4% | 0.0% | $30k | 8.2% | 16.4% | 31.9% | 71.2% | 35.7% | 0.0% |
| American Legion Hut Voting District | 848 | 738 | 44.7% | 1.3% | 50.3% | 0.3% | $43k | 26.6% | 15.2% | 40.4% | 53.4% | 25.0% | 0.9% |
| Braswell Education Complex Voting District | 1,725 | 1,499 | 29.6% | 2.7% | 66.8% | 0.3% | $33k | 5.5% | 16.5% | 20.2% | 75.1% | 36.4% | 1.4% |
| Calvary Baptist Church Voting District | 1,484 | 1,029 | 81.0% | 0.0% | 16.3% | 1.7% | $72k | 15.9% | 15.3% | 15.1% | 80.1% | 23.7% | 0.0% |
| Church of Christ Voting District | 1,766 | 1,242 | 26.0% | 2.3% | 70.4% | 0.0% | $46k | 11.8% | 37.3% | 12.9% | 38.5% | 16.2% | 0.6% |
| Fernwood School Voting District | 1,985 | 1,569 | 20.3% | 3.5% | 73.6% | 0.1% | $39k | 9.3% | 18.2% | 20.6% | 71.8% | 28.1% | 0.9% |
| Holmesville Voting District | 1,741 | 1,215 | 65.0% | 0.8% | 33.4% | 0.0% | $53k | 8.3% | 13.3% | 13.3% | 66.1% | 15.3% | 0.4% |
| Johnston Chapel Methodist Church Voting District | 1,848 | 1,318 | 78.4% | 0.0% | 20.7% | 0.0% | $70k | 24.5% | 20.8% | 9.0% | 92.5% | 12.3% | 0.6% |
| Leggett Community Voting District | 1,012 | 756 | 43.4% | 0.5% | 53.5% | 0.0% | $41k | 10.6% | 15.3% | 16.5% | 77.6% | 29.8% | 0.5% |
| MEPA Bldg 98 East Voting District | 2,462 | 1,524 | 53.9% | 0.8% | 43.0% | 0.0% | $42k | 17.2% | 16.8% | 10.7% | 63.8% | 37.9% | 0.0% |
| Magnolia Community Center Voting District | 1,973 | 1,613 | 41.3% | 3.0% | 52.6% | 0.0% | $45k | 17.8% | 23.4% | 26.2% | 79.1% | 23.3% | 3.0% |
| Martin Luther King Center Voting District | 2,244 | 1,396 | 5.3% | 6.7% | 83.7% | 0.0% | $37k | 22.0% | 24.7% | 8.4% | 36.5% | 50.3% | 1.8% |
| New Hope Baptist Church Voting District | 1,717 | 1,193 | 13.0% | 1.5% | 84.5% | 0.0% | $30k | 6.7% | 18.1% | 18.3% | 36.1% | 29.9% | 0.2% |
| Old Jones School Voting District | 2,278 | 1,288 | 44.3% | 0.1% | 50.7% | 0.7% | $58k | 31.8% | 18.7% | 8.1% | 59.6% | 24.1% | 0.1% |
| Osyka City Hall Voting District | 815 | 765 | 31.7% | 2.2% | 60.4% | 0.1% | $67k | 3.3% | 8.7% | 17.6% | 81.1% | 49.1% | 1.9% |
| Pike County National Bank Voting District | 1,201 | 941 | 40.1% | 1.1% | 55.2% | 0.9% | $52k | 20.4% | 14.7% | 18.1% | 76.6% | 10.8% | 0.5% |
| Pisgah Methodist Church Voting District | 2,948 | 2,353 | 61.1% | 1.0% | 32.2% | 1.4% | $47k | 24.1% | 14.4% | 30.2% | 72.9% | 15.3% | 0.3% |
| SMCC Work Force Training Center Voting District | 1,804 | 1,427 | 60.3% | 0.7% | 36.5% | 0.3% | $42k | 17.4% | 26.9% | 19.2% | 79.8% | 31.9% | 0.8% |
| South McComb Baptist Church Voting District | 1,056 | 838 | 35.2% | 3.2% | 61.6% | 0.0% | $47k | 3.2% | 24.3% | 12.0% | 53.5% | 24.2% | 0.8% |
| South Pike Community Center Voting District | 1,020 | 762 | 4.9% | 0.0% | 94.5% | 0.0% | $46k | 3.7% | 52.5% | 11.4% | 32.0% | 14.2% | 0.0% |
| St. Mary of the Pines Voting District | 1,472 | 1,147 | 39.4% | 0.9% | 51.3% | 0.0% | $50k | 3.6% | 14.5% | 22.9% | 81.1% | 41.6% | 0.8% |
| Summit City Hall Voting District | 2,549 | 1,935 | 35.9% | 1.5% | 59.0% | 0.1% | $36k | 19.9% | 33.2% | 17.6% | 66.8% | 33.0% | 1.3% |
| Summit Learning Center Voting District | 505 | 366 | 28.4% | 3.7% | 64.4% | 0.1% | $33k | 18.0% | 35.8% | 13.8% | 65.9% | 38.8% | 1.8% |
| Unity MBC Voting District | 1,545 | 1,248 | 42.7% | 0.1% | 47.8% | 4.6% | $45k | 10.9% | 17.6% | 17.7% | 87.0% | 25.8% | 0.1% |
| West McComb Baptist Church Voting District | 907 | 769 | 42.7% | 1.7% | 51.8% | 0.3% | $56k | 24.0% | 11.9% | 39.5% | 82.4% | 8.9% | 0.0% |
Lincoln: 30 precincts
| Precinct | Population | Voting-age pop. | % White non-Hisp. | % Hispanic | % Black | % Asian | Median income* | % Bachelor's+ | % 18-29 (of adults) | % 65+ | % Homeowners | % Below poverty | % Spanish at home (adults) |
|---|---|---|---|---|---|---|---|---|---|---|---|---|---|
| Alexander Jr. High Voting District | 544 | 469 | 7.3% | 0.3% | 90.8% | 0.0% | $55k | 10.6% | 25.0% | 10.6% | 28.7% | 29.7% | 0.3% |
| Arlington Voting District | 1,611 | 1,236 | 86.5% | 0.7% | 11.2% | 1.1% | $76k | 24.1% | 18.8% | 11.4% | 88.4% | 14.8% | 0.2% |
| Big Springs Voting District | 497 | 418 | 91.0% | 0.0% | 6.9% | 0.0% | $59k | 22.0% | 21.8% | 23.1% | 89.8% | 18.6% | 0.4% |
| Bogue Chitto Voting District | 460 | 323 | 83.5% | 0.6% | 14.5% | 0.0% | $60k | 23.8% | 25.5% | 9.7% | 65.0% | 19.2% | 0.2% |
| Brignal/Rogers Circle Voting District | 1,065 | 796 | 32.9% | 1.1% | 65.3% | 0.0% | $44k | 12.0% | 15.8% | 15.2% | 62.6% | 24.7% | 1.4% |
| Caseyville Voting District | 1,739 | 1,210 | 58.4% | 0.0% | 40.3% | 0.0% | $84k | 9.5% | 23.1% | 7.4% | 86.8% | 10.7% | 0.4% |
| City Hall Voting District | 399 | 299 | 50.8% | 0.3% | 48.0% | 0.3% | $35k | 18.4% | 12.2% | 12.8% | 58.9% | 27.2% | 0.9% |
| East Lincoln Voting District | 573 | 447 | 94.5% | 1.6% | 2.5% | 0.5% | $44k | 13.0% | 17.7% | 27.5% | 92.4% | 33.8% | 0.0% |
| Enterprise Voting District | 1,704 | 1,367 | 94.2% | 0.9% | 3.4% | 0.3% | $61k | 15.8% | 16.4% | 29.8% | 90.8% | 19.9% | 0.0% |
| Fair River Voting District | 667 | 540 | 81.0% | 0.0% | 17.9% | 0.0% | $70k | 26.9% | 15.5% | 22.1% | 92.6% | 14.8% | 0.0% |
| Forrestry Voting District | 1,177 | 936 | 48.5% | 0.0% | 50.4% | 0.0% | $58k | 23.8% | 13.2% | 17.3% | 72.6% | 21.9% | 0.0% |
| Government Complex Voting District | 642 | 570 | 3.2% | 0.2% | 95.5% | 0.0% | $49k | 8.2% | 17.2% | 17.1% | 51.9% | 20.7% | 0.2% |
| Halbert Heights Voting District | 3,157 | 2,485 | 83.8% | 0.7% | 11.8% | 2.1% | $58k | 38.9% | 11.5% | 23.3% | 72.5% | 20.0% | 0.2% |
| Heucks Retreat Voting District | 1,181 | 965 | 77.5% | 0.0% | 19.0% | 0.0% | $53k | 18.2% | 18.8% | 19.2% | 81.4% | 17.0% | 0.7% |
| High School Voting District | 653 | 490 | 6.1% | 0.0% | 93.1% | 0.3% | $22k | 9.0% | 21.2% | 11.2% | 21.0% | 52.1% | 0.1% |
| Johnson Grove Voting District | 1,164 | 777 | 81.9% | 0.3% | 14.8% | 1.5% | $48k | 17.9% | 19.6% | 11.5% | 78.3% | 32.3% | 0.1% |
| Johnson Voting District | 1,079 | 856 | 94.5% | 1.6% | 3.2% | 0.2% | $69k | 18.5% | 19.8% | 13.9% | 77.9% | 9.4% | 1.2% |
| Lipsey School Voting District | 1,690 | 1,403 | 46.8% | 7.3% | 45.8% | 0.0% | $35k | 12.3% | 12.2% | 25.1% | 35.4% | 26.7% | 2.0% |
| Little Bahala Voting District | 603 | 510 | 79.9% | 0.0% | 11.9% | 0.0% | $63k | 22.8% | 30.4% | 12.6% | 80.4% | 12.5% | 1.5% |
| Loyd Star Voting District | 1,733 | 1,300 | 56.6% | 0.2% | 42.5% | 0.0% | $59k | 7.9% | 25.0% | 13.6% | 80.0% | 16.9% | 0.3% |
| Montgomery Voting District | 608 | 500 | 64.8% | 0.0% | 32.9% | 0.0% | $41k | 8.8% | 11.2% | 26.9% | 82.9% | 17.2% | 0.0% |
| New Sight Voting District | 2,684 | 1,841 | 63.0% | 0.0% | 36.1% | 0.0% | $50k | 27.0% | 16.6% | 13.2% | 86.9% | 28.8% | 0.0% |
| Norfield Voting District | 505 | 433 | 93.5% | 1.0% | 5.3% | 0.0% | $81k | 23.5% | 16.4% | 35.0% | 81.4% | 4.3% | 0.7% |
| Old Brook Voting District | 1,170 | 914 | 68.2% | 0.0% | 28.8% | 1.2% | $59k | 32.0% | 14.9% | 20.9% | 70.9% | 19.8% | 0.0% |
| Old Red Star Voting District | 867 | 712 | 83.7% | 0.0% | 14.8% | 0.0% | $50k | 17.6% | 23.7% | 21.2% | 74.6% | 13.1% | 0.0% |
| Pearlhaven Voting District | 1,550 | 1,174 | 13.8% | 0.3% | 85.4% | 0.2% | $17k | 6.8% | 21.4% | 15.5% | 36.1% | 46.4% | 0.3% |
| Ruth Voting District | 1,738 | 1,352 | 95.5% | 0.7% | 1.6% | 0.2% | $65k | 13.0% | 16.6% | 24.1% | 90.6% | 14.1% | 0.0% |
| Vaughn Voting District | 986 | 720 | 66.2% | 13.9% | 19.7% | 0.0% | $91k | 22.6% | 12.3% | 16.2% | 97.5% | 3.9% | 0.1% |
| West Lincoln Voting District | 1,559 | 1,130 | 84.0% | 0.4% | 12.8% | 1.8% | $62k | 20.1% | 17.0% | 12.2% | 91.5% | 25.9% | 0.0% |
| Zetus Voting District | 764 | 566 | 58.0% | 7.9% | 33.9% | 0.2% | $71k | 14.2% | 18.4% | 16.0% | 89.8% | 14.0% | 0.2% |
Neshoba: 27 precincts
| Precinct | Population | Voting-age pop. | % White non-Hisp. | % Hispanic | % Black | % Asian | Median income* | % Bachelor's+ | % 18-29 (of adults) | % 65+ | % Homeowners | % Below poverty | % Spanish at home (adults) |
|---|---|---|---|---|---|---|---|---|---|---|---|---|---|
| Arlington Voting District | 1,043 | 721 | 57.9% | 0.9% | 0.9% | 3.3% | $50k | 12.6% | 22.2% | 14.7% | 73.8% | 33.2% | 0.1% |
| Bogue Chitto Voting District | 63 | 63 | 36.0% | 0.0% | 18.3% | 0.0% | $57k | 4.0% | 37.3% | 28.2% | 91.0% | 21.8% | 0.0% |
| Burnside Voting District | 580 | 482 | 58.3% | 0.0% | 22.1% | 1.1% | $44k | 12.7% | 35.1% | 16.2% | 85.3% | 35.0% | 0.0% |
| Center Voting District | 803 | 581 | 84.2% | 0.0% | 9.9% | 0.0% | $49k | 8.0% | 31.7% | 22.1% | 68.6% | 17.4% | 0.0% |
| County Line Voting District | 1,329 | 901 | 67.5% | 0.1% | 12.1% | 0.0% | $63k | 21.6% | 17.1% | 14.7% | 69.2% | 32.8% | 0.2% |
| Deemer Voting District | 1,032 | 681 | 30.1% | 0.0% | 24.6% | 0.0% | $30k | 29.2% | 10.9% | 15.0% | 58.5% | 45.1% | 0.0% |
| Dixon Voting District | 1,314 | 883 | 78.1% | 0.0% | 20.5% | 0.0% | $66k | 4.6% | 11.2% | 11.8% | 90.5% | 18.2% | 0.0% |
| East Neshoba Voting District | 740 | 466 | 62.2% | 8.1% | 17.9% | 0.0% | $84k | 31.4% | 17.9% | 16.8% | 91.4% | 21.6% | 0.0% |
| Fairview Voting District | 1,168 | 780 | 33.6% | 0.0% | 26.9% | 0.2% | $55k | 11.9% | 32.9% | 13.9% | 81.2% | 22.6% | 0.0% |
| Forestdale Voting District | 545 | 473 | 66.0% | 0.8% | 30.4% | 0.0% | $83k | 36.9% | 15.5% | 24.8% | 93.6% | 24.6% | 0.0% |
| Fork Voting District | 307 | 210 | 91.5% | 0.8% | 5.3% | 1.6% | $51k | 12.5% | 23.9% | 16.7% | 71.4% | 33.1% | 0.0% |
| Fusky Voting District | 776 | 585 | 92.7% | 0.4% | 5.0% | 1.9% | $55k | 11.1% | 26.8% | 14.6% | 82.6% | 24.5% | 0.0% |
| Hays Voting District | 1,089 | 752 | 71.6% | 0.0% | 26.6% | 0.0% | $71k | 4.5% | 16.4% | 12.3% | 87.2% | 13.6% | 0.0% |
| Herbert Voting District | 500 | 371 | 99.6% | 0.0% | 0.4% | 0.0% | $56k | 5.2% | 16.9% | 26.6% | 76.0% | 17.6% | 0.0% |
| Hope Voting District | 511 | 417 | 54.0% | 1.7% | 33.7% | 0.0% | $57k | 15.2% | 19.0% | 13.9% | 71.5% | 25.1% | 0.0% |
| House Voting District | 948 | 820 | 99.6% | 0.0% | 0.2% | 0.0% | $79k | 7.4% | 24.6% | 26.8% | 87.8% | 7.7% | 0.0% |
| McDonald Voting District | 1,030 | 781 | 70.7% | 0.0% | 21.1% | 0.0% | $65k | 16.5% | 27.5% | 21.0% | 76.2% | 22.1% | 0.1% |
| Neshoba Voting District | 1,029 | 724 | 65.1% | 0.0% | 29.2% | 0.0% | $72k | 10.2% | 21.4% | 13.7% | 77.5% | 15.1% | 0.1% |
| North Bend Voting District | 1,305 | 946 | 85.7% | 0.0% | 8.2% | 0.0% | $107k | 16.2% | 13.2% | 18.7% | 91.1% | 9.2% | 0.0% |
| Northeast Philadelphia Voting District | 3,249 | 2,582 | 69.8% | 2.2% | 18.8% | 0.0% | $84k | 28.9% | 18.3% | 22.1% | 87.1% | 19.3% | 0.5% |
| Northwest Philadelphia Voting District | 2,863 | 2,007 | 30.0% | 1.8% | 62.7% | 0.0% | $64k | 20.1% | 22.1% | 11.4% | 67.5% | 18.2% | 2.9% |
| Pearl River Voting District | 2,196 | 1,533 | 12.2% | 0.8% | 1.9% | 4.4% | $51k | 12.6% | 23.0% | 12.2% | 80.3% | 28.7% | 0.2% |
| South Philadelphia Voting District | 437 | 307 | 42.7% | 0.0% | 51.6% | 0.0% | 34.9% | 16.3% | 19.8% | 55.0% | 43.8% | 0.0% | |
| Southeast Philadelphia Voting District | 1,587 | 1,194 | 48.3% | 0.2% | 42.5% | 1.6% | $86k | 29.5% | 14.0% | 24.2% | 65.3% | 30.8% | 0.3% |
| Tucker District 1 | 74 | 42 | 14.9% | 0.0% | 0.0% | 0.0% | $30k | 19.4% | 7.8% | 7.3% | 65.3% | 44.1% | 0.0% |
| Tucker District 3 | 1,209 | 780 | 57.9% | 0.0% | 2.4% | 0.3% | $44k | 10.9% | 20.6% | 14.2% | 78.3% | 30.2% | 0.0% |
| Zephyr Hill Voting District | 1,150 | 856 | 36.4% | 0.4% | 7.0% | 0.0% | $55k | 12.5% | 28.3% | 16.5% | 85.5% | 15.3% | 0.0% |
Scott: 23 precincts
| Precinct | Population | Voting-age pop. | % White non-Hisp. | % Hispanic | % Black | % Asian | Median income* | % Bachelor's+ | % 18-29 (of adults) | % 65+ | % Homeowners | % Below poverty | % Spanish at home (adults) |
|---|---|---|---|---|---|---|---|---|---|---|---|---|---|
| Clifton Voting District | 228 | 168 | 82.0% | 0.6% | 17.4% | 0.0% | $103k | 8.8% | 20.8% | 16.2% | 67.3% | 7.6% | 0.0% |
| Contrell Voting District | 503 | 464 | 55.5% | 0.0% | 43.6% | 0.0% | $65k | 8.1% | 22.3% | 15.6% | 87.8% | 13.8% | 0.0% |
| Cooperville/Springfield Voting District | 749 | 634 | 72.3% | 15.3% | 7.8% | 0.0% | $63k | 16.3% | 16.2% | 23.7% | 80.2% | 12.6% | 1.4% |
| East-West Morton Voting District | 4,285 | 2,723 | 46.4% | 26.2% | 23.5% | 0.0% | $60k | 13.6% | 14.1% | 17.0% | 60.7% | 18.6% | 19.0% |
| Forkville Voting District | 808 | 631 | 69.7% | 1.4% | 26.8% | 0.0% | $82k | 13.0% | 22.7% | 13.5% | 73.9% | 10.1% | 0.3% |
| Harperville Voting District | 1,731 | 1,242 | 40.9% | 25.8% | 29.5% | 0.0% | $50k | 7.0% | 12.6% | 14.1% | 96.4% | 26.2% | 9.2% |
| High Hill Voting District | 943 | 588 | 50.7% | 0.0% | 31.8% | 0.1% | $50k | 19.1% | 33.4% | 10.3% | 78.2% | 16.3% | 0.0% |
| Hillsboro Voting District | 1,278 | 929 | 30.4% | 12.7% | 52.5% | 0.1% | $49k | 11.1% | 21.3% | 19.8% | 85.5% | 23.7% | 7.6% |
| Homewood Voting District | 472 | 351 | 82.0% | 0.0% | 12.2% | 0.0% | $59k | 16.2% | 16.7% | 21.7% | 77.6% | 4.2% | 0.0% |
| Lake Voting District | 435 | 283 | 51.6% | 0.1% | 31.1% | 0.1% | $49k | 17.4% | 30.8% | 9.3% | 73.9% | 17.5% | 0.0% |
| Langs Mill Voting District | 1,765 | 1,348 | 53.7% | 7.2% | 35.7% | 0.3% | $47k | 11.6% | 19.4% | 21.6% | 68.2% | 29.9% | 10.0% |
| Liberty Voting District | 975 | 784 | 58.6% | 2.3% | 35.8% | 0.0% | $59k | 15.3% | 20.6% | 11.9% | 74.6% | 13.8% | 0.6% |
| Ludlow Voting District | 926 | 876 | 56.6% | 0.0% | 39.7% | 0.0% | $74k | 12.9% | 30.7% | 12.1% | 100.0% | 9.4% | 0.0% |
| North Forest Voting District | 2,904 | 1,943 | 27.6% | 29.0% | 38.0% | 0.0% | $49k | 21.9% | 21.1% | 14.8% | 58.1% | 32.3% | 21.5% |
| North Morton Voting District | 1,059 | 712 | 29.5% | 34.1% | 31.5% | 0.0% | $44k | 7.3% | 13.1% | 25.8% | 51.6% | 13.4% | 29.1% |
| Northeast Forest Voting District | 1,256 | 958 | 31.0% | 27.7% | 37.8% | 0.0% | $35k | 16.7% | 8.9% | 18.5% | 67.8% | 32.0% | 35.1% |
| Northwest Forest Voting District | 343 | 232 | 36.0% | 34.3% | 27.6% | 0.0% | $53k | 27.7% | 16.8% | 11.8% | 50.9% | 16.2% | 25.6% |
| Pulaski Voting District | 763 | 477 | 75.9% | 2.4% | 19.4% | 0.0% | $82k | 15.9% | 15.7% | 15.0% | 78.3% | 17.8% | 0.0% |
| Salem Voting District | 841 | 715 | 41.7% | 0.4% | 57.4% | 0.1% | $50k | 10.5% | 20.9% | 19.7% | 88.3% | 15.2% | 0.7% |
| Sebastapol Voting District | 1,057 | 763 | 68.4% | 1.1% | 30.2% | 0.0% | $43k | 12.5% | 9.4% | 11.0% | 81.3% | 14.1% | 0.0% |
| South Forest Voting District | 1,871 | 1,223 | 29.5% | 29.6% | 34.4% | 0.4% | $77k | 15.7% | 24.1% | 8.4% | 50.3% | 29.0% | 24.1% |
| Steele Voting District | 1,987 | 1,413 | 38.1% | 0.7% | 54.0% | 1.0% | $29k | 7.6% | 25.1% | 17.0% | 69.4% | 35.9% | 0.0% |
| Usry Voting District | 465 | 405 | 66.4% | 1.0% | 22.8% | 0.0% | $50k | 9.5% | 14.1% | 8.0% | 61.4% | 20.3% | 0.0% |
Simpson: 30 precincts
| Precinct | Population | Voting-age pop. | % White non-Hisp. | % Hispanic | % Black | % Asian | Median income* | % Bachelor's+ | % 18-29 (of adults) | % 65+ | % Homeowners | % Below poverty | % Spanish at home (adults) |
|---|---|---|---|---|---|---|---|---|---|---|---|---|---|
| Bowie Voting District | 1,060 | 737 | 81.9% | 1.6% | 14.8% | 0.0% | $65k | 27.5% | 17.1% | 12.9% | 86.9% | 15.5% | 1.0% |
| Braxton Voting District | 1,394 | 1,086 | 56.5% | 1.1% | 39.9% | 1.0% | $73k | 12.6% | 24.0% | 14.1% | 90.0% | 8.2% | 0.1% |
| Bridgeport Voting District | 857 | 679 | 39.0% | 0.0% | 60.0% | 0.0% | $61k | 18.4% | 31.5% | 16.5% | 92.7% | 9.1% | 0.5% |
| DLo Voting District | 495 | 407 | 72.4% | 0.4% | 24.5% | 0.0% | $61k | 14.4% | 16.6% | 23.1% | 85.1% | 14.8% | 0.2% |
| Dry Creek Voting District | 1,647 | 1,262 | 75.4% | 0.1% | 19.7% | 0.0% | $76k | 28.2% | 17.8% | 13.4% | 80.2% | 17.3% | 0.1% |
| Fork Church Voting District | 741 | 584 | 51.4% | 2.1% | 43.7% | 1.8% | $65k | 11.1% | 13.4% | 16.1% | 91.5% | 11.8% | 0.0% |
| Harrisville Voting District | 1,289 | 1,043 | 72.8% | 0.5% | 24.4% | 0.4% | $64k | 10.6% | 13.1% | 25.9% | 89.3% | 9.6% | 0.8% |
| Jupiter A Voting District | 426 | 339 | 51.6% | 1.5% | 45.8% | 0.0% | $38k | 19.2% | 18.1% | 26.0% | 66.7% | 29.0% | 1.0% |
| Jupiter Voting District | 557 | 435 | 55.7% | 0.9% | 41.4% | 0.5% | $65k | 14.0% | 24.5% | 16.2% | 83.9% | 12.7% | 0.2% |
| Magee 1 Voting District | 1,183 | 944 | 46.1% | 3.1% | 48.9% | 0.0% | $60k | 10.0% | 16.6% | 15.6% | 54.3% | 19.4% | 0.9% |
| Magee 2 A Voting District | 1,749 | 1,235 | 40.6% | 9.2% | 49.5% | 0.0% | $64k | 9.1% | 15.0% | 13.4% | 59.4% | 38.9% | 9.8% |
| Magee 2 Voting District | 674 | 530 | 66.4% | 4.1% | 27.2% | 0.0% | $55k | 15.8% | 13.0% | 19.9% | 79.8% | 23.4% | 3.4% |
| Magee 4-N Voting District | 379 | 276 | 49.5% | 6.9% | 43.2% | 0.0% | $66k | 13.1% | 16.9% | 15.4% | 66.7% | 28.7% | 4.1% |
| Magee 4-S Voting District | 2,425 | 1,949 | 63.7% | 0.3% | 35.7% | 0.0% | $45k | 18.3% | 16.8% | 20.8% | 68.8% | 23.6% | 0.7% |
| Magee 4N A Voting District | 281 | 195 | 75.0% | 6.2% | 18.8% | 0.0% | $72k | 31.6% | 19.8% | 18.6% | 95.8% | 18.9% | 0.0% |
| Mendenhall 1 Voting District | 257 | 204 | 56.5% | 0.8% | 42.1% | 0.0% | $40k | 15.9% | 15.6% | 19.3% | 72.3% | 33.4% | 2.8% |
| Mendenhall 3 Voting District | 1,516 | 1,272 | 77.6% | 0.3% | 19.2% | 0.0% | $52k | 17.5% | 13.1% | 33.0% | 86.9% | 22.7% | 0.3% |
| Merit Voting District | 1,486 | 1,185 | 56.5% | 1.7% | 40.3% | 0.8% | $46k | 16.6% | 15.3% | 19.1% | 74.7% | 25.9% | 1.9% |
| New Hope Voting District | 720 | 534 | 58.9% | 5.5% | 30.5% | 0.0% | $57k | 23.0% | 16.4% | 18.1% | 76.5% | 12.8% | 3.2% |
| Oak Grove A Voting District | 443 | 292 | 81.4% | 0.0% | 17.9% | 0.0% | $68k | 26.0% | 18.9% | 10.1% | 91.6% | 21.6% | 0.0% |
| Oak Grove B Voting District | 169 | 123 | 49.7% | 0.0% | 47.8% | 0.0% | $51k | 5.9% | 17.3% | 17.6% | 94.9% | 37.0% | 0.0% |
| Oak Grove Voting District | 708 | 453 | 91.5% | 0.0% | 8.5% | 0.0% | $72k | 33.6% | 19.6% | 8.2% | 90.2% | 16.4% | 0.0% |
| Pearl Sub A Voting District | 106 | 88 | 90.8% | 0.0% | 6.7% | 0.0% | $65k | 12.0% | 10.5% | 34.9% | 88.5% | 7.0% | 1.6% |
| Pearl Voting District | 999 | 815 | 76.2% | 0.0% | 21.7% | 0.0% | $62k | 9.4% | 11.8% | 28.0% | 88.9% | 10.3% | 0.9% |
| Pinola Voting District | 772 | 597 | 49.7% | 0.1% | 48.6% | 0.1% | $56k | 18.3% | 19.7% | 18.8% | 87.1% | 27.0% | 0.0% |
| Saratoga Voting District | 504 | 403 | 66.2% | 2.8% | 27.3% | 0.0% | $61k | 28.2% | 13.7% | 26.8% | 86.5% | 10.6% | 0.9% |
| Shivers A Voting District | 215 | 165 | 39.9% | 0.0% | 59.3% | 0.0% | $60k | 15.7% | 36.6% | 16.3% | 96.2% | 5.2% | 0.7% |
| Shivers Voting District | 725 | 532 | 45.8% | 0.0% | 52.9% | 0.0% | $56k | 8.5% | 32.2% | 16.9% | 98.1% | 14.6% | 0.6% |
| Sumrall Voting District | 768 | 599 | 79.6% | 0.0% | 16.9% | 0.0% | $76k | 11.1% | 22.8% | 23.9% | 92.6% | 15.5% | 0.0% |
| Weathersby Voting District | 1,124 | 772 | 23.0% | 0.6% | 75.8% | 0.0% | $56k | 17.0% | 14.0% | 22.0% | 94.8% | 38.7% | 0.0% |
Hinds: 13 precincts
| Precinct | Population | Voting-age pop. | % White non-Hisp. | % Hispanic | % Black | % Asian | Median income* | % Bachelor's+ | % 18-29 (of adults) | % 65+ | % Homeowners | % Below poverty | % Spanish at home (adults) |
|---|---|---|---|---|---|---|---|---|---|---|---|---|---|
| Voting District 14 | 1,060 | 940 | 65.6% | 5.0% | 23.4% | 4.9% | $34k | 64.6% | 34.0% | 30.6% | 38.5% | 30.6% | 5.1% |
| Voting District 16 | 1,900 | 1,219 | 33.5% | 0.6% | 57.2% | 0.6% | $59k | 43.1% | 17.0% | 6.1% | 44.6% | 48.6% | 0.1% |
| Voting District 17 | 764 | 657 | 71.9% | 0.1% | 26.7% | 1.2% | $107k | 82.8% | 16.4% | 22.2% | 66.6% | 2.6% | 0.1% |
| Voting District 32 | 2,171 | 1,817 | 88.9% | 0.5% | 7.3% | 0.9% | $116k | 74.7% | 20.5% | 29.6% | 66.2% | 9.5% | 1.4% |
| Voting District 33 | 413 | 295 | 92.6% | 0.4% | 5.5% | 1.5% | $189k | 79.1% | 12.5% | 12.3% | 76.5% | 4.1% | 2.4% |
| Voting District 34 | 2,042 | 1,628 | 90.6% | 2.2% | 4.0% | 0.4% | $129k | 84.1% | 15.6% | 20.2% | 75.2% | 10.4% | 1.6% |
| Voting District 35 | 2,006 | 1,468 | 74.7% | 2.0% | 20.4% | 0.0% | $99k | 73.5% | 16.9% | 11.9% | 69.9% | 2.5% | 1.2% |
| Voting District 36 | 1,782 | 1,370 | 13.9% | 2.2% | 82.8% | 0.1% | $97k | 59.5% | 28.5% | 4.2% | 64.2% | 3.2% | 8.7% |
| Voting District 44 | 3,187 | 1,886 | 9.4% | 11.6% | 78.3% | 0.2% | $62k | 36.1% | 12.8% | 10.7% | 83.8% | 18.4% | 6.7% |
| Voting District 46 | 3,690 | 2,830 | 18.8% | 4.9% | 76.0% | 0.0% | $82k | 50.5% | 21.6% | 20.4% | 48.5% | 23.2% | 6.3% |
| Voting District 78 | 3,105 | 2,394 | 11.9% | 5.7% | 75.8% | 0.9% | $42k | 45.3% | 22.7% | 9.2% | 40.8% | 31.6% | 6.6% |
| Voting District 8 | 959 | 908 | 63.0% | 0.4% | 30.5% | 1.6% | $56k | 72.1% | 48.2% | 19.5% | 58.0% | 7.9% | 1.0% |
| Voting District 9 | 2,179 | 1,798 | 75.8% | 1.4% | 19.4% | 0.4% | $79k | 84.9% | 42.1% | 12.6% | 62.6% | 9.3% | 2.5% |
Marion: 22 precincts
| Precinct | Population | Voting-age pop. | % White non-Hisp. | % Hispanic | % Black | % Asian | Median income* | % Bachelor's+ | % 18-29 (of adults) | % 65+ | % Homeowners | % Below poverty | % Spanish at home (adults) |
|---|---|---|---|---|---|---|---|---|---|---|---|---|---|
| Balls Mill Voting District | 1,138 | 828 | 60.0% | 8.7% | 31.1% | 0.0% | $34k | 13.9% | 10.7% | 17.8% | 67.0% | 26.1% | 7.2% |
| Carley Voting District | 1,372 | 1,081 | 75.2% | 1.9% | 11.6% | 0.0% | $54k | 15.3% | 16.7% | 13.6% | 79.0% | 19.9% | 5.1% |
| Cedar Grove Voting District | 444 | 364 | 75.5% | 3.4% | 18.5% | 0.0% | $60k | 23.6% | 16.6% | 12.7% | 70.3% | 18.6% | 5.7% |
| City Hall Voting District | 214 | 151 | 48.3% | 1.0% | 49.6% | 0.0% | $47k | 11.6% | 11.3% | 18.5% | 62.2% | 22.9% | 0.5% |
| Courthouse Voting District | 1,208 | 957 | 67.3% | 0.7% | 28.5% | 0.0% | $42k | 13.1% | 14.7% | 19.5% | 49.2% | 25.8% | 1.7% |
| Darbun Voting District | 225 | 180 | 74.9% | 0.0% | 25.1% | 0.0% | $39k | 14.3% | 12.2% | 30.4% | 64.1% | 23.4% | 0.0% |
| East Columbia Voting District | 1,798 | 1,409 | 39.9% | 2.5% | 53.5% | 0.9% | $52k | 19.3% | 19.6% | 23.0% | 77.4% | 14.7% | 0.6% |
| Foxworth Voting District | 1,329 | 1,015 | 73.2% | 3.9% | 17.5% | 0.0% | $44k | 9.9% | 29.3% | 13.9% | 79.2% | 31.9% | 5.8% |
| Goss Voting District | 878 | 674 | 83.9% | 0.0% | 13.2% | 0.0% | $79k | 30.0% | 14.3% | 11.4% | 89.6% | 17.5% | 0.0% |
| Hub Voting District | 1,206 | 938 | 49.3% | 1.9% | 41.1% | 2.3% | $59k | 15.3% | 25.4% | 20.0% | 88.6% | 8.1% | 0.1% |
| Jefferson Middle School Voting District | 138 | 94 | 26.3% | 1.5% | 71.7% | 0.0% | $52k | 6.8% | 6.1% | 22.4% | 73.9% | 19.0% | 0.0% |
| Little Rock Voting District | 1,028 | 693 | 49.7% | 0.0% | 50.0% | 0.0% | $48k | 14.3% | 19.0% | 11.7% | 81.8% | 11.6% | 0.0% |
| Morgantown Voting District | 1,348 | 1,042 | 73.8% | 1.0% | 18.5% | 0.0% | $47k | 11.3% | 28.8% | 16.3% | 72.5% | 31.9% | 2.0% |
| Morris Voting District | 2,283 | 1,919 | 69.9% | 0.0% | 29.7% | 0.0% | $48k | 14.0% | 14.8% | 20.1% | 77.2% | 14.7% | 0.0% |
| National Guard Voting District | 1,967 | 1,437 | 83.0% | 0.2% | 15.5% | 0.1% | $45k | 21.2% | 12.3% | 28.0% | 76.7% | 12.2% | 0.0% |
| Pine Burr Voting District | 1,312 | 935 | 54.7% | 1.9% | 39.2% | 1.3% | $68k | 7.2% | 13.0% | 13.7% | 94.1% | 10.8% | 1.1% |
| Pittman Voting District | 828 | 682 | 67.5% | 4.2% | 26.7% | 0.0% | $36k | 5.9% | 25.7% | 16.8% | 86.5% | 24.6% | 4.3% |
| Popetown Voting District | 2,774 | 1,901 | 45.8% | 3.1% | 47.9% | 0.0% | $41k | 12.4% | 18.1% | 18.7% | 69.8% | 31.8% | 1.0% |
| Sandy Hook Voting District | 438 | 365 | 82.3% | 2.4% | 15.3% | 0.0% | $43k | 3.6% | 2.0% | 40.3% | 90.6% | 13.9% | 4.6% |
| Union Voting District | 642 | 532 | 80.0% | 0.3% | 13.1% | 1.9% | $57k | 6.1% | 20.9% | 26.1% | 91.7% | 3.4% | 0.0% |
| Voting District 5 South Columbia | 337 | 275 | 63.5% | 0.8% | 32.1% | 0.0% | $45k | 11.5% | 15.5% | 17.1% | 42.1% | 27.4% | 1.9% |
| kokomo Voting District | 1,277 | 1,050 | 60.6% | 0.0% | 37.5% | 0.0% | $39k | 5.2% | 26.9% | 16.1% | 89.6% | 17.7% | 0.0% |
Newton: 16 precincts
| Precinct | Population | Voting-age pop. | % White non-Hisp. | % Hispanic | % Black | % Asian | Median income* | % Bachelor's+ | % 18-29 (of adults) | % 65+ | % Homeowners | % Below poverty | % Spanish at home (adults) |
|---|---|---|---|---|---|---|---|---|---|---|---|---|---|
| Chunky Voting District | 610 | 456 | 73.0% | 0.7% | 25.5% | 0.0% | $54k | 21.3% | 22.3% | 16.7% | 91.8% | 28.8% | 0.3% |
| Conehatta Voting District | 1,987 | 1,348 | 46.1% | 0.3% | 7.0% | 0.6% | $56k | 18.2% | 6.6% | 9.6% | 90.0% | 30.6% | 1.2% |
| Decatur 1 Voting District | 1,493 | 1,208 | 69.7% | 3.2% | 24.4% | 0.5% | $51k | 25.6% | 35.4% | 15.0% | 69.1% | 19.8% | 2.3% |
| Decatur 2 Voting District | 1,039 | 854 | 76.6% | 1.9% | 15.6% | 1.2% | $53k | 33.2% | 42.5% | 13.3% | 75.2% | 16.2% | 1.9% |
| Duffee Voting District | 983 | 739 | 90.1% | 0.0% | 6.8% | 0.7% | $55k | 20.7% | 15.5% | 17.4% | 89.6% | 14.3% | 1.0% |
| Hickory Voting District | 2,006 | 1,502 | 69.6% | 0.8% | 26.4% | 0.1% | $63k | 20.9% | 26.3% | 18.1% | 77.7% | 18.8% | 0.2% |
| Lawrence Voting District | 2,410 | 1,985 | 53.1% | 0.3% | 42.0% | 2.0% | $48k | 11.8% | 18.6% | 16.8% | 87.4% | 26.4% | 0.1% |
| Little Rock Voting District | 1,040 | 814 | 83.0% | 6.1% | 6.7% | 1.0% | $58k | 27.1% | 20.1% | 20.1% | 90.0% | 10.4% | 6.9% |
| Newton 1 Voting District | 1,288 | 1,022 | 25.1% | 1.6% | 72.5% | 0.0% | $35k | 18.6% | 24.3% | 16.3% | 57.8% | 36.8% | 2.2% |
| Newton 4 Voting District | 2,408 | 1,696 | 31.5% | 1.6% | 66.2% | 0.4% | $37k | 15.3% | 26.4% | 15.4% | 59.8% | 42.8% | 0.2% |
| Newton 5 Voting District | 1,189 | 965 | 43.6% | 0.2% | 54.5% | 0.1% | $43k | 24.9% | 9.7% | 31.9% | 82.9% | 20.2% | 0.4% |
| Prospect Voting District | 1,068 | 761 | 89.2% | 0.0% | 4.2% | 0.1% | $62k | 20.1% | 27.9% | 15.6% | 89.7% | 14.8% | 0.1% |
| Scanlan Voting District | 1,107 | 800 | 76.5% | 3.7% | 18.8% | 0.1% | $54k | 24.2% | 19.0% | 18.5% | 83.1% | 19.3% | 0.8% |
| Union 1 Voting District | 541 | 423 | 61.5% | 8.1% | 29.3% | 0.1% | $53k | 14.2% | 22.2% | 21.8% | 80.5% | 18.2% | 7.8% |
| Union 2 Voting District | 1,231 | 952 | 58.1% | 4.0% | 36.7% | 0.1% | $48k | 10.9% | 22.0% | 20.8% | 74.8% | 22.0% | 4.0% |
| Union 3 Voting District | 720 | 511 | 76.2% | 6.1% | 17.1% | 0.0% | $55k | 14.7% | 15.1% | 18.9% | 85.5% | 25.3% | 0.0% |
Covington: 15 precincts
| Precinct | Population | Voting-age pop. | % White non-Hisp. | % Hispanic | % Black | % Asian | Median income* | % Bachelor's+ | % 18-29 (of adults) | % 65+ | % Homeowners | % Below poverty | % Spanish at home (adults) |
|---|---|---|---|---|---|---|---|---|---|---|---|---|---|
| Collins Voting District | 2,753 | 2,238 | 45.9% | 10.1% | 38.4% | 0.4% | $34k | 10.0% | 19.4% | 17.4% | 68.4% | 29.3% | 7.3% |
| Dry Creek Voting District | 603 | 391 | 59.2% | 0.0% | 40.7% | 0.0% | $53k | 34.5% | 8.9% | 8.3% | 97.8% | 1.4% | 0.2% |
| Gilmer/Yawn Voting District | 1,011 | 747 | 51.7% | 1.2% | 44.3% | 0.5% | $63k | 11.7% | 22.0% | 19.1% | 95.9% | 20.0% | 0.1% |
| Lone Star/Black Jack Voting District | 458 | 299 | 49.1% | 0.0% | 50.4% | 0.0% | $58k | 41.0% | 11.3% | 6.8% | 88.1% | 6.1% | 0.0% |
| Mitchell Voting District | 469 | 400 | 84.5% | 2.1% | 11.4% | 1.9% | $50k | 12.9% | 15.9% | 25.3% | 100.0% | 12.4% | 2.5% |
| Mt. Olive Voting District | 2,246 | 1,683 | 42.2% | 0.0% | 55.5% | 0.4% | $56k | 16.3% | 27.2% | 14.8% | 74.1% | 14.7% | 0.6% |
| Okahay Voting District | 1,243 | 1,037 | 15.6% | 0.0% | 83.5% | 0.0% | $39k | 6.6% | 29.2% | 19.0% | 92.0% | 15.3% | 0.0% |
| Richmond Voting District | 1,895 | 1,429 | 96.0% | 0.6% | 1.3% | 0.0% | $78k | 21.8% | 17.3% | 22.4% | 92.9% | 13.0% | 0.9% |
| Rock Hill Voting District | 262 | 202 | 65.3% | 0.0% | 31.9% | 0.0% | $53k | 28.0% | 27.3% | 17.9% | 76.6% | 14.8% | 1.8% |
| Sanford Voting District | 1,288 | 930 | 81.8% | 3.7% | 9.1% | 0.0% | $89k | 12.6% | 18.3% | 19.5% | 76.8% | 23.3% | 4.2% |
| Seminary/West Collins Voting District | 3,207 | 2,329 | 71.7% | 1.8% | 25.1% | 0.0% | $56k | 18.3% | 10.5% | 18.0% | 61.0% | 25.8% | 0.5% |
| South Collins Voting District | 767 | 572 | 67.9% | 4.9% | 9.0% | 0.5% | $42k | 12.4% | 12.1% | 19.1% | 71.9% | 33.6% | 4.4% |
| Station Creek Voting District | 787 | 624 | 56.6% | 1.2% | 40.3% | 1.0% | $47k | 11.4% | 20.4% | 23.1% | 96.5% | 14.5% | 1.4% |
| Strahan Voting District | 630 | 427 | 35.8% | 0.0% | 63.1% | 0.0% | $64k | 49.0% | 17.6% | 5.9% | 74.5% | 15.0% | 0.0% |
| Williamsburg Voting District | 509 | 416 | 63.7% | 0.4% | 34.9% | 0.0% | $51k | 30.6% | 28.6% | 17.9% | 74.6% | 19.1% | 2.4% |
Winston: 12 precincts
| Precinct | Population | Voting-age pop. | % White non-Hisp. | % Hispanic | % Black | % Asian | Median income* | % Bachelor's+ | % 18-29 (of adults) | % 65+ | % Homeowners | % Below poverty | % Spanish at home (adults) |
|---|---|---|---|---|---|---|---|---|---|---|---|---|---|
| American Legion Voting District | 806 | 675 | 37.5% | 0.1% | 60.1% | 0.6% | $39k | 11.7% | 13.7% | 32.0% | 66.2% | 23.3% | 0.0% |
| County Agent Voting District | 1,386 | 1,106 | 45.2% | 0.9% | 50.8% | 0.5% | $36k | 10.9% | 12.0% | 27.2% | 69.7% | 33.1% | 0.0% |
| East Winston Voting District | 1,311 | 946 | 56.7% | 0.0% | 41.7% | 0.0% | $58k | 18.4% | 14.3% | 14.7% | 81.5% | 22.5% | 0.8% |
| Fairground Voting District | 3,765 | 2,699 | 45.7% | 1.2% | 52.2% | 0.1% | $57k | 24.8% | 23.2% | 22.7% | 67.5% | 48.2% | 1.4% |
| Lovorn Tractor Voting District | 682 | 555 | 31.9% | 0.3% | 64.9% | 0.0% | $47k | 12.2% | 14.5% | 23.9% | 71.4% | 22.6% | 0.0% |
| Mars Hill Voting District | 1,005 | 787 | 61.0% | 0.0% | 31.2% | 0.0% | $88k | 20.9% | 11.3% | 15.0% | 77.5% | 9.7% | 0.0% |
| Mill Creek Voting District | 2,386 | 1,774 | 61.5% | 0.9% | 37.0% | 0.0% | $70k | 24.9% | 20.7% | 19.7% | 84.0% | 29.4% | 2.7% |
| Nanih Waiya Voting District | 1,804 | 1,401 | 61.6% | 0.7% | 30.5% | 0.0% | $64k | 31.6% | 12.4% | 15.7% | 75.7% | 9.7% | 0.0% |
| New National Guard Armory Voting District | 1,403 | 1,205 | 37.0% | 0.1% | 59.5% | 0.0% | $44k | 11.4% | 13.1% | 23.7% | 64.8% | 24.6% | 0.0% |
| Noxapater Voting District | 1,516 | 1,283 | 58.4% | 0.0% | 37.3% | 0.0% | $63k | 22.0% | 20.7% | 25.4% | 66.0% | 13.2% | 0.4% |
| Shilioh Voting District | 836 | 684 | 41.5% | 0.3% | 56.9% | 0.0% | $56k | 11.2% | 19.8% | 21.1% | 83.8% | 19.0% | 0.0% |
| Zion Ridge Voting District | 681 | 571 | 18.9% | 0.8% | 76.7% | 0.0% | $40k | 10.4% | 9.6% | 24.4% | 81.8% | 27.4% | 0.0% |
Jasper: 17 precincts
| Precinct | Population | Voting-age pop. | % White non-Hisp. | % Hispanic | % Black | % Asian | Median income* | % Bachelor's+ | % 18-29 (of adults) | % 65+ | % Homeowners | % Below poverty | % Spanish at home (adults) |
|---|---|---|---|---|---|---|---|---|---|---|---|---|---|
| Antioch Voting District | 530 | 427 | 49.3% | 0.0% | 50.6% | 0.0% | $55k | 6.1% | 18.1% | 18.1% | 92.4% | 5.1% | 0.1% |
| Bay Springs Beat 3 Voting District | 1,486 | 1,201 | 39.7% | 0.0% | 58.2% | 1.3% | $56k | 16.4% | 18.1% | 20.7% | 75.3% | 16.0% | 0.0% |
| Bay Springs Beat 4 Voting District | 1,030 | 895 | 47.5% | 0.0% | 31.7% | 0.0% | $53k | 23.2% | 32.6% | 32.1% | 76.1% | 10.5% | 0.0% |
| Claiborne Voting District | 1,101 | 777 | 21.6% | 0.0% | 78.0% | 0.0% | $37k | 9.5% | 13.1% | 12.1% | 85.1% | 31.4% | 0.0% |
| Fellowship Voting District | 382 | 269 | 60.5% | 0.0% | 38.7% | 0.0% | $50k | 14.3% | 26.4% | 11.3% | 63.0% | 14.4% | 1.6% |
| Heidelberg Voting District | 2,380 | 1,592 | 21.5% | 0.1% | 75.3% | 0.5% | $37k | 11.1% | 15.2% | 13.0% | 75.7% | 38.2% | 0.4% |
| Holders Voting District | 1,289 | 1,096 | 40.1% | 0.3% | 59.0% | 0.5% | $46k | 7.3% | 12.0% | 21.7% | 87.5% | 9.3% | 0.0% |
| Louin Voting District | 998 | 794 | 61.8% | 0.0% | 37.9% | 0.0% | $74k | 11.2% | 23.5% | 13.4% | 93.2% | 5.5% | 0.3% |
| Midway Voting District | 411 | 292 | 40.5% | 0.0% | 59.1% | 0.0% | $38k | 5.8% | 23.9% | 15.8% | 80.3% | 11.4% | 0.8% |
| Montrose Voting District | 575 | 411 | 40.2% | 0.0% | 57.7% | 0.5% | $27k | 10.9% | 17.7% | 31.7% | 85.0% | 30.7% | 0.0% |
| Moss Voting District | 1,343 | 1,134 | 57.3% | 0.3% | 42.3% | 0.0% | $53k | 9.4% | 12.4% | 19.2% | 83.8% | 11.7% | 0.0% |
| Palestine Voting District | 203 | 145 | 21.9% | 0.0% | 78.0% | 0.0% | $31k | 0.0% | 21.5% | 19.9% | 91.3% | 8.7% | 0.0% |
| Paulding Voting District | 1,052 | 813 | 33.8% | 6.3% | 58.6% | 0.0% | $35k | 9.5% | 13.0% | 37.9% | 85.6% | 30.1% | 0.4% |
| Philadelphia Voting District | 273 | 209 | 17.8% | 3.1% | 79.0% | 0.0% | $37k | 6.4% | 14.8% | 19.0% | 87.3% | 26.1% | 0.0% |
| Rose Hill Voting District | 1,121 | 919 | 64.9% | 0.0% | 32.6% | 0.0% | $49k | 21.9% | 17.1% | 32.6% | 73.3% | 15.3% | 1.3% |
| Stringer Voting District | 1,403 | 1,088 | 88.7% | 0.9% | 7.5% | 0.0% | $89k | 16.0% | 17.2% | 24.0% | 89.0% | 4.9% | 0.0% |
| Vossburg Voting District | 472 | 311 | 20.1% | 6.0% | 73.5% | 0.0% | $30k | 6.7% | 9.3% | 21.8% | 85.1% | 48.4% | 0.0% |
Clarke: 23 precincts
| Precinct | Population | Voting-age pop. | % White non-Hisp. | % Hispanic | % Black | % Asian | Median income* | % Bachelor's+ | % 18-29 (of adults) | % 65+ | % Homeowners | % Below poverty | % Spanish at home (adults) |
|---|---|---|---|---|---|---|---|---|---|---|---|---|---|
| Beaverdam Voting District | 312 | 232 | 39.0% | 0.0% | 59.9% | 0.0% | $39k | 6.4% | 30.5% | 23.8% | 81.4% | 24.7% | 0.0% |
| Carmichael Voting District | 412 | 294 | 64.1% | 0.6% | 35.4% | 0.0% | $105k | 25.0% | 16.4% | 14.1% | 83.8% | 6.2% | 0.0% |
| Desoto Voting District | 664 | 446 | 58.6% | 0.3% | 36.9% | 0.0% | $74k | 24.9% | 20.8% | 13.8% | 82.1% | 18.5% | 0.0% |
| East Quitman Voting District | 1,201 | 832 | 71.9% | 1.1% | 17.0% | 0.0% | $56k | 19.5% | 11.5% | 22.0% | 85.1% | 11.2% | 0.1% |
| Energy Voting District | 495 | 457 | 91.1% | 2.1% | 5.9% | 0.0% | $50k | 16.8% | 12.9% | 28.8% | 85.3% | 14.7% | 0.5% |
| Enterprise Voting District | 2,559 | 2,043 | 75.8% | 1.1% | 19.6% | 1.0% | $53k | 21.1% | 14.0% | 20.0% | 84.6% | 9.0% | 2.6% |
| Harmony Beat 1 Voting District | 290 | 202 | 37.6% | 0.0% | 56.5% | 0.0% | $41k | 16.6% | 30.7% | 9.7% | 85.0% | 40.7% | 0.0% |
| Harmony Beat 2 Voting District | 522 | 403 | 45.4% | 0.1% | 50.8% | 0.0% | $40k | 16.9% | 18.6% | 28.6% | 80.0% | 20.8% | 0.0% |
| Hopewell Voting District | 373 | 332 | 77.9% | 5.1% | 14.8% | 0.0% | $56k | 13.5% | 7.7% | 25.2% | 83.4% | 18.7% | 1.4% |
| Langsdale Voting District | 172 | 125 | 38.4% | 1.2% | 60.4% | 0.0% | $41k | 38.5% | 10.1% | 13.9% | 70.8% | 0.0% | 0.0% |
| Manassa Voting District | 232 | 187 | 84.8% | 0.5% | 14.4% | 0.0% | $116k | 9.7% | 12.5% | 17.0% | 95.5% | 12.6% | 0.2% |
| North Quitman Voting District | 754 | 619 | 57.1% | 2.9% | 27.3% | 0.0% | $45k | 14.9% | 12.6% | 26.6% | 74.8% | 24.4% | 0.8% |
| Oak Grove Voting District | 655 | 456 | 37.2% | 0.0% | 56.9% | 0.0% | 16.8% | 31.1% | 9.3% | 85.2% | 41.4% | 0.0% | |
| Pachuta Voting District | 388 | 309 | 48.1% | 0.1% | 48.5% | 0.0% | $40k | 16.7% | 15.7% | 33.4% | 79.0% | 14.9% | 0.0% |
| Pierce's Springs Voting District | 276 | 229 | 83.4% | 0.3% | 16.1% | 0.0% | $126k | 9.0% | 9.8% | 17.1% | 95.5% | 12.0% | 0.1% |
| Rolling Creek Voting District | 273 | 230 | 78.4% | 2.0% | 17.6% | 0.0% | $52k | 17.2% | 12.1% | 31.5% | 90.7% | 13.5% | 0.5% |
| Shubuta Voting District | 1,084 | 822 | 24.6% | 0.3% | 73.7% | 0.0% | $40k | 9.7% | 26.1% | 20.0% | 83.2% | 16.1% | 0.1% |
| Snell Voting District | 304 | 276 | 85.3% | 3.4% | 9.7% | 0.0% | $52k | 15.4% | 10.7% | 27.3% | 84.2% | 16.5% | 0.9% |
| Souinlovie Voting District | 355 | 295 | 63.4% | 1.1% | 30.7% | 0.0% | $43k | 6.1% | 21.0% | 16.3% | 83.3% | 7.0% | 0.0% |
| South Quitman Voting District | 1,840 | 1,451 | 50.2% | 1.0% | 36.4% | 0.0% | $34k | 17.5% | 23.0% | 22.9% | 66.9% | 30.9% | 0.6% |
| Stonewall Beat 1 Voting District | 751 | 631 | 64.5% | 0.9% | 30.5% | 0.0% | $47k | 18.6% | 13.7% | 29.3% | 84.6% | 14.2% | 1.0% |
| Stonewall Beat 3 Voting District | 634 | 486 | 75.3% | 1.5% | 20.0% | 0.0% | $36k | 22.2% | 13.2% | 27.8% | 82.5% | 15.2% | 2.1% |
| Union Voting District | 782 | 630 | 95.6% | 1.0% | 3.0% | 0.0% | $45k | 18.2% | 15.8% | 30.6% | 93.9% | 10.0% | 0.3% |
Smith: 18 precincts
| Precinct | Population | Voting-age pop. | % White non-Hisp. | % Hispanic | % Black | % Asian | Median income* | % Bachelor's+ | % 18-29 (of adults) | % 65+ | % Homeowners | % Below poverty | % Spanish at home (adults) |
|---|---|---|---|---|---|---|---|---|---|---|---|---|---|
| Ag Complex Voting District | 1,077 | 852 | 86.1% | 0.8% | 9.4% | 1.2% | $78k | 10.5% | 14.0% | 21.2% | 85.8% | 21.4% | 0.5% |
| Burns Voting District | 191 | 151 | 86.9% | 0.0% | 13.1% | 0.0% | $57k | 12.8% | 20.1% | 27.9% | 93.6% | 20.3% | 0.0% |
| Cedar Grove Voting District | 376 | 278 | 43.7% | 3.0% | 53.4% | 0.0% | $63k | 17.0% | 20.0% | 12.9% | 84.8% | 10.9% | 5.0% |
| Center Ridge Voting District | 486 | 399 | 86.5% | 2.3% | 10.5% | 0.3% | $71k | 16.9% | 8.8% | 23.9% | 93.9% | 14.6% | 15.4% |
| Clear Springs-Pineville Voting District | 646 | 570 | 67.5% | 0.9% | 22.1% | 0.0% | $40k | 18.3% | 11.0% | 46.2% | 90.9% | 14.5% | 4.4% |
| Lorena-Spinola Voting District | 408 | 374 | 77.8% | 0.2% | 10.9% | 0.0% | $37k | 18.0% | 9.8% | 54.5% | 92.5% | 16.4% | 3.8% |
| Mize Voting District | 1,245 | 809 | 94.5% | 0.2% | 3.3% | 0.2% | $77k | 9.9% | 3.7% | 21.5% | 93.7% | 9.0% | 0.2% |
| New Haven Voting District | 1,478 | 970 | 79.6% | 5.1% | 15.1% | 0.0% | $62k | 23.5% | 13.6% | 8.8% | 84.6% | 20.2% | 0.0% |
| North Raleigh Voting District | 948 | 728 | 54.5% | 2.6% | 41.8% | 0.1% | $64k | 16.4% | 19.1% | 16.9% | 85.3% | 12.2% | 3.5% |
| Polkville Voting District | 845 | 638 | 89.5% | 0.0% | 7.7% | 0.0% | $39k | 10.2% | 13.5% | 25.6% | 90.0% | 24.2% | 0.2% |
| Shady Grove Voting District | 808 | 604 | 78.9% | 0.0% | 20.3% | 0.3% | $61k | 27.4% | 12.8% | 13.6% | 82.1% | 24.9% | 0.0% |
| Summerland Voting District | 826 | 711 | 32.4% | 0.6% | 66.9% | 0.1% | $60k | 8.4% | 7.9% | 24.1% | 96.4% | 12.0% | 2.1% |
| Sylvarena Voting District | 425 | 345 | 79.0% | 1.0% | 19.5% | 0.0% | $87k | 18.9% | 26.2% | 13.5% | 82.7% | 9.6% | 3.3% |
| Taylorsville Voting District | 1,821 | 1,422 | 60.6% | 2.8% | 35.8% | 0.9% | $43k | 12.5% | 33.6% | 14.9% | 74.4% | 19.8% | 0.1% |
| Union-New Home Voting District | 750 | 627 | 82.6% | 2.2% | 14.9% | 0.0% | $76k | 20.1% | 14.3% | 21.1% | 93.6% | 10.3% | 14.1% |
| Warren Hill Voting District | 605 | 452 | 45.2% | 2.8% | 51.4% | 0.0% | $61k | 17.1% | 19.4% | 15.0% | 85.4% | 11.1% | 5.0% |
| West Raleigh Voting District | 582 | 500 | 86.7% | 1.2% | 8.3% | 0.8% | $65k | 18.4% | 19.3% | 29.0% | 89.1% | 23.5% | 0.0% |
| White Oak Voting District | 600 | 461 | 90.1% | 0.0% | 7.0% | 0.1% | $39k | 11.4% | 14.6% | 26.3% | 90.4% | 25.6% | 0.2% |
Walthall: 23 precincts
| Precinct | Population | Voting-age pop. | % White non-Hisp. | % Hispanic | % Black | % Asian | Median income* | % Bachelor's+ | % 18-29 (of adults) | % 65+ | % Homeowners | % Below poverty | % Spanish at home (adults) |
|---|---|---|---|---|---|---|---|---|---|---|---|---|---|
| Darbun Voting District | 374 | 262 | 34.1% | 0.0% | 58.1% | 0.0% | $60k | 9.1% | 28.1% | 13.4% | 80.1% | 22.3% | 1.0% |
| Dexter Voting District | 1,178 | 993 | 71.6% | 0.1% | 26.5% | 0.0% | $51k | 8.8% | 9.6% | 29.6% | 94.5% | 7.1% | 0.0% |
| Dinan Voting District | 1,105 | 836 | 43.9% | 2.6% | 53.2% | 0.0% | $46k | 16.8% | 14.9% | 15.2% | 92.1% | 25.5% | 2.0% |
| Dist.3 Tylertown | 568 | 449 | 38.5% | 3.3% | 55.0% | 0.7% | $43k | 13.7% | 17.8% | 18.5% | 64.3% | 27.9% | 1.3% |
| Dist.4 Tylertown | 921 | 645 | 69.7% | 6.3% | 22.1% | 0.5% | $94k | 20.9% | 17.0% | 13.4% | 82.9% | 9.2% | 5.8% |
| Dist.4 West | 893 | 661 | 43.2% | 1.2% | 54.5% | 0.0% | $58k | 12.9% | 23.9% | 24.8% | 80.1% | 11.0% | 3.0% |
| East Tylertown Sub A Voting District | 86 | 69 | 70.8% | 2.5% | 23.0% | 3.0% | $79k | 33.8% | 19.7% | 22.8% | 83.4% | 16.5% | 3.1% |
| East Tylertown Voting District | 92 | 72 | 69.9% | 2.2% | 23.1% | 2.7% | $79k | 31.9% | 19.6% | 22.6% | 82.2% | 17.9% | 2.8% |
| Enon Voting District | 389 | 289 | 44.1% | 1.0% | 54.0% | 0.0% | $56k | 14.4% | 21.6% | 23.7% | 82.3% | 14.3% | 2.5% |
| Hope Voting District | 422 | 309 | 41.0% | 0.9% | 55.5% | 0.0% | $58k | 12.3% | 24.5% | 22.0% | 80.6% | 14.2% | 2.5% |
| Improve Voting District | 759 | 643 | 89.3% | 0.3% | 8.6% | 0.0% | $50k | 9.4% | 12.8% | 42.3% | 91.4% | 8.8% | 0.0% |
| Lexie Voting District | 1,118 | 909 | 54.6% | 1.9% | 39.7% | 0.0% | $26k | 12.0% | 17.2% | 23.6% | 75.2% | 32.0% | 0.5% |
| Mesa Voting District | 86 | 68 | 26.5% | 2.6% | 70.8% | 0.0% | $29k | 12.1% | 18.7% | 14.7% | 94.7% | 30.3% | 1.7% |
| Midway Voting District | 300 | 242 | 83.4% | 0.0% | 14.1% | 0.0% | $17k | 17.3% | 15.9% | 22.7% | 77.4% | 48.9% | 0.0% |
| North Kirklin Voting District | 641 | 566 | 57.0% | 0.0% | 34.6% | 0.0% | $41k | 9.1% | 15.6% | 36.1% | 73.3% | 4.7% | 0.0% |
| North Knoxo Voting District | 903 | 704 | 39.4% | 0.0% | 56.4% | 0.0% | $50k | 7.9% | 14.2% | 19.6% | 70.9% | 25.0% | 0.0% |
| Saint Paul Voting District | 188 | 149 | 24.8% | 2.4% | 72.8% | 0.0% | $28k | 11.8% | 18.8% | 14.9% | 95.0% | 31.2% | 1.5% |
| Sartinville Voting District | 598 | 425 | 35.5% | 0.3% | 58.1% | 0.0% | $60k | 9.8% | 27.6% | 16.1% | 80.0% | 19.2% | 1.6% |
| South Kirklin Voting District | 576 | 507 | 57.2% | 0.0% | 34.9% | 0.0% | $42k | 9.0% | 14.9% | 34.9% | 75.6% | 4.8% | 0.0% |
| South Knoxo Voting District | 166 | 137 | 12.3% | 0.0% | 87.5% | 0.0% | $51k | 6.4% | 14.2% | 12.8% | 59.4% | 30.3% | 0.0% |
| Varnell Voting District | 1,188 | 817 | 54.3% | 3.4% | 37.4% | 0.0% | $79k | 14.6% | 20.4% | 13.3% | 81.6% | 16.5% | 3.5% |
| West Tylertown Sub A Voting District | 168 | 134 | 71.0% | 2.4% | 22.8% | 3.0% | $79k | 33.9% | 19.7% | 22.8% | 83.6% | 16.4% | 3.1% |
| West Tylertown Voting District | 1,075 | 800 | 43.8% | 6.1% | 47.0% | 0.6% | $44k | 14.7% | 19.7% | 16.0% | 62.2% | 30.1% | 2.6% |
Lawrence: 24 precincts
| Precinct | Population | Voting-age pop. | % White non-Hisp. | % Hispanic | % Black | % Asian | Median income* | % Bachelor's+ | % 18-29 (of adults) | % 65+ | % Homeowners | % Below poverty | % Spanish at home (adults) |
|---|---|---|---|---|---|---|---|---|---|---|---|---|---|
| Arm Voting District | 570 | 465 | 50.0% | 1.7% | 46.5% | 0.0% | $47k | 6.1% | 13.7% | 22.4% | 94.4% | 19.0% | 2.8% |
| Center Voting District | 192 | 149 | 54.0% | 6.9% | 28.9% | 0.8% | $49k | 8.1% | 11.1% | 23.6% | 89.5% | 38.5% | 5.8% |
| Cooper's Creek Voting District | 901 | 644 | 86.9% | 3.0% | 5.9% | 1.3% | $46k | 11.3% | 20.8% | 14.6% | 83.2% | 38.9% | 1.3% |
| Courthouse Voting District | 2,258 | 1,779 | 56.6% | 3.2% | 35.5% | 0.3% | $61k | 12.5% | 16.9% | 19.7% | 79.2% | 26.5% | 2.6% |
| Grange Voting District | 413 | 293 | 59.4% | 1.0% | 37.9% | 0.0% | $51k | 16.1% | 13.3% | 21.7% | 85.5% | 24.2% | 0.0% |
| Hooker Voting District | 456 | 328 | 44.5% | 3.0% | 51.5% | 0.0% | $35k | 7.0% | 15.3% | 13.1% | 86.3% | 25.8% | 4.8% |
| Jayess Voting District | 833 | 648 | 93.1% | 2.4% | 4.5% | 0.0% | $62k | 12.1% | 12.6% | 18.3% | 93.2% | 7.6% | 1.1% |
| Monticello Beat 5 Voting District | 118 | 94 | 49.8% | 0.6% | 48.0% | 0.0% | $53k | 11.9% | 19.7% | 20.0% | 59.9% | 24.9% | 0.0% |
| National Guard Armory Voting District | 219 | 162 | 33.0% | 0.1% | 66.6% | 0.1% | $27k | 11.4% | 23.4% | 20.3% | 54.8% | 26.4% | 0.1% |
| New Hebron Voting District | 499 | 379 | 47.0% | 0.8% | 51.4% | 0.0% | $44k | 20.5% | 15.1% | 23.8% | 88.3% | 28.7% | 0.0% |
| Nola 91 Voting District | 82 | 56 | 48.9% | 0.0% | 50.3% | 0.3% | $41k | 25.1% | 30.7% | 19.2% | 71.5% | 10.8% | 0.0% |
| Nola Voting District | 179 | 122 | 48.9% | 0.0% | 50.2% | 0.3% | $41k | 25.1% | 30.7% | 19.2% | 71.5% | 10.8% | 0.0% |
| Oakvale Voting District | 159 | 136 | 64.6% | 0.0% | 32.5% | 0.0% | $61k | 6.9% | 11.6% | 31.6% | 96.4% | 11.9% | 0.0% |
| Oma Voting District | 230 | 205 | 55.5% | 2.0% | 36.1% | 0.0% | $26k | 8.3% | 2.9% | 35.0% | 84.0% | 26.9% | 0.0% |
| Peyton Town Voting District | 117 | 91 | 50.1% | 6.4% | 34.0% | 0.7% | $46k | 7.6% | 11.8% | 23.2% | 85.9% | 38.9% | 5.5% |
| Silver Creek Voting District | 511 | 375 | 37.8% | 3.6% | 58.1% | 0.0% | $30k | 6.0% | 16.1% | 11.1% | 89.0% | 27.3% | 6.1% |
| Sontag Voting District | 539 | 428 | 52.4% | 1.1% | 42.7% | 0.1% | $30k | 14.7% | 14.0% | 27.7% | 80.1% | 19.4% | 0.0% |
| Stringer Voting District | 842 | 601 | 58.3% | 1.0% | 39.1% | 0.0% | $50k | 16.5% | 13.4% | 21.9% | 85.7% | 24.6% | 0.0% |
| Tilton Voting District | 762 | 529 | 93.6% | 2.1% | 1.0% | 1.6% | $43k | 12.1% | 24.1% | 12.2% | 80.1% | 42.1% | 0.2% |
| Topeka Voting District | 742 | 577 | 91.9% | 2.5% | 5.3% | 0.0% | $62k | 11.9% | 12.5% | 18.5% | 93.1% | 8.6% | 1.2% |
| Wanilla 91 Voting District | 95 | 65 | 48.8% | 0.0% | 50.3% | 0.3% | $41k | 25.1% | 30.7% | 19.2% | 71.5% | 10.8% | 0.0% |
| Wanilla Voting District | 122 | 101 | 53.6% | 1.4% | 40.4% | 0.1% | $29k | 12.4% | 10.1% | 30.0% | 81.6% | 21.8% | 0.0% |
| West District 1 Voting District | 38 | 29 | 52.6% | 7.0% | 29.7% | 0.8% | $49k | 8.0% | 11.0% | 23.8% | 89.4% | 39.5% | 6.0% |
| West Monticello Voting District | 902 | 652 | 57.8% | 0.4% | 40.1% | 0.2% | $60k | 23.6% | 26.8% | 19.0% | 74.6% | 11.5% | 0.0% |
Jefferson Davis: 16 precincts
| Precinct | Population | Voting-age pop. | % White non-Hisp. | % Hispanic | % Black | % Asian | Median income* | % Bachelor's+ | % 18-29 (of adults) | % 65+ | % Homeowners | % Below poverty | % Spanish at home (adults) |
|---|---|---|---|---|---|---|---|---|---|---|---|---|---|
| Bassfield Beat 2 Voting District | 387 | 293 | 49.2% | 1.5% | 46.6% | 0.0% | $39k | 18.8% | 13.9% | 30.3% | 87.6% | 39.4% | 1.4% |
| Bassfield Hwy 42 Voting District | 1,565 | 1,181 | 42.9% | 1.2% | 55.2% | 0.0% | $42k | 18.0% | 13.5% | 27.6% | 90.4% | 38.4% | 0.6% |
| Carson Voting District | 278 | 218 | 62.8% | 1.9% | 27.9% | 0.0% | $33k | 14.4% | 14.4% | 30.3% | 84.2% | 31.8% | 3.4% |
| Clem Voting District | 428 | 307 | 36.5% | 0.0% | 63.5% | 0.0% | $41k | 3.8% | 17.3% | 11.1% | 80.1% | 27.3% | 0.0% |
| Good Hope Melba Voting District | 583 | 475 | 61.8% | 0.1% | 37.5% | 0.0% | $55k | 6.5% | 5.2% | 28.6% | 89.9% | 34.0% | 0.0% |
| Granby Voting District | 454 | 382 | 35.2% | 0.0% | 57.0% | 0.0% | $32k | 21.9% | 22.7% | 28.5% | 79.9% | 27.9% | 6.6% |
| Green's Creek Voting District | 252 | 187 | 81.0% | 3.2% | 9.5% | 0.0% | $33k | 7.0% | 7.6% | 30.9% | 87.7% | 32.9% | 0.0% |
| Gwinville Hebron Voting District | 622 | 535 | 25.5% | 0.0% | 74.5% | 0.0% | $53k | 19.7% | 11.2% | 33.1% | 91.3% | 12.1% | 0.0% |
| Mt. Caramel Voting District | 504 | 397 | 21.7% | 0.0% | 77.6% | 0.0% | $41k | 6.0% | 22.2% | 22.5% | 89.9% | 13.6% | 0.0% |
| Northeast Prentiss Voting District | 1,125 | 892 | 24.3% | 0.6% | 74.1% | 0.0% | $34k | 8.7% | 20.3% | 17.4% | 91.9% | 14.7% | 1.3% |
| Northwest Prentiss Voting District | 770 | 652 | 36.4% | 1.3% | 59.2% | 0.2% | $31k | 10.9% | 13.3% | 21.1% | 75.6% | 19.5% | 0.7% |
| Red House Voting District | 372 | 316 | 24.0% | 0.0% | 75.9% | 0.0% | $51k | 16.4% | 12.6% | 30.5% | 91.5% | 11.5% | 0.0% |
| Sons Academy Hawthorn Voting District | 776 | 614 | 40.4% | 1.1% | 56.2% | 0.0% | $39k | 5.5% | 7.9% | 27.5% | 85.9% | 29.3% | 0.0% |
| South Prentiss Voting District | 2,245 | 1,868 | 37.3% | 0.7% | 58.9% | 0.1% | $40k | 14.2% | 24.9% | 22.8% | 71.5% | 42.5% | 1.5% |
| Whiting Voting District | 394 | 342 | 23.2% | 0.0% | 76.8% | 0.0% | $48k | 16.8% | 8.8% | 31.6% | 92.8% | 9.2% | 0.0% |
| Williamsoms Mill Voting District | 394 | 280 | 37.5% | 0.0% | 62.5% | 0.0% | $41k | 3.6% | 17.0% | 10.4% | 79.2% | 28.2% | 0.0% |
Noxubee: 8 precincts
| Precinct | Population | Voting-age pop. | % White non-Hisp. | % Hispanic | % Black | % Asian | Median income* | % Bachelor's+ | % 18-29 (of adults) | % 65+ | % Homeowners | % Below poverty | % Spanish at home (adults) |
|---|---|---|---|---|---|---|---|---|---|---|---|---|---|
| Brooksville Voting District | 1,953 | 1,662 | 40.3% | 0.7% | 57.9% | 0.0% | $43k | 7.6% | 18.0% | 19.6% | 69.0% | 22.4% | 0.9% |
| Central District 3 | 2,759 | 2,014 | 14.8% | 0.4% | 84.4% | 0.1% | $33k | 13.0% | 20.3% | 14.6% | 71.1% | 29.0% | 0.9% |
| Cliftonville Voting District | 437 | 421 | 11.5% | 0.0% | 88.5% | 0.0% | 2.7% | 11.9% | 39.8% | 45.5% | 45.8% | 11.9% | |
| Earl Nash Gym Voting District | 2,199 | 1,438 | 18.5% | 0.1% | 81.0% | 0.0% | $37k | 11.3% | 26.2% | 12.7% | 76.8% | 31.6% | 0.7% |
| Mashulaville Voting District | 441 | 380 | 54.3% | 0.0% | 43.8% | 0.0% | $74k | 23.5% | 9.2% | 37.0% | 92.2% | 7.8% | 0.0% |
| Prairie Point Voting District | 1,105 | 861 | 31.7% | 0.0% | 68.1% | 0.0% | $59k | 5.2% | 27.6% | 20.6% | 71.4% | 22.9% | 3.1% |
| Shuqualak Voting District | 915 | 546 | 21.3% | 1.4% | 76.5% | 0.5% | $48k | 10.3% | 18.7% | 12.4% | 81.7% | 22.3% | 2.7% |
| Sommerville Voting District | 208 | 180 | 55.0% | 0.0% | 43.1% | 0.0% | $75k | 23.7% | 9.0% | 37.5% | 92.7% | 7.0% | 0.0% |
Jones: 4 precincts
| Precinct | Population | Voting-age pop. | % White non-Hisp. | % Hispanic | % Black | % Asian | Median income* | % Bachelor's+ | % 18-29 (of adults) | % 65+ | % Homeowners | % Below poverty | % Spanish at home (adults) |
|---|---|---|---|---|---|---|---|---|---|---|---|---|---|
| Matthews Voting District | 687 | 540 | 79.8% | 0.0% | 15.2% | 0.1% | $83k | 26.3% | 14.9% | 32.0% | 93.0% | 8.1% | 0.4% |
| Sandersville Civic Center Voting District | 1,277 | 979 | 75.8% | 1.1% | 10.8% | 1.1% | $48k | 12.1% | 12.5% | 23.6% | 92.4% | 23.5% | 0.0% |
| Shady Grove Voting District | 4,045 | 3,147 | 60.3% | 6.0% | 31.5% | 0.8% | $64k | 27.2% | 17.0% | 21.4% | 64.6% | 13.5% | 5.4% |
| Sharon Voting District | 3,961 | 3,304 | 61.0% | 0.9% | 33.8% | 0.9% | $61k | 11.3% | 29.2% | 13.7% | 59.2% | 22.3% | 0.2% |
Kemper: 13 precincts
| Precinct | Population | Voting-age pop. | % White non-Hisp. | % Hispanic | % Black | % Asian | Median income* | % Bachelor's+ | % 18-29 (of adults) | % 65+ | % Homeowners | % Below poverty | % Spanish at home (adults) |
|---|---|---|---|---|---|---|---|---|---|---|---|---|---|
| Band Building Voting District | 878 | 641 | 18.4% | 1.8% | 76.7% | 0.0% | $45k | 14.5% | 20.5% | 18.5% | 68.3% | 35.3% | 1.8% |
| City Hall And Fire Dpt. Voting District | 1,224 | 1,029 | 43.5% | 1.7% | 50.4% | 0.0% | $47k | 22.9% | 46.0% | 14.5% | 64.4% | 23.3% | 2.0% |
| Courthouse Voting District | 1,696 | 1,200 | 17.8% | 1.0% | 80.7% | 0.0% | $47k | 18.0% | 24.3% | 14.9% | 56.2% | 44.3% | 2.6% |
| Farmers Market Voting District | 513 | 410 | 25.4% | 1.5% | 71.6% | 0.0% | $46k | 24.9% | 26.7% | 18.7% | 69.2% | 34.6% | 3.1% |
| Ft. Stevens Voting District | 314 | 253 | 40.4% | 0.4% | 49.2% | 0.0% | $59k | 9.5% | 5.9% | 29.2% | 89.4% | 8.9% | 0.0% |
| Kellis Store Voting District | 293 | 287 | 33.5% | 2.3% | 64.3% | 0.0% | 37.6% | 0.0% | 39.0% | 97.3% | 16.2% | 4.9% | |
| Kemper Springs Voting District | 242 | 213 | 17.0% | 4.2% | 66.6% | 0.0% | $76k | 8.0% | 7.2% | 35.9% | 96.5% | 7.3% | 0.0% |
| Lynville Voting District | 818 | 741 | 43.3% | 0.5% | 43.7% | 0.0% | $74k | 25.7% | 18.4% | 20.6% | 85.9% | 20.9% | 1.3% |
| Lynwood Voting District | 407 | 285 | 34.2% | 0.0% | 56.8% | 0.0% | $50k | 8.1% | 1.9% | 24.2% | 92.3% | 8.2% | 0.0% |
| Mt. Nebo Fire Station Voting District | 435 | 409 | 35.4% | 2.0% | 51.9% | 0.0% | $65k | 10.6% | 8.5% | 39.2% | 92.1% | 9.9% | 0.0% |
| Porterville Voting District | 572 | 427 | 48.7% | 2.1% | 43.2% | 0.0% | 15.2% | 11.2% | 24.5% | 84.3% | 14.1% | 0.0% | |
| Preston Voting District | 686 | 609 | 45.5% | 0.2% | 39.0% | 0.0% | $74k | 21.9% | 23.1% | 16.4% | 82.0% | 21.8% | 0.4% |
| Satellite Voting District | 651 | 613 | 42.9% | 0.1% | 48.8% | 0.0% | $68k | 16.4% | 11.7% | 39.0% | 93.8% | 18.2% | 0.0% |
*Median income is approximate (see note above). ACS 2020-2024 5-year.
Nonpartisan voter information. GOTV Polling does not endorse any candidate.