
Mississippi's 4th Congressional District
U.S. House · Mississippi · District 4 · General election: Tuesday, November 3, 2026
Candidates on the November 3 ballot
- Carl BoyantonIndependent
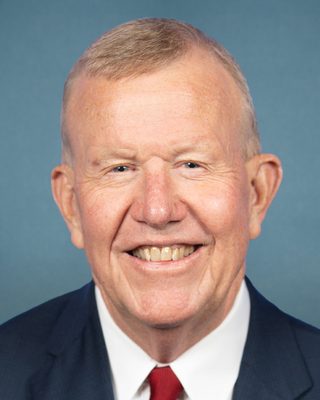 Mike EzellRepublicanPhoto: U.S. Congress
- Jeffrey Hulum IIIDemocratic
Source: Mississippi Secretary of State, Candidate Qualifying List, November 3, 2026 General Election, certified list (list retrieved 2026-10-30; retrieved 2026-10-30). Order of names does not reflect ballot order. Incumbent tags appear only where the official list marks incumbents. Photos come from the Candidate Alerts database where one is on file; otherwise initials are shown.
Federal campaign finance filings for this seat: FEC election page (FEC registration is not the same as ballot qualification).
Certified candidates
- Mike Ezell RepublicanIncumbent @RepEzell
- Jeffrey Hulum III Democratic
Certified candidate list from Candidate Alerts, as of 2026-09-24, based on Mississippi Secretary of State. Includes candidates the database marks as on the November 3 ballot. Incumbent tags here follow the database.
Past election results
Demographics
2020 Census demographics by district are not yet published in this data set.
0 of 345 precincts are above 50%, and 1 are above 25%. Source: Census American Community Survey 2020-2024 5-year block groups, allocated to current precinct shapes by area.
Poll status
Map
Share of adults (18+) who speak Spanish at home, by precinct. Census ACS 2020-2024 5-year estimates on the current precinct layer. Hover a precinct for its value.
District shown in red: U.S. Census Bureau cartographic boundary file for the 119th Congress (cb_2024_us_cd119_500k). These are the lines in effect for 2026 in this state per the Candidate Alerts district registry.
Precinct map: past elections and demographics
Choose a layer above. Hover a precinct for its values.
Precinct results
Precinct demographics
Demographics are Census American Community Survey (ACS) 2020-2024 5-year estimates for block groups, assigned to precincts by area share. They describe the resident population, not registered or likely voters, and include non-citizens. ACS margins of error are not shown; small precincts carry large error. Area weighting assumes people are spread evenly within each block group, so large rural precincts are the least reliable. Median income is a household-weighted average of block-group medians, an approximation.
| Area | Population | Voting-age pop. | % White non-Hisp. | % Hispanic | % Black | % Asian | Median income* | % Bachelor's+ | % 18-29 (of adults) | % 65+ | % Homeowners | % Below poverty | % Spanish at home (adults) |
|---|---|---|---|---|---|---|---|---|---|---|---|---|---|
| District | 747,536 | 573,713 | 66.6% | 5.6% | 21.6% | 1.4% | $66k | 25.4% | 20.3% | 17.0% | 70.2% | 16.7% | 3.1% |
| Harrison (in district) | 210,155 | 160,525 | 60.8% | 6.9% | 23.3% | 2.5% | $65k | 27.4% | 20.1% | 16.6% | 62.2% | 17.1% | 3.9% |
| Jackson (in district) | 144,590 | 111,585 | 66.1% | 7.6% | 18.8% | 2.1% | $74k | 26.7% | 18.1% | 17.3% | 72.8% | 13.8% | 4.4% |
| Forrest (in district) | 77,941 | 60,206 | 55.8% | 4.4% | 35.5% | 0.9% | $58k | 30.5% | 31.0% | 13.7% | 57.2% | 20.9% | 2.2% |
| Lamar (in district) | 65,959 | 49,911 | 70.5% | 3.7% | 21.8% | 0.9% | $79k | 34.5% | 19.5% | 15.3% | 69.5% | 14.7% | 2.3% |
| Pearl River (in district) | 57,306 | 44,193 | 79.1% | 4.3% | 12.0% | 0.3% | $61k | 17.0% | 18.6% | 19.6% | 80.4% | 16.5% | 2.2% |
| Jones (in district) | 56,431 | 41,756 | 62.7% | 6.9% | 28.2% | 0.3% | $60k | 20.9% | 19.6% | 17.5% | 76.7% | 18.9% | 4.1% |
| Hancock (in district) | 46,274 | 37,371 | 83.4% | 4.2% | 7.2% | 1.0% | $69k | 26.7% | 15.3% | 22.5% | 79.2% | 13.8% | 1.9% |
| George (in district) | 25,191 | 18,486 | 85.0% | 3.1% | 7.2% | 0.1% | $61k | 17.5% | 20.6% | 14.9% | 82.1% | 18.3% | 1.2% |
| Wayne (in district) | 19,706 | 14,793 | 56.5% | 2.2% | 37.9% | 0.6% | $41k | 16.0% | 19.0% | 18.0% | 85.3% | 22.8% | 1.9% |
| Stone (in district) | 18,893 | 14,886 | 75.2% | 2.6% | 17.1% | 0.5% | $67k | 17.2% | 22.3% | 17.4% | 80.7% | 16.9% | 0.8% |
| Greene (in district) | 13,619 | 11,045 | 70.9% | 1.5% | 23.8% | 0.0% | $61k | 10.5% | 17.2% | 15.1% | 82.2% | 18.3% | 0.9% |
| Perry (in district) | 11,471 | 8,958 | 77.3% | 1.9% | 15.4% | 2.1% | $53k | 13.0% | 17.1% | 19.5% | 81.5% | 18.4% | 0.7% |
Harrison: 53 precincts
| Precinct | Population | Voting-age pop. | % White non-Hisp. | % Hispanic | % Black | % Asian | Median income* | % Bachelor's+ | % 18-29 (of adults) | % 65+ | % Homeowners | % Below poverty | % Spanish at home (adults) |
|---|---|---|---|---|---|---|---|---|---|---|---|---|---|
| Advance Voting District | 2,298 | 1,776 | 88.6% | 2.8% | 5.4% | 0.0% | $74k | 20.9% | 24.6% | 10.4% | 90.8% | 14.3% | 0.4% |
| Bay Central Voting District | 5,901 | 4,633 | 59.6% | 10.8% | 18.2% | 6.8% | $70k | 37.6% | 29.0% | 13.6% | 37.2% | 13.4% | 5.0% |
| Bayou View Voting District | 3,703 | 2,693 | 83.0% | 3.6% | 8.1% | 2.3% | $90k | 43.5% | 19.9% | 15.6% | 78.0% | 9.1% | 0.5% |
| Biloxi #10 Voting District | 4,723 | 3,662 | 62.6% | 12.1% | 16.7% | 4.6% | $61k | 26.4% | 15.2% | 20.1% | 38.8% | 19.2% | 3.7% |
| Biloxi #11 Voting District | 7,160 | 5,696 | 62.5% | 9.6% | 18.0% | 2.4% | $69k | 40.1% | 14.5% | 20.1% | 47.5% | 13.5% | 6.3% |
| Biloxi #8 Voting District | 1,835 | 1,536 | 66.0% | 4.5% | 17.3% | 1.7% | $61k | 32.0% | 24.6% | 20.6% | 55.4% | 11.5% | 2.0% |
| Biloxi Bay Voting District | 4,970 | 3,419 | 55.9% | 12.9% | 15.2% | 1.7% | $53k | 24.1% | 28.0% | 11.9% | 28.8% | 18.7% | 7.4% |
| Biloxi Central Voting District | 5,597 | 4,700 | 57.8% | 17.7% | 14.9% | 2.7% | $54k | 31.7% | 48.3% | 10.9% | 48.0% | 19.7% | 11.6% |
| County Farm/Gulfhaven Voting District | 4,471 | 3,858 | 80.7% | 2.8% | 11.9% | 0.7% | $70k | 19.9% | 11.0% | 27.7% | 85.2% | 8.8% | 0.8% |
| Delisle Voting District | 3,348 | 2,534 | 56.8% | 14.0% | 23.3% | 2.4% | $73k | 30.2% | 17.7% | 16.4% | 93.2% | 9.2% | 4.9% |
| East Biloxi Voting District | 3,635 | 2,757 | 26.0% | 23.1% | 35.3% | 9.7% | $32k | 12.4% | 17.7% | 19.2% | 50.6% | 39.2% | 19.0% |
| East Handsboro Voting District | 3,021 | 2,513 | 57.6% | 11.0% | 24.0% | 1.0% | $47k | 24.9% | 33.6% | 17.3% | 48.1% | 27.4% | 2.8% |
| East Long Beach Voting District | 4,918 | 3,779 | 75.3% | 3.2% | 16.9% | 1.0% | $53k | 26.9% | 15.5% | 21.1% | 72.5% | 12.8% | 1.4% |
| East Mississippi City Voting District | 5,828 | 4,923 | 55.1% | 5.7% | 27.1% | 4.1% | $58k | 32.6% | 23.1% | 21.4% | 51.2% | 20.5% | 4.7% |
| East North Gulfport Voting District | 1,010 | 607 | 6.5% | 1.0% | 92.5% | 0.0% | $37k | 21.7% | 7.8% | 15.7% | 52.8% | 29.7% | 1.7% |
| East Orange Grove Voting District | 6,034 | 4,420 | 50.6% | 6.9% | 27.4% | 2.0% | $57k | 19.8% | 19.8% | 16.9% | 61.8% | 19.1% | 3.7% |
| East Pass Christian Voting District | 3,350 | 2,579 | 74.6% | 2.3% | 17.6% | 2.9% | $80k | 47.7% | 16.6% | 23.9% | 73.8% | 5.3% | 2.2% |
| Gulfport #13 Voting District | 5,506 | 3,862 | 28.7% | 10.5% | 53.5% | 0.9% | $33k | 10.3% | 40.8% | 7.5% | 28.6% | 36.5% | 4.5% |
| Gulfport #14 Voting District | 3,832 | 2,817 | 17.8% | 0.4% | 70.6% | 0.3% | $29k | 10.5% | 13.6% | 16.2% | 31.6% | 34.5% | 0.5% |
| Gulfport #16 Voting District | 1,771 | 1,476 | 56.1% | 6.2% | 29.0% | 1.2% | $37k | 21.8% | 26.8% | 22.8% | 58.0% | 29.6% | 5.8% |
| Gulfport #3 Voting District | 1,335 | 1,099 | 39.6% | 6.2% | 49.0% | 0.2% | $48k | 20.1% | 17.9% | 21.3% | 46.1% | 24.0% | 5.0% |
| Gulfport #3 Voting District | 707 | 613 | 51.4% | 16.3% | 27.6% | 0.7% | $72k | 31.8% | 10.1% | 35.5% | 51.3% | 12.9% | 15.9% |
| Gulfport #5 Voting District | 1,816 | 1,714 | 36.8% | 1.9% | 54.9% | 0.5% | $42k | 14.0% | 20.5% | 22.3% | 72.6% | 44.0% | 1.1% |
| Gulfport #8 Voting District | 3,486 | 2,905 | 35.7% | 2.0% | 53.7% | 0.1% | $47k | 10.8% | 19.5% | 8.8% | 24.4% | 30.9% | 1.1% |
| Howard Creek Voting District | 6,961 | 5,549 | 66.9% | 5.9% | 17.2% | 2.0% | $71k | 30.9% | 14.9% | 14.2% | 73.9% | 9.4% | 2.2% |
| Ladner Voting District | 1,747 | 1,382 | 82.2% | 3.0% | 9.7% | 0.0% | $57k | 21.2% | 4.6% | 26.2% | 84.6% | 22.5% | 1.6% |
| Long Beach #5 Voting District | 3,048 | 2,271 | 82.0% | 0.6% | 6.7% | 0.2% | $84k | 37.4% | 15.9% | 21.5% | 72.0% | 9.2% | 0.4% |
| Long Beach #6 Voting District | 3,214 | 2,398 | 74.5% | 2.1% | 12.9% | 4.6% | $71k | 34.5% | 17.7% | 23.3% | 70.0% | 16.0% | 0.4% |
| Lyman Voting District | 11,325 | 8,139 | 64.1% | 5.0% | 21.4% | 1.2% | $81k | 26.3% | 14.6% | 14.3% | 86.6% | 12.3% | 1.0% |
| Magnolia Grove Voting District | 2,136 | 1,747 | 38.3% | 12.7% | 41.4% | 1.3% | $24k | 11.9% | 18.0% | 21.3% | 34.5% | 46.8% | 4.9% |
| Margaret Sherry Voting District | 3,439 | 2,722 | 68.9% | 7.6% | 17.5% | 1.4% | $84k | 31.6% | 15.2% | 25.5% | 79.8% | 8.4% | 3.8% |
| New Hope Voting District | 4,802 | 3,430 | 73.7% | 2.5% | 18.2% | 0.3% | $66k | 24.6% | 15.7% | 13.5% | 72.8% | 9.9% | 0.9% |
| New Popps Ferry Voting District | 1,690 | 1,073 | 59.3% | 6.7% | 26.7% | 3.6% | $48k | 36.8% | 26.3% | 15.2% | 37.8% | 18.1% | 2.6% |
| North Bay Voting District | 13,370 | 9,454 | 63.3% | 8.0% | 17.5% | 5.2% | $68k | 24.3% | 21.6% | 14.9% | 57.7% | 21.2% | 4.9% |
| North Bel-Aire Voting District | 8,999 | 6,466 | 41.4% | 5.9% | 38.5% | 2.4% | $64k | 24.9% | 17.1% | 14.2% | 62.6% | 16.8% | 3.6% |
| Outside Long Beach Voting District | 1,436 | 1,049 | 69.0% | 7.0% | 13.8% | 2.1% | $31k | 19.2% | 20.1% | 12.4% | 56.0% | 27.4% | 6.0% |
| Peace Voting District | 4,579 | 3,360 | 78.3% | 5.6% | 5.1% | 5.7% | $87k | 33.8% | 10.3% | 13.9% | 84.7% | 5.4% | 2.6% |
| Pineville Voting District | 3,937 | 3,139 | 86.0% | 4.5% | 4.7% | 1.4% | $78k | 27.4% | 13.4% | 21.0% | 77.0% | 12.3% | 3.0% |
| Poplar Head Voting District | 970 | 643 | 92.6% | 1.4% | 4.2% | 0.0% | $102k | 33.6% | 12.4% | 10.8% | 83.4% | 8.9% | 0.1% |
| Riceville Voting District | 915 | 725 | 88.0% | 2.9% | 5.9% | 0.0% | $58k | 14.0% | 26.5% | 17.9% | 76.7% | 24.8% | 1.1% |
| Saucier Voting District | 2,412 | 1,868 | 90.8% | 0.4% | 5.3% | 0.0% | $48k | 8.0% | 21.1% | 18.5% | 84.0% | 25.8% | 1.0% |
| South Bel-Aire Voting District | 4,624 | 3,423 | 38.5% | 9.1% | 45.3% | 3.5% | $50k | 21.7% | 26.5% | 13.0% | 49.1% | 29.2% | 8.4% |
| Stonewall Voting District | 5,345 | 4,270 | 46.5% | 10.2% | 38.7% | 1.6% | $59k | 28.2% | 24.7% | 14.3% | 57.7% | 18.7% | 4.5% |
| Vidalia Voting District | 1,276 | 1,070 | 90.1% | 1.5% | 4.8% | 0.6% | $70k | 9.6% | 26.5% | 18.0% | 90.6% | 10.8% | 0.0% |
| West Handsboro Voting District | 3,811 | 2,785 | 79.9% | 3.4% | 13.9% | 0.9% | $93k | 40.7% | 18.1% | 14.1% | 62.9% | 6.7% | 3.6% |
| West Lizana Voting District | 1,822 | 1,479 | 96.6% | 2.1% | 0.3% | 0.0% | $80k | 11.6% | 22.2% | 13.9% | 92.8% | 6.7% | 0.5% |
| West Long Beach Voting District | 5,481 | 4,294 | 72.2% | 7.4% | 15.6% | 1.9% | $75k | 42.4% | 23.7% | 16.3% | 54.5% | 8.7% | 6.7% |
| West Mississippi City Voting District | 2,538 | 1,965 | 56.2% | 11.1% | 22.2% | 2.3% | $39k | 20.4% | 22.1% | 12.0% | 41.5% | 33.6% | 4.7% |
| West North Gulfport Voting District | 1,434 | 1,109 | 18.7% | 10.6% | 58.8% | 1.5% | $45k | 17.6% | 15.0% | 19.2% | 70.9% | 17.4% | 12.1% |
| West Orange Grove Voting District | 8,846 | 6,546 | 60.7% | 5.6% | 24.2% | 1.4% | $71k | 31.5% | 13.4% | 14.9% | 82.7% | 11.7% | 2.6% |
| West Pass Christian Voting District | 2,929 | 2,242 | 69.4% | 3.4% | 18.8% | 1.1% | $75k | 44.1% | 14.3% | 21.1% | 70.1% | 11.7% | 1.1% |
| Westside Voting District | 1,538 | 1,384 | 50.3% | 13.9% | 28.3% | 2.5% | $59k | 25.7% | 14.5% | 30.5% | 58.8% | 14.9% | 12.7% |
| White Plains Voting District | 5,277 | 3,970 | 70.4% | 2.7% | 14.5% | 8.3% | $102k | 35.1% | 19.8% | 14.7% | 85.1% | 4.7% | 2.0% |
Jackson: 63 precincts
| Precinct | Population | Voting-age pop. | % White non-Hisp. | % Hispanic | % Black | % Asian | Median income* | % Bachelor's+ | % 18-29 (of adults) | % 65+ | % Homeowners | % Below poverty | % Spanish at home (adults) |
|---|---|---|---|---|---|---|---|---|---|---|---|---|---|
| Big Point Voting District | 3,508 | 2,717 | 89.7% | 0.6% | 1.2% | 0.8% | $81k | 17.2% | 15.9% | 17.7% | 88.7% | 12.8% | 0.6% |
| Carterville Voting District | 657 | 476 | 81.8% | 0.0% | 12.0% | 0.0% | $102k | 28.3% | 16.3% | 16.5% | 95.6% | 9.5% | 0.0% |
| East Central Voting District | 9,262 | 7,089 | 91.4% | 3.0% | 0.7% | 0.4% | $103k | 22.1% | 17.6% | 16.0% | 88.9% | 12.6% | 1.6% |
| Eastlawn Voting District | 2,915 | 2,373 | 72.4% | 8.3% | 11.4% | 0.0% | $86k | 20.5% | 17.6% | 29.3% | 77.5% | 7.4% | 9.5% |
| Escatawpa A Voting District | 35 | 23 | 53.5% | 0.0% | 40.9% | 4.7% | $51k | 9.7% | 22.2% | 10.8% | 70.0% | 0.0% | 0.0% |
| Escatawpa B Voting District | 274 | 233 | 59.1% | 12.0% | 25.4% | 1.4% | $114k | 37.3% | 30.4% | 14.3% | 65.0% | 4.7% | 8.1% |
| Escatawpa C Voting District | 1,053 | 808 | 49.4% | 0.0% | 44.1% | 2.9% | $51k | 18.3% | 13.8% | 13.3% | 59.5% | 13.0% | 0.0% |
| Escatawpa Voting District | 5,030 | 4,415 | 82.5% | 0.5% | 8.3% | 2.9% | $62k | 11.6% | 18.3% | 29.2% | 86.1% | 17.8% | 0.2% |
| Fair C Voting District | 3,705 | 2,630 | 33.2% | 25.3% | 35.1% | 4.1% | $37k | 17.1% | 32.6% | 11.4% | 38.8% | 26.9% | 23.9% |
| Fair D Voting District | 880 | 600 | 24.0% | 6.5% | 68.4% | 0.0% | $33k | 16.7% | 35.0% | 6.2% | 24.3% | 42.7% | 4.5% |
| Fair H Voting District | 230 | 157 | 33.8% | 0.4% | 65.8% | 0.0% | $32k | 23.6% | 30.3% | 8.4% | 51.1% | 55.2% | 0.6% |
| Fair Voting District | 4,117 | 3,097 | 36.1% | 8.0% | 52.4% | 0.3% | $39k | 11.7% | 25.7% | 12.4% | 36.5% | 32.6% | 9.5% |
| Fountainbleau A Voting District | 563 | 470 | 89.8% | 4.6% | 5.2% | 0.0% | $128k | 27.7% | 2.0% | 28.5% | 69.8% | 8.3% | 3.9% |
| Fountainbleau B Voting District | 30 | 27 | 69.1% | 11.0% | 17.9% | 0.0% | $52k | 23.6% | 26.9% | 19.1% | 15.7% | 21.0% | 2.7% |
| Fountainbleau C Voting District | 126 | 106 | 62.0% | 8.5% | 19.1% | 3.3% | $77k | 33.9% | 15.3% | 21.3% | 80.2% | 3.0% | 7.5% |
| Fountainbleau D Voting District | 2,102 | 1,625 | 52.7% | 7.8% | 21.4% | 1.6% | $78k | 34.9% | 17.1% | 15.6% | 54.1% | 8.0% | 6.0% |
| Fountainbleau Voting District | 8,914 | 6,563 | 75.9% | 5.7% | 8.4% | 0.6% | $89k | 37.0% | 15.6% | 11.1% | 79.3% | 3.1% | 4.8% |
| Gautier A Voting District | 701 | 502 | 50.2% | 7.3% | 41.6% | 0.1% | $88k | 11.9% | 22.4% | 16.9% | 52.8% | 19.8% | 7.1% |
| Gautier B Voting District | 1,655 | 1,395 | 60.4% | 6.9% | 20.4% | 0.0% | $76k | 23.7% | 17.0% | 15.0% | 59.1% | 8.3% | 6.7% |
| Gautier Voting District | 10,679 | 7,775 | 44.8% | 13.9% | 33.9% | 2.3% | $64k | 20.0% | 19.9% | 16.4% | 69.4% | 18.9% | 9.8% |
| Grace Baptist A Voting District | 1,574 | 1,208 | 76.3% | 2.3% | 5.3% | 11.7% | $96k | 47.2% | 11.5% | 17.2% | 64.1% | 4.2% | 0.6% |
| Grace Baptist B Voting District | 2,229 | 1,755 | 67.3% | 13.0% | 10.8% | 4.9% | $88k | 36.1% | 10.3% | 25.3% | 63.5% | 2.9% | 4.1% |
| Grace Baptist Voting District | 2,337 | 1,821 | 73.3% | 4.5% | 9.0% | 8.2% | $94k | 43.5% | 12.8% | 18.1% | 67.5% | 1.9% | 2.8% |
| Gulf Park Estates Voting District | 5,095 | 3,823 | 73.7% | 10.0% | 10.6% | 0.6% | $71k | 41.1% | 13.9% | 20.0% | 87.4% | 5.0% | 1.5% |
| Hickory Hill Voting District | 3,733 | 2,783 | 63.5% | 4.3% | 22.2% | 0.2% | $96k | 22.3% | 13.1% | 10.4% | 72.8% | 19.1% | 2.0% |
| Hickory Hills A Voting District | 999 | 836 | 84.8% | 3.6% | 6.2% | 2.9% | $94k | 40.9% | 7.7% | 24.8% | 96.7% | 14.0% | 4.2% |
| Hwy 57 Voting District | 861 | 690 | 94.0% | 0.0% | 2.6% | 0.7% | $83k | 24.6% | 20.6% | 14.7% | 98.6% | 5.4% | 0.0% |
| Jefferson Street Voting District | 3,987 | 3,215 | 23.9% | 10.9% | 60.6% | 2.2% | $43k | 16.9% | 22.3% | 23.6% | 62.7% | 18.4% | 8.1% |
| Larue Voting District | 1,346 | 1,072 | 96.2% | 0.0% | 1.9% | 0.2% | $77k | 23.5% | 23.8% | 12.5% | 98.4% | 3.5% | 0.0% |
| Latimer Voting District | 8,145 | 6,349 | 74.0% | 8.9% | 3.9% | 3.6% | $84k | 22.5% | 18.7% | 15.1% | 88.2% | 11.9% | 3.9% |
| North Pascagoula Voting District | 708 | 565 | 62.9% | 0.4% | 14.1% | 0.0% | $68k | 26.0% | 16.7% | 25.4% | 94.6% | 10.8% | 0.6% |
| North Vancleave Voting District | 2,888 | 2,273 | 89.3% | 1.9% | 5.1% | 0.8% | $96k | 31.4% | 15.1% | 13.0% | 97.9% | 10.4% | 0.0% |
| Ocean Springs Armory Voting District | 3,635 | 2,976 | 83.4% | 5.7% | 3.0% | 4.5% | $60k | 51.3% | 13.0% | 26.0% | 61.7% | 10.2% | 0.0% |
| Ocean Springs Civic Center A Voting District | 6,818 | 5,239 | 76.7% | 11.4% | 7.1% | 3.6% | $96k | 43.7% | 15.1% | 16.2% | 81.3% | 4.8% | 3.8% |
| Ocean Springs Civic Center B Voting District | 508 | 399 | 74.4% | 6.0% | 11.1% | 5.5% | $119k | 48.8% | 7.6% | 19.9% | 92.1% | 1.0% | 1.6% |
| Ocean Springs Comm Center Voting District | 516 | 480 | 95.2% | 2.6% | 1.1% | 0.0% | $40k | 51.9% | 3.9% | 60.4% | 32.1% | 19.2% | 0.0% |
| Orange Grove B Voting District | 63 | 49 | 91.6% | 1.3% | 0.0% | 0.0% | $79k | 20.6% | 21.0% | 16.0% | 94.1% | 12.8% | 1.7% |
| Orange Grove Voting District | 1,856 | 1,430 | 87.0% | 3.2% | 4.1% | 0.9% | $42k | 20.7% | 11.7% | 19.6% | 79.8% | 32.1% | 2.3% |
| Pinecrest B Voting District | 624 | 414 | 35.6% | 8.4% | 51.5% | 0.0% | $47k | 7.7% | 19.1% | 17.0% | 40.8% | 44.8% | 7.2% |
| Pinecrest C Voting District | 25 | 16 | 42.3% | 6.0% | 47.1% | 0.0% | $61k | 12.9% | 9.5% | 20.0% | 63.4% | 28.6% | 4.9% |
| Pinecrest Voting District | 1,699 | 1,108 | 35.9% | 22.0% | 38.9% | 0.0% | $57k | 15.0% | 18.3% | 15.6% | 53.3% | 21.3% | 14.4% |
| Presbyterian A Voting District | 116 | 99 | 56.1% | 13.7% | 27.2% | 1.5% | $118k | 39.7% | 30.7% | 14.0% | 61.8% | 1.8% | 9.3% |
| Presbyterian B Voting District | 114 | 81 | 53.3% | 1.2% | 45.4% | 0.0% | $52k | 19.8% | 21.7% | 16.6% | 61.7% | 22.0% | 6.9% |
| Presbyterian Voting District | 1,315 | 1,052 | 82.2% | 3.2% | 12.1% | 0.0% | $105k | 37.0% | 18.3% | 23.9% | 57.9% | 7.7% | 2.9% |
| Rec Center Voting District | 3,711 | 2,883 | 16.3% | 5.7% | 74.9% | 1.1% | $40k | 11.5% | 16.9% | 18.0% | 70.6% | 27.5% | 3.5% |
| Red Hill Voting District | 216 | 156 | 82.1% | 0.0% | 11.8% | 0.0% | $102k | 28.0% | 16.3% | 16.6% | 95.7% | 9.4% | 0.0% |
| Sacred Heart A Voting District | 531 | 303 | 21.4% | 43.2% | 35.0% | 0.0% | $52k | 11.4% | 26.5% | 10.0% | 49.3% | 51.2% | 23.0% |
| Sacred Heart Voting District | 2,720 | 2,244 | 65.8% | 0.7% | 30.0% | 0.0% | $68k | 38.5% | 14.1% | 29.0% | 75.2% | 22.6% | 1.3% |
| South Vancleave A Voting District | 2,042 | 1,474 | 96.0% | 0.5% | 0.2% | 0.2% | $62k | 23.6% | 8.5% | 23.5% | 90.6% | 1.3% | 0.1% |
| South Vancleave B Voting District | 240 | 194 | 98.4% | 0.0% | 0.3% | 0.3% | $73k | 22.8% | 24.6% | 12.1% | 98.9% | 2.7% | 0.0% |
| South Vancleave C Voting District | 73 | 61 | 91.7% | 0.1% | 1.4% | 2.2% | $92k | 26.1% | 12.9% | 20.3% | 99.7% | 9.7% | 0.0% |
| South Vancleave Voting District | 3,176 | 2,382 | 80.6% | 2.2% | 5.4% | 1.4% | $111k | 25.6% | 14.7% | 12.3% | 88.8% | 11.3% | 1.2% |
| St. Martin C Voting District | 617 | 475 | 66.6% | 10.6% | 3.8% | 1.4% | $65k | 12.8% | 26.4% | 18.4% | 67.4% | 23.8% | 3.9% |
| St. Martin Voting District | 8,692 | 6,797 | 71.0% | 5.9% | 13.1% | 5.5% | $57k | 16.9% | 27.5% | 11.8% | 54.1% | 16.9% | 1.9% |
| Sue Ellen A Voting District | 61 | 40 | 7.3% | 46.9% | 42.6% | 0.0% | $14k | 5.6% | 5.3% | 20.7% | 25.6% | 80.0% | 30.0% |
| Sue Ellen Voting District | 2,126 | 1,678 | 2.3% | 3.0% | 93.1% | 0.1% | $35k | 8.3% | 18.5% | 18.9% | 62.6% | 23.5% | 2.6% |
| Villia Maria Voting District | 654 | 518 | 95.2% | 1.5% | 1.0% | 0.0% | $40k | 65.5% | 4.6% | 37.0% | 50.4% | 8.6% | 0.0% |
| West Jackson A Voting District | 3,227 | 2,457 | 64.9% | 18.0% | 5.9% | 5.5% | $82k | 40.8% | 13.1% | 17.8% | 86.2% | 15.3% | 8.8% |
| West Jackson B Voting District | 1,543 | 1,134 | 62.5% | 12.6% | 13.1% | 4.0% | $104k | 37.7% | 11.9% | 14.1% | 90.0% | 8.4% | 3.3% |
| West Jackson C Voting District | 882 | 680 | 69.9% | 8.0% | 6.0% | 4.0% | $98k | 31.9% | 18.2% | 11.1% | 89.7% | 8.1% | 1.2% |
| West Jackson Voting District | 4,258 | 3,428 | 72.7% | 10.5% | 11.9% | 0.4% | $59k | 31.8% | 31.4% | 11.1% | 56.8% | 8.5% | 5.8% |
| YMBC/Dantzler Voting District | 1,965 | 1,670 | 44.6% | 11.2% | 41.9% | 0.0% | $68k | 22.4% | 14.1% | 24.0% | 86.3% | 10.3% | 5.7% |
| YMBC_Dantzler B Voting District | 231 | 193 | 53.0% | 15.7% | 26.6% | 1.8% | $96k | 31.4% | 25.5% | 19.5% | 74.1% | 4.3% | 10.9% |
Forrest: 34 precincts
| Precinct | Population | Voting-age pop. | % White non-Hisp. | % Hispanic | % Black | % Asian | Median income* | % Bachelor's+ | % 18-29 (of adults) | % 65+ | % Homeowners | % Below poverty | % Spanish at home (adults) |
|---|---|---|---|---|---|---|---|---|---|---|---|---|---|
| Barrontown-Macedonia Voting District | 5,043 | 3,441 | 87.3% | 3.1% | 6.0% | 1.1% | $64k | 24.6% | 19.2% | 9.3% | 92.4% | 8.9% | 0.9% |
| Brooklyn Voting District | 910 | 617 | 97.5% | 0.1% | 1.0% | 0.2% | $80k | 21.9% | 10.3% | 12.7% | 90.1% | 8.4% | 0.2% |
| Camp School Voting District | 1,006 | 924 | 60.4% | 3.7% | 31.7% | 0.0% | $45k | 34.0% | 23.3% | 22.8% | 51.2% | 10.7% | 1.0% |
| Carnes Voting District | 2,001 | 1,298 | 97.3% | 0.1% | 1.3% | 0.3% | $93k | 16.1% | 12.1% | 12.4% | 91.2% | 5.4% | 0.2% |
| Court Street Voting District | 2,096 | 1,830 | 37.0% | 4.1% | 53.4% | 0.0% | $55k | 27.0% | 16.5% | 29.0% | 59.6% | 29.8% | 2.0% |
| Dantzler Voting District | 1,097 | 844 | 94.1% | 0.4% | 1.5% | 0.4% | $65k | 29.2% | 10.4% | 15.4% | 85.2% | 15.7% | 0.7% |
| Dixie Pine-Central Voting District | 3,923 | 2,823 | 30.3% | 4.3% | 64.2% | 0.0% | $44k | 19.7% | 16.8% | 17.4% | 59.7% | 31.1% | 0.6% |
| Dixie Voting District | 2,227 | 1,670 | 92.1% | 0.4% | 1.9% | 2.5% | $69k | 41.2% | 21.8% | 19.6% | 87.6% | 15.2% | 0.5% |
| East Petal Voting District | 2,529 | 1,875 | 70.4% | 5.5% | 16.9% | 0.5% | $56k | 21.1% | 29.9% | 13.2% | 66.4% | 9.5% | 2.9% |
| Eatonville Voting District | 927 | 745 | 63.4% | 1.8% | 31.6% | 0.0% | $72k | 47.6% | 30.6% | 16.8% | 73.4% | 14.8% | 0.0% |
| Eureka School Voting District | 638 | 543 | 8.1% | 0.9% | 90.5% | 0.0% | $59k | 17.7% | 24.6% | 15.7% | 47.7% | 21.4% | 2.6% |
| Glendale Voting District | 1,593 | 1,367 | 49.7% | 4.2% | 42.7% | 1.4% | $56k | 21.1% | 16.0% | 17.0% | 73.4% | 27.7% | 0.0% |
| Hardy Street Voting District | 2,229 | 2,037 | 60.6% | 3.6% | 27.3% | 0.0% | $60k | 49.8% | 42.4% | 13.5% | 53.0% | 27.0% | 3.0% |
| Hattiesburg Cultural Center Voting District | 905 | 813 | 29.5% | 10.6% | 53.6% | 0.0% | $36k | 27.4% | 23.2% | 19.3% | 45.6% | 32.8% | 2.3% |
| Highland Park Voting District | 3,354 | 2,867 | 38.7% | 1.4% | 53.9% | 1.6% | $38k | 34.1% | 67.1% | 2.4% | 10.9% | 48.8% | 1.8% |
| Leeville Voting District | 2,405 | 1,706 | 88.6% | 4.9% | 4.3% | 0.4% | $100k | 31.9% | 19.6% | 19.7% | 90.0% | 7.2% | 1.9% |
| Lillie Burney School Voting District | 5,141 | 3,670 | 12.1% | 3.2% | 81.2% | 0.5% | $23k | 13.5% | 41.2% | 14.2% | 31.9% | 42.3% | 1.2% |
| Maxie Voting District | 501 | 316 | 98.3% | 0.0% | 1.1% | 0.3% | $95k | 14.8% | 11.2% | 11.4% | 92.5% | 4.2% | 0.0% |
| Mclaurin Voting District | 1,292 | 856 | 97.4% | 0.0% | 1.1% | 0.0% | $69k | 25.9% | 19.4% | 19.9% | 93.7% | 3.9% | 0.9% |
| North Heights Voting District | 2,814 | 2,229 | 26.3% | 6.2% | 63.5% | 0.0% | $36k | 26.2% | 36.5% | 11.5% | 31.9% | 30.2% | 3.0% |
| Petal Masonic Lodge Voting District | 1,925 | 1,438 | 72.3% | 0.4% | 24.4% | 0.0% | $56k | 28.6% | 16.5% | 17.8% | 66.5% | 12.2% | 0.2% |
| Pinecrest Voting District | 4,473 | 3,984 | 48.0% | 7.4% | 37.5% | 3.4% | $48k | 52.3% | 66.0% | 7.4% | 16.2% | 36.4% | 3.6% |
| Rawls Springs Voting District | 3,190 | 2,538 | 51.0% | 4.8% | 41.6% | 0.0% | $54k | 28.8% | 31.2% | 12.4% | 57.4% | 9.0% | 3.5% |
| Richburg Voting District | 2,344 | 1,678 | 41.5% | 3.3% | 53.6% | 0.3% | $41k | 54.7% | 33.3% | 11.5% | 59.0% | 33.1% | 4.0% |
| Rowan School Voting District | 994 | 764 | 2.0% | 5.0% | 92.5% | 0.0% | $50k | 10.7% | 27.4% | 17.3% | 42.1% | 38.5% | 3.5% |
| Sheeplo Voting District | 2,331 | 1,746 | 70.1% | 2.5% | 21.9% | 0.0% | $103k | 10.5% | 19.6% | 15.0% | 70.7% | 7.4% | 0.1% |
| Sigler Center Voting District | 4,315 | 3,354 | 29.7% | 6.5% | 56.8% | 0.8% | $48k | 23.0% | 47.7% | 3.8% | 33.4% | 30.3% | 3.7% |
| Sunrise Voting District | 4,523 | 3,368 | 86.6% | 0.3% | 5.6% | 5.1% | $104k | 33.3% | 11.9% | 13.1% | 91.3% | 2.1% | 0.0% |
| Thames School Voting District | 2,910 | 2,205 | 65.7% | 13.8% | 19.4% | 0.1% | $86k | 58.8% | 16.8% | 22.4% | 79.7% | 12.4% | 5.5% |
| Timberton Voting District | 1,286 | 855 | 59.1% | 4.9% | 34.8% | 0.1% | $60k | 44.5% | 17.3% | 16.0% | 83.8% | 33.4% | 1.4% |
| Train Depot Voting District | 546 | 456 | 20.1% | 2.0% | 74.8% | 0.0% | $59k | 24.4% | 22.0% | 19.3% | 60.6% | 22.2% | 2.1% |
| West Hills Voting District | 2,069 | 1,780 | 50.7% | 2.2% | 37.3% | 0.0% | $46k | 50.0% | 61.0% | 8.6% | 27.5% | 16.9% | 1.8% |
| West Petal Voting District | 2,459 | 1,916 | 58.7% | 12.4% | 24.9% | 0.0% | $61k | 21.0% | 21.4% | 14.4% | 50.0% | 23.6% | 6.4% |
| Westside Voting District | 1,943 | 1,654 | 50.3% | 11.8% | 33.2% | 0.2% | $46k | 51.5% | 29.3% | 19.1% | 51.8% | 23.0% | 4.8% |
Lamar: 23 precincts
| Precinct | Population | Voting-age pop. | % White non-Hisp. | % Hispanic | % Black | % Asian | Median income* | % Bachelor's+ | % 18-29 (of adults) | % 65+ | % Homeowners | % Below poverty | % Spanish at home (adults) |
|---|---|---|---|---|---|---|---|---|---|---|---|---|---|
| Arnold Line Voting District | 4,038 | 2,655 | 52.8% | 4.8% | 39.9% | 1.0% | $61k | 41.1% | 34.2% | 6.7% | 35.5% | 24.9% | 5.1% |
| Baxterville Voting District | 1,663 | 1,322 | 95.9% | 0.0% | 0.7% | 0.4% | $93k | 14.1% | 20.8% | 12.9% | 96.6% | 18.5% | 0.5% |
| Bellevue Voting District | 1,886 | 1,452 | 81.6% | 0.8% | 12.5% | 0.0% | $124k | 54.7% | 11.6% | 22.5% | 87.4% | 2.8% | 1.0% |
| Breland Voting District | 4,701 | 3,782 | 65.1% | 2.6% | 27.8% | 1.7% | $113k | 40.4% | 18.5% | 15.0% | 48.7% | 7.7% | 2.1% |
| Greenville Voting District | 1,486 | 1,104 | 93.7% | 0.1% | 3.3% | 0.1% | $105k | 15.5% | 10.9% | 12.2% | 91.1% | 14.4% | 0.2% |
| Lake Serene Voting District | 5,399 | 4,212 | 73.4% | 1.6% | 19.9% | 0.2% | $124k | 49.0% | 13.2% | 27.8% | 86.0% | 6.5% | 2.0% |
| Lamar Park Voting District | 2,550 | 1,806 | 43.2% | 0.8% | 54.2% | 0.3% | $78k | 49.4% | 16.4% | 17.1% | 74.0% | 9.5% | 0.9% |
| Lumberton Voting District | 2,254 | 1,606 | 54.6% | 0.7% | 42.4% | 0.0% | $47k | 21.7% | 17.6% | 20.2% | 66.2% | 27.0% | 0.3% |
| Midway Voting District | 3,228 | 2,506 | 91.4% | 1.5% | 5.0% | 0.0% | $76k | 21.9% | 13.1% | 11.8% | 80.6% | 15.1% | 1.2% |
| Mill Creek Voting District | 1,372 | 1,121 | 77.5% | 6.0% | 14.0% | 0.0% | $59k | 29.6% | 19.4% | 14.8% | 67.8% | 11.9% | 2.3% |
| N E Lamar Voting District | 4,728 | 3,578 | 38.2% | 17.3% | 35.0% | 1.7% | $49k | 38.3% | 39.7% | 13.8% | 30.3% | 35.2% | 9.8% |
| Oak Grove Voting District | 2,612 | 2,059 | 78.4% | 4.5% | 13.6% | 1.9% | $79k | 44.0% | 13.5% | 13.5% | 80.7% | 10.7% | 1.4% |
| Okahola Voting District | 2,461 | 1,848 | 73.4% | 3.2% | 17.6% | 3.2% | $85k | 49.1% | 15.4% | 15.7% | 67.6% | 4.6% | 1.9% |
| Oloh Voting District | 2,486 | 1,919 | 80.4% | 3.2% | 15.7% | 0.0% | $77k | 18.6% | 14.1% | 13.4% | 92.4% | 13.3% | 0.8% |
| Pine Grove Voting District | 1,381 | 1,083 | 90.0% | 3.2% | 5.5% | 0.0% | $60k | 14.8% | 10.5% | 14.1% | 90.7% | 15.4% | 2.3% |
| Purvis Voting District | 3,427 | 2,629 | 85.3% | 3.3% | 9.1% | 0.0% | $59k | 21.9% | 16.2% | 18.4% | 86.2% | 12.7% | 1.8% |
| Richburg Voting District | 3,643 | 2,707 | 54.7% | 5.0% | 29.4% | 4.9% | $75k | 47.9% | 22.7% | 12.1% | 56.2% | 12.6% | 3.2% |
| Rocky Branch Voting District | 1,607 | 1,237 | 73.0% | 0.6% | 26.3% | 0.0% | $53k | 10.6% | 17.6% | 15.4% | 91.7% | 17.2% | 0.1% |
| South Purvis Voting District | 3,690 | 2,651 | 83.5% | 6.5% | 9.0% | 0.1% | $71k | 28.6% | 15.8% | 17.2% | 82.7% | 17.7% | 2.3% |
| Sumrall Voting District | 6,694 | 4,784 | 86.4% | 1.8% | 8.8% | 0.9% | $88k | 30.7% | 14.8% | 11.6% | 92.5% | 8.8% | 0.2% |
| Wesley Manor Voting District | 2,918 | 2,416 | 52.4% | 0.8% | 42.7% | 0.5% | $54k | 37.8% | 35.1% | 12.7% | 35.2% | 22.9% | 3.1% |
| Westover Voting District | 857 | 741 | 64.9% | 0.4% | 32.2% | 0.0% | $85k | 50.7% | 27.8% | 10.2% | 54.3% | 12.8% | 0.0% |
| Yawn Voting District | 879 | 692 | 63.8% | 1.7% | 29.7% | 0.0% | $44k | 12.6% | 12.5% | 24.8% | 82.3% | 14.4% | 0.6% |
Pearl River: 26 precincts
| Precinct | Population | Voting-age pop. | % White non-Hisp. | % Hispanic | % Black | % Asian | Median income* | % Bachelor's+ | % 18-29 (of adults) | % 65+ | % Homeowners | % Below poverty | % Spanish at home (adults) |
|---|---|---|---|---|---|---|---|---|---|---|---|---|---|
| Amackertown 2 Voting District | 1,069 | 886 | 95.7% | 0.3% | 0.2% | 0.5% | $66k | 18.4% | 23.5% | 27.0% | 92.8% | 16.3% | 0.0% |
| Caesar 3 Voting District | 249 | 174 | 95.0% | 0.0% | 0.0% | 0.0% | $64k | 0.2% | 5.8% | 21.7% | 80.2% | 40.9% | 0.0% |
| Carriere 3 Voting District | 3,226 | 2,455 | 92.7% | 0.7% | 2.8% | 0.2% | $78k | 14.3% | 16.5% | 15.2% | 85.9% | 13.2% | 0.5% |
| Carriere 5 Voting District | 4,150 | 3,188 | 91.2% | 1.5% | 4.3% | 0.1% | $86k | 25.0% | 13.4% | 22.4% | 93.5% | 7.2% | 0.5% |
| Crossroads 2 Voting District | 1,420 | 1,185 | 95.6% | 1.7% | 0.4% | 0.5% | $60k | 17.7% | 20.3% | 22.2% | 88.8% | 14.0% | 1.3% |
| Derby 1 Voting District | 1,115 | 888 | 85.1% | 1.4% | 9.9% | 0.1% | $47k | 19.0% | 23.5% | 18.6% | 77.1% | 21.7% | 2.6% |
| FZ Goss 4 Voting District | 4,411 | 3,394 | 90.6% | 3.2% | 2.1% | 0.5% | $67k | 10.5% | 14.2% | 12.8% | 89.8% | 18.0% | 1.6% |
| Gum Pond/Hickory Grove 3 Voting District | 1,662 | 1,311 | 91.7% | 1.3% | 3.4% | 0.0% | $50k | 9.0% | 3.3% | 25.8% | 95.3% | 15.0% | 0.0% |
| Henleyfield 2 Voting District | 1,834 | 1,365 | 92.9% | 5.6% | 0.9% | 0.0% | $49k | 19.3% | 21.3% | 16.2% | 85.6% | 10.6% | 3.8% |
| McNeill 3 Voting District | 3,086 | 2,327 | 90.9% | 4.1% | 0.9% | 0.2% | $77k | 25.8% | 19.0% | 16.7% | 89.1% | 13.8% | 0.8% |
| Mill Creek 2 Voting District | 1,073 | 818 | 89.2% | 2.5% | 3.8% | 0.2% | $51k | 17.8% | 23.5% | 18.1% | 81.2% | 13.3% | 1.6% |
| Nicholson 4 Voting District | 2,956 | 2,225 | 62.6% | 16.4% | 13.0% | 0.0% | $47k | 6.2% | 25.1% | 16.5% | 67.6% | 23.6% | 11.2% |
| Picayune 1 East Voting District | 3,785 | 2,780 | 54.7% | 6.6% | 35.2% | 0.1% | $53k | 17.6% | 16.3% | 16.2% | 64.3% | 18.7% | 4.4% |
| Picayune 1 Southside Voting District | 2,506 | 2,046 | 30.9% | 3.2% | 62.5% | 0.0% | $34k | 7.9% | 22.4% | 23.9% | 44.0% | 17.5% | 2.2% |
| Picayune 2 Voting District | 2,845 | 2,125 | 69.3% | 2.4% | 21.7% | 0.0% | $47k | 22.8% | 18.4% | 20.4% | 69.7% | 19.2% | 2.3% |
| Picayune 4 Voting District | 1,527 | 1,182 | 63.5% | 12.8% | 15.9% | 0.0% | $41k | 11.1% | 19.8% | 21.3% | 73.1% | 27.4% | 8.1% |
| Picayune/HAWL 5 Voting District | 5,519 | 4,189 | 78.7% | 5.5% | 9.9% | 0.0% | $73k | 25.8% | 15.3% | 22.8% | 84.8% | 12.0% | 3.3% |
| Pine Grove 4 Voting District | 2,037 | 1,620 | 78.1% | 1.9% | 10.3% | 0.0% | $53k | 16.8% | 14.3% | 21.9% | 85.0% | 22.4% | 2.5% |
| Poplarville 1 Voting District | 844 | 632 | 68.6% | 1.1% | 27.9% | 0.1% | $50k | 21.7% | 32.9% | 12.2% | 64.7% | 15.8% | 0.1% |
| Poplarville 2 Voting District | 1,608 | 1,423 | 80.0% | 4.0% | 13.2% | 0.4% | $49k | 15.9% | 34.3% | 25.6% | 92.7% | 12.2% | 0.2% |
| Poplarville 3 Voting District | 3,529 | 2,671 | 73.9% | 2.9% | 19.4% | 0.1% | $55k | 17.7% | 29.9% | 15.5% | 73.4% | 14.7% | 0.2% |
| Progress 3 Voting District | 736 | 474 | 99.9% | 0.0% | 0.0% | 0.0% | $47k | 5.5% | 17.3% | 17.9% | 76.0% | 39.9% | 0.0% |
| Spring Hill 2 Voting District | 772 | 632 | 91.8% | 1.8% | 2.3% | 0.0% | $52k | 10.6% | 10.3% | 31.7% | 97.9% | 11.9% | 0.0% |
| Steep Hollow 3 Voting District | 2,697 | 1,930 | 88.8% | 5.3% | 0.2% | 0.0% | $67k | 7.8% | 15.6% | 22.4% | 84.9% | 17.6% | 0.0% |
| Sycamore 5 Voting District | 2,054 | 1,815 | 80.5% | 8.7% | 2.7% | 6.3% | $77k | 21.9% | 16.1% | 22.0% | 83.7% | 19.8% | 1.4% |
| Whitesand 1 Voting District | 595 | 460 | 78.4% | 0.7% | 20.2% | 0.1% | $49k | 20.0% | 12.8% | 21.0% | 76.8% | 22.6% | 0.0% |
Jones: 34 precincts
| Precinct | Population | Voting-age pop. | % White non-Hisp. | % Hispanic | % Black | % Asian | Median income* | % Bachelor's+ | % 18-29 (of adults) | % 65+ | % Homeowners | % Below poverty | % Spanish at home (adults) |
|---|---|---|---|---|---|---|---|---|---|---|---|---|---|
| Antioch Voting District | 550 | 406 | 97.3% | 0.6% | 0.4% | 0.0% | $59k | 15.9% | 16.0% | 19.3% | 83.6% | 7.3% | 0.0% |
| Blackwell Voting District | 108 | 84 | 99.9% | 0.0% | 0.0% | 0.0% | $53k | 0.0% | 21.9% | 16.7% | 85.0% | 5.7% | 0.0% |
| Bruce Voting District | 1,071 | 741 | 57.0% | 9.5% | 25.9% | 0.0% | $61k | 21.7% | 9.6% | 16.6% | 80.4% | 25.4% | 6.2% |
| Calhoun Voting District | 2,907 | 2,200 | 81.3% | 10.1% | 7.6% | 0.0% | $53k | 23.5% | 24.7% | 24.2% | 77.4% | 14.2% | 5.7% |
| Centerville Voting District | 517 | 363 | 90.4% | 0.7% | 7.1% | 0.0% | $71k | 17.8% | 16.7% | 12.3% | 87.3% | 3.4% | 1.9% |
| County Barn Voting District | 1,397 | 1,085 | 71.9% | 7.0% | 20.2% | 0.2% | $46k | 14.8% | 18.7% | 19.8% | 77.5% | 18.5% | 2.3% |
| Currie Voting District | 1,050 | 865 | 35.3% | 8.8% | 55.8% | 0.0% | $49k | 12.1% | 19.8% | 12.3% | 66.8% | 20.8% | 5.1% |
| Erata Voting District | 1,030 | 810 | 73.8% | 1.2% | 20.9% | 0.4% | $55k | 17.2% | 18.9% | 21.3% | 89.5% | 20.4% | 0.3% |
| G.V. Harrison Multipurpose Bldg. Voting District | 2,156 | 1,792 | 58.1% | 8.3% | 31.9% | 0.5% | $34k | 20.2% | 31.8% | 18.9% | 60.0% | 25.7% | 4.7% |
| Gitano Voting District | 546 | 422 | 63.7% | 0.0% | 36.2% | 0.1% | $61k | 24.1% | 13.1% | 17.1% | 96.6% | 12.2% | 0.5% |
| Glade School Voting District | 2,049 | 1,532 | 63.6% | 4.8% | 30.0% | 0.0% | $49k | 14.4% | 19.6% | 21.3% | 86.8% | 18.0% | 2.5% |
| Hebron Voting District | 1,388 | 1,005 | 52.5% | 8.3% | 32.7% | 0.0% | $55k | 20.4% | 10.1% | 16.6% | 84.8% | 27.1% | 5.1% |
| Johnson Voting District | 541 | 428 | 96.7% | 0.3% | 2.6% | 0.0% | $84k | 21.4% | 10.0% | 11.5% | 92.1% | 11.3% | 0.6% |
| Landrum Comm. Ctr. Voting District | 560 | 448 | 96.0% | 0.0% | 1.5% | 0.0% | $73k | 17.5% | 9.6% | 17.6% | 87.0% | 17.5% | 0.6% |
| Lt. Ellis Center Voting District | 2,329 | 1,857 | 14.4% | 0.7% | 83.7% | 0.0% | $37k | 6.0% | 13.6% | 19.8% | 68.7% | 22.7% | 0.5% |
| Magnolia Center Voting District | 4,810 | 3,498 | 20.7% | 4.8% | 73.0% | 0.2% | $37k | 21.1% | 18.9% | 18.8% | 64.0% | 30.4% | 3.4% |
| Mauldin Comm. Center Voting District | 3,334 | 2,350 | 74.1% | 6.2% | 18.6% | 0.1% | $81k | 36.8% | 25.5% | 15.6% | 86.6% | 11.7% | 7.9% |
| Moselle Voting District | 1,198 | 885 | 80.9% | 13.3% | 5.7% | 0.0% | $58k | 19.4% | 12.3% | 29.1% | 93.3% | 12.1% | 7.1% |
| Myrick Voting District | 1,919 | 1,456 | 98.7% | 0.3% | 0.0% | 0.0% | $67k | 22.2% | 11.2% | 15.5% | 81.2% | 6.5% | 0.0% |
| North Laurel Voting District | 3,280 | 2,540 | 40.8% | 4.4% | 54.0% | 0.7% | $54k | 25.6% | 34.9% | 11.3% | 58.2% | 22.8% | 5.9% |
| Oak Park School Voting District | 505 | 417 | 23.3% | 7.4% | 66.3% | 0.0% | $38k | 6.1% | 24.7% | 14.1% | 83.9% | 23.0% | 4.5% |
| Ovett Voting District | 2,683 | 2,236 | 95.5% | 1.2% | 0.0% | 0.0% | $79k | 14.4% | 10.4% | 21.5% | 83.8% | 13.3% | 1.9% |
| Parkview Baptist Church Voting District | 2,161 | 1,347 | 47.0% | 28.2% | 24.4% | 0.0% | $44k | 30.8% | 33.5% | 9.1% | 46.0% | 32.5% | 16.8% |
| Pinegrove Voting District | 1,383 | 973 | 72.0% | 10.5% | 12.9% | 2.8% | $68k | 25.3% | 13.3% | 21.3% | 96.1% | 14.0% | 3.5% |
| Pleasant Ridge Voting District | 1,248 | 858 | 81.5% | 4.8% | 12.0% | 0.1% | $79k | 30.2% | 21.5% | 15.4% | 78.9% | 6.7% | 4.9% |
| Powers Comm. Ctr. Voting District | 1,715 | 1,305 | 79.2% | 3.0% | 13.3% | 0.1% | $69k | 23.6% | 18.6% | 28.4% | 78.8% | 13.4% | 1.7% |
| Rainey Voting District | 1,567 | 1,185 | 76.4% | 10.3% | 8.3% | 2.8% | $44k | 14.2% | 13.8% | 20.2% | 86.8% | 24.7% | 5.6% |
| Rustin Voting District | 1,102 | 790 | 75.4% | 2.2% | 4.4% | 1.0% | $64k | 17.4% | 15.4% | 16.3% | 86.3% | 19.3% | 1.2% |
| Sandhill Voting District | 1,394 | 957 | 84.5% | 0.9% | 11.2% | 0.8% | $82k | 27.5% | 14.3% | 11.9% | 88.5% | 3.8% | 2.5% |
| Shelton Voting District | 3,038 | 1,709 | 44.9% | 16.9% | 36.5% | 0.0% | $87k | 24.3% | 18.2% | 11.8% | 75.9% | 35.3% | 1.6% |
| Soso Voting District | 1,319 | 961 | 65.4% | 3.5% | 28.3% | 0.1% | $70k | 27.7% | 12.6% | 17.9% | 88.7% | 14.8% | 2.5% |
| Tuckers Voting District | 1,548 | 1,110 | 89.5% | 1.4% | 6.5% | 0.0% | $54k | 17.0% | 14.8% | 16.6% | 85.5% | 10.3% | 0.0% |
| Union Voting District | 1,532 | 1,165 | 88.1% | 9.0% | 2.8% | 0.0% | $65k | 20.9% | 8.9% | 21.6% | 88.8% | 5.2% | 5.1% |
| West Ellisville Voting District | 2,494 | 1,977 | 48.3% | 10.4% | 40.5% | 0.3% | $39k | 19.8% | 32.5% | 12.6% | 54.9% | 21.8% | 7.4% |
Hancock: 25 precincts
| Precinct | Population | Voting-age pop. | % White non-Hisp. | % Hispanic | % Black | % Asian | Median income* | % Bachelor's+ | % 18-29 (of adults) | % 65+ | % Homeowners | % Below poverty | % Spanish at home (adults) |
|---|---|---|---|---|---|---|---|---|---|---|---|---|---|
| Arlington Voting District | 393 | 321 | 81.8% | 2.4% | 8.2% | 1.3% | $84k | 21.5% | 9.8% | 28.9% | 63.0% | 5.9% | 2.0% |
| Bayou Phillip Voting District | 472 | 360 | 76.9% | 1.7% | 20.0% | 0.0% | $34k | 13.7% | 20.8% | 15.8% | 35.4% | 30.3% | 1.2% |
| Catahoula Voting District | 299 | 224 | 90.8% | 2.5% | 6.7% | 0.0% | $60k | 22.9% | 9.9% | 17.0% | 98.4% | 10.9% | 2.6% |
| City Hall Voting District | 1,667 | 1,311 | 51.6% | 4.8% | 40.1% | 0.0% | $18k | 37.6% | 12.8% | 22.6% | 70.4% | 37.0% | 4.7% |
| Courthouse Voting District | 630 | 535 | 74.2% | 1.6% | 10.7% | 4.1% | $37k | 47.4% | 14.0% | 50.4% | 70.7% | 15.9% | 0.0% |
| Crane Creek Voting District | 2,664 | 2,030 | 96.1% | 2.4% | 0.2% | 0.0% | $78k | 14.3% | 25.9% | 10.2% | 89.1% | 7.7% | 0.2% |
| Dedeaux Voting District | 1,137 | 884 | 87.2% | 10.2% | 0.1% | 0.0% | $66k | 14.9% | 15.3% | 17.0% | 86.0% | 21.5% | 0.8% |
| Diamondhead East Voting District | 7,616 | 6,224 | 85.0% | 3.6% | 3.0% | 1.8% | $89k | 46.4% | 15.7% | 28.7% | 88.4% | 6.2% | 2.6% |
| Diamondhead West Voting District | 2,194 | 1,806 | 81.3% | 11.9% | 3.1% | 0.6% | $68k | 27.3% | 16.4% | 25.6% | 88.9% | 10.4% | 3.8% |
| Edwardsville Voting District | 1,409 | 1,342 | 84.2% | 7.1% | 6.5% | 0.0% | $96k | 31.1% | 12.3% | 19.3% | 93.7% | 0.4% | 7.5% |
| Fenton Voting District | 1,807 | 1,455 | 89.1% | 8.0% | 0.2% | 0.0% | $77k | 11.4% | 10.3% | 25.7% | 85.9% | 18.3% | 0.7% |
| Flat Top Voting District | 1,758 | 1,328 | 95.3% | 0.6% | 1.5% | 0.0% | $57k | 11.3% | 24.0% | 13.4% | 82.1% | 21.4% | 0.6% |
| Garden Isle Voting District | 1,156 | 1,011 | 89.8% | 3.2% | 5.1% | 1.8% | $74k | 25.2% | 3.6% | 26.7% | 66.2% | 10.3% | 3.9% |
| Kiln East Voting District | 828 | 722 | 94.0% | 3.8% | 1.1% | 0.1% | $73k | 11.4% | 7.2% | 33.7% | 86.4% | 19.4% | 0.2% |
| Kiln West Voting District | 2,436 | 2,093 | 88.9% | 3.0% | 7.0% | 0.5% | $48k | 16.4% | 11.9% | 24.7% | 86.5% | 21.4% | 0.8% |
| Lakeshore Voting District | 4,707 | 3,408 | 81.1% | 1.5% | 10.3% | 0.4% | $86k | 15.5% | 19.0% | 15.7% | 72.5% | 13.4% | 0.6% |
| Leetown Voting District | 2,164 | 1,726 | 93.6% | 4.1% | 0.2% | 0.0% | $68k | 7.0% | 23.9% | 12.1% | 82.9% | 18.5% | 0.5% |
| North Bay East Voting District | 1,650 | 1,339 | 62.4% | 3.1% | 24.2% | 2.7% | $32k | 41.8% | 14.7% | 38.4% | 67.1% | 26.7% | 2.1% |
| North Bay West Voting District | 1,061 | 965 | 91.8% | 1.1% | 5.7% | 1.0% | $65k | 48.0% | 1.4% | 27.4% | 84.5% | 6.4% | 2.6% |
| Pearlington Voting District | 440 | 418 | 71.8% | 1.8% | 24.2% | 0.1% | $43k | 11.7% | 2.7% | 42.6% | 99.4% | 25.4% | 0.0% |
| South Bay Voting District | 2,138 | 1,881 | 81.3% | 7.3% | 0.6% | 0.2% | $82k | 43.2% | 12.0% | 27.1% | 85.6% | 4.4% | 0.2% |
| Standard Voting District | 1,349 | 1,044 | 90.8% | 7.0% | 1.4% | 0.0% | $53k | 15.7% | 17.4% | 15.1% | 91.4% | 25.5% | 0.8% |
| Waveland East Voting District | 1,720 | 1,346 | 69.9% | 5.1% | 14.2% | 2.5% | $64k | 19.9% | 16.7% | 24.5% | 66.8% | 5.1% | 1.7% |
| Waveland West Voting District | 3,103 | 2,420 | 80.7% | 4.0% | 7.2% | 3.3% | $78k | 27.5% | 13.2% | 16.4% | 65.7% | 7.9% | 3.3% |
| West Shoreline Park Voting District | 1,476 | 1,177 | 81.7% | 2.2% | 15.1% | 0.0% | $41k | 15.1% | 16.5% | 20.1% | 42.5% | 27.6% | 1.3% |
George: 22 precincts
| Precinct | Population | Voting-age pop. | % White non-Hisp. | % Hispanic | % Black | % Asian | Median income* | % Bachelor's+ | % 18-29 (of adults) | % 65+ | % Homeowners | % Below poverty | % Spanish at home (adults) |
|---|---|---|---|---|---|---|---|---|---|---|---|---|---|
| Agricola Voting District | 1,625 | 1,172 | 88.6% | 3.4% | 2.3% | 0.0% | $69k | 21.9% | 15.4% | 18.2% | 86.0% | 18.8% | 0.1% |
| Barton Voting District | 1,584 | 1,289 | 89.3% | 0.8% | 4.6% | 0.0% | $53k | 20.9% | 18.0% | 20.6% | 91.6% | 12.3% | 1.1% |
| Basin School Voting District | 1,556 | 1,204 | 90.5% | 0.9% | 4.1% | 0.0% | $52k | 19.9% | 17.0% | 19.9% | 90.0% | 12.1% | 1.0% |
| Benndale Crossing Voting District | 1,108 | 896 | 82.5% | 0.1% | 13.2% | 0.0% | $51k | 15.1% | 19.0% | 14.8% | 81.7% | 20.1% | 0.1% |
| Bexley School Voting District | 958 | 727 | 87.4% | 0.4% | 8.7% | 0.0% | $59k | 12.8% | 20.1% | 14.6% | 90.1% | 21.3% | 0.5% |
| Broom School Voting District | 1,110 | 779 | 99.6% | 0.0% | 0.2% | 0.0% | $42k | 18.0% | 16.5% | 16.5% | 83.3% | 18.3% | 0.0% |
| Central School Voting District | 598 | 414 | 91.7% | 5.9% | 0.0% | 0.0% | $86k | 18.5% | 12.1% | 6.0% | 85.1% | 16.7% | 0.2% |
| Courthouse Voting District | 1,135 | 855 | 57.8% | 0.9% | 36.1% | 0.0% | $50k | 10.6% | 23.7% | 6.2% | 61.4% | 41.1% | 0.2% |
| Davis School Voting District | 849 | 590 | 92.2% | 5.6% | 0.0% | 0.0% | $84k | 18.6% | 12.1% | 6.3% | 85.6% | 16.9% | 0.0% |
| Howell School Voting District | 1,033 | 637 | 78.0% | 7.1% | 4.6% | 0.0% | $84k | 24.5% | 8.5% | 22.3% | 78.8% | 15.9% | 0.0% |
| Lucedale City Hall Voting District | 1,857 | 1,369 | 75.4% | 0.4% | 19.0% | 0.0% | $51k | 13.8% | 20.5% | 15.0% | 76.0% | 29.4% | 0.1% |
| Lucedale Middle School Voting District | 966 | 736 | 62.9% | 0.6% | 26.6% | 0.0% | $42k | 17.9% | 21.5% | 17.2% | 66.7% | 30.6% | 0.4% |
| Movella Voting District | 860 | 637 | 89.7% | 3.1% | 2.0% | 0.0% | $62k | 23.0% | 16.5% | 18.8% | 85.3% | 19.7% | 0.0% |
| Multi-Mart Voting District | 421 | 289 | 78.1% | 10.2% | 4.5% | 1.7% | $57k | 18.9% | 21.0% | 11.5% | 84.9% | 24.3% | 0.0% |
| Multipurpose Bldg. Voting District | 547 | 403 | 90.4% | 5.9% | 2.6% | 0.0% | $67k | 34.2% | 37.9% | 12.4% | 73.6% | 12.2% | 5.0% |
| Pine Level Voting District | 979 | 757 | 97.4% | 0.4% | 0.5% | 0.0% | $78k | 15.4% | 18.0% | 10.9% | 96.7% | 19.4% | 0.5% |
| Rocky Creek Voting District | 2,559 | 1,900 | 88.1% | 5.2% | 3.2% | 0.4% | $62k | 12.5% | 30.4% | 16.8% | 85.3% | 12.0% | 1.0% |
| Salem School Voting District | 540 | 449 | 75.7% | 0.0% | 18.4% | 0.0% | $55k | 12.4% | 21.3% | 10.4% | 87.5% | 22.4% | 0.0% |
| Shady Grove Voting District | 1,831 | 1,146 | 87.0% | 5.8% | 1.8% | 0.0% | $59k | 12.9% | 20.3% | 12.7% | 62.5% | 11.2% | 9.0% |
| Shipman Voting District | 1,435 | 1,011 | 83.0% | 8.6% | 2.1% | 1.1% | $65k | 17.3% | 24.2% | 14.4% | 85.6% | 16.4% | 0.6% |
| Twin Creek Voting District | 666 | 494 | 88.1% | 6.0% | 4.3% | 0.0% | $62k | 37.0% | 40.9% | 13.7% | 70.2% | 12.2% | 5.6% |
| Ward Voting District | 973 | 731 | 94.5% | 1.1% | 2.3% | 0.1% | $86k | 13.3% | 17.5% | 9.2% | 97.1% | 19.5% | 0.6% |
Wayne: 22 precincts
| Precinct | Population | Voting-age pop. | % White non-Hisp. | % Hispanic | % Black | % Asian | Median income* | % Bachelor's+ | % 18-29 (of adults) | % 65+ | % Homeowners | % Below poverty | % Spanish at home (adults) |
|---|---|---|---|---|---|---|---|---|---|---|---|---|---|
| Beat 4 School Voting District | 880 | 682 | 83.3% | 0.0% | 16.4% | 0.0% | $51k | 26.0% | 18.5% | 17.8% | 88.6% | 13.9% | 0.0% |
| Big Rock Voting District | 536 | 410 | 45.3% | 0.0% | 49.0% | 0.0% | $39k | 19.8% | 20.2% | 23.0% | 96.3% | 24.3% | 0.0% |
| Buckatunna Voting District | 327 | 268 | 27.8% | 0.0% | 70.9% | 0.0% | $22k | 0.6% | 3.1% | 38.3% | 89.1% | 32.2% | 0.2% |
| Chaparral/Diamond Voting District | 349 | 267 | 41.1% | 0.0% | 52.1% | 0.0% | $36k | 17.5% | 18.9% | 24.0% | 96.8% | 22.8% | 0.0% |
| Chicora Voting District | 817 | 503 | 77.2% | 0.0% | 15.8% | 5.5% | $50k | 3.6% | 6.0% | 16.6% | 97.5% | 17.8% | 0.0% |
| Clara Voting District | 2,267 | 1,584 | 92.5% | 0.0% | 4.6% | 1.8% | $54k | 19.9% | 14.3% | 19.3% | 90.8% | 12.3% | 0.0% |
| Corinth Voting District | 574 | 406 | 93.4% | 0.0% | 3.8% | 1.6% | $60k | 9.5% | 15.7% | 17.7% | 99.7% | 17.1% | 0.0% |
| Denham Voting District | 1,481 | 1,295 | 52.3% | 0.0% | 43.7% | 0.2% | $40k | 14.9% | 17.4% | 20.0% | 85.9% | 30.4% | 0.0% |
| Eucutta Voting District | 746 | 556 | 47.3% | 0.0% | 52.0% | 0.0% | $36k | 9.0% | 30.8% | 18.0% | 95.4% | 27.4% | 0.2% |
| Hiwannee Voting District | 253 | 194 | 37.8% | 0.0% | 54.7% | 0.0% | $33k | 15.6% | 17.8% | 24.7% | 96.9% | 21.9% | 0.0% |
| Matherville/Coit Voting District | 319 | 249 | 26.4% | 0.0% | 63.6% | 0.0% | $26k | 9.7% | 14.3% | 26.7% | 97.0% | 18.5% | 0.0% |
| Mozingo Voting District | 562 | 413 | 97.7% | 0.5% | 1.0% | 0.0% | $52k | 28.8% | 17.7% | 21.7% | 85.6% | 8.6% | 0.3% |
| Pleasant Grove Voting District | 652 | 488 | 64.9% | 0.0% | 35.1% | 0.0% | $46k | 17.4% | 25.2% | 16.3% | 92.8% | 19.9% | 0.0% |
| State Line Voting District | 1,641 | 1,145 | 59.6% | 0.0% | 31.7% | 1.0% | $31k | 5.2% | 25.0% | 15.2% | 87.6% | 33.8% | 1.4% |
| Strengthford Voting District | 650 | 505 | 99.5% | 0.0% | 0.1% | 0.0% | $59k | 25.4% | 14.8% | 17.9% | 91.5% | 11.5% | 0.0% |
| Waynesboro 1 Voting District | 531 | 393 | 25.2% | 6.1% | 68.2% | 0.0% | $29k | 18.6% | 16.1% | 14.7% | 75.0% | 27.4% | 4.9% |
| Waynesboro 2 Voting District | 1,246 | 993 | 50.3% | 0.0% | 46.7% | 0.0% | $41k | 19.6% | 22.2% | 20.4% | 87.4% | 30.2% | 0.0% |
| Waynesboro 3 Voting District | 1,510 | 1,189 | 43.6% | 0.3% | 50.7% | 0.0% | $38k | 16.4% | 29.1% | 14.3% | 57.3% | 30.5% | 0.2% |
| Waynesboro 4 Voting District | 1,501 | 929 | 3.3% | 23.3% | 71.6% | 0.0% | $44k | 3.2% | 27.1% | 5.9% | 53.5% | 17.4% | 22.2% |
| Waynesboro 5 Voting District | 1,441 | 1,094 | 21.4% | 3.0% | 75.3% | 0.0% | $27k | 24.8% | 10.8% | 15.9% | 82.5% | 24.9% | 2.3% |
| Winchester Voting District | 759 | 670 | 53.6% | 0.0% | 41.6% | 0.2% | $41k | 13.7% | 16.4% | 19.8% | 85.9% | 31.0% | 0.0% |
| Yellow Creek Voting District | 662 | 560 | 85.8% | 0.0% | 10.6% | 0.0% | $39k | 26.2% | 15.4% | 29.4% | 85.7% | 19.3% | 0.8% |
Stone: 15 precincts
| Precinct | Population | Voting-age pop. | % White non-Hisp. | % Hispanic | % Black | % Asian | Median income* | % Bachelor's+ | % 18-29 (of adults) | % 65+ | % Homeowners | % Below poverty | % Spanish at home (adults) |
|---|---|---|---|---|---|---|---|---|---|---|---|---|---|
| American Legion Voting District | 878 | 698 | 74.1% | 2.8% | 19.7% | 0.6% | $64k | 15.4% | 12.1% | 18.1% | 78.4% | 17.5% | 1.0% |
| Big Level Voting District | 1,402 | 1,126 | 81.8% | 2.2% | 5.8% | 1.2% | $75k | 23.9% | 22.0% | 17.8% | 79.5% | 11.5% | 0.0% |
| Bond Voting District | 391 | 320 | 62.4% | 0.2% | 37.2% | 0.0% | $42k | 31.6% | 26.8% | 28.9% | 68.3% | 41.1% | 0.2% |
| Courthouse Voting District | 1,565 | 1,188 | 46.5% | 4.7% | 44.8% | 0.0% | $58k | 22.0% | 26.9% | 15.0% | 67.0% | 22.0% | 4.5% |
| Elarbee Voting District | 1,308 | 1,111 | 88.6% | 1.7% | 4.7% | 0.0% | $60k | 9.1% | 33.2% | 19.0% | 98.4% | 21.8% | 0.0% |
| Flint Creek Voting District | 1,270 | 988 | 62.5% | 2.7% | 26.5% | 1.0% | $49k | 23.3% | 22.8% | 19.9% | 75.9% | 28.0% | 0.8% |
| Magnolia Voting District | 603 | 465 | 77.0% | 0.6% | 20.3% | 0.5% | $59k | 13.9% | 12.3% | 20.4% | 89.1% | 16.5% | 0.0% |
| McHenry Fire Station Voting District | 1,221 | 893 | 92.6% | 0.7% | 4.3% | 0.0% | $96k | 16.6% | 21.3% | 18.1% | 85.9% | 10.2% | 0.9% |
| McHenry Library Voting District | 1,662 | 1,288 | 91.7% | 1.1% | 4.8% | 0.0% | $86k | 12.9% | 24.8% | 20.6% | 92.7% | 14.7% | 0.2% |
| New Hope Voting District | 1,193 | 921 | 35.6% | 0.0% | 64.4% | 0.0% | $34k | 7.8% | 19.6% | 15.8% | 91.3% | 22.1% | 0.0% |
| Old Hospital Voting District | 1,179 | 949 | 69.9% | 11.8% | 15.2% | 0.0% | $52k | 14.6% | 9.6% | 18.4% | 64.6% | 15.3% | 0.7% |
| Perkinston Voting District | 1,011 | 781 | 92.1% | 1.0% | 4.5% | 0.1% | $84k | 13.5% | 22.6% | 20.8% | 91.8% | 14.5% | 0.2% |
| Pleasant Hill Voting District | 837 | 650 | 80.6% | 4.4% | 0.0% | 5.7% | $88k | 22.9% | 26.9% | 17.0% | 73.4% | 6.0% | 0.0% |
| Ten Mile Voting District | 1,209 | 1,069 | 51.9% | 5.5% | 34.6% | 0.4% | $41k | 10.5% | 17.8% | 11.2% | 72.5% | 30.5% | 0.0% |
| Tuxachanie Voting District | 3,164 | 2,439 | 91.1% | 0.9% | 2.2% | 0.0% | $86k | 21.5% | 24.8% | 14.1% | 80.9% | 8.8% | 1.2% |
Greene: 13 precincts
| Precinct | Population | Voting-age pop. | % White non-Hisp. | % Hispanic | % Black | % Asian | Median income* | % Bachelor's+ | % 18-29 (of adults) | % 65+ | % Homeowners | % Below poverty | % Spanish at home (adults) |
|---|---|---|---|---|---|---|---|---|---|---|---|---|---|
| Jonathan Voting District | 795 | 653 | 71.0% | 1.2% | 25.0% | 0.0% | $60k | 9.4% | 20.3% | 11.7% | 81.0% | 19.2% | 0.8% |
| Jones Voting District | 283 | 208 | 100.0% | 0.0% | 0.0% | 0.0% | $75k | 10.2% | 20.5% | 20.5% | 88.2% | 19.1% | 0.0% |
| Leaf Voting District | 168 | 126 | 74.9% | 9.6% | 2.1% | 0.0% | $47k | 15.2% | 8.2% | 12.2% | 97.4% | 16.8% | 5.6% |
| Leakesville Voting District | 4,873 | 4,190 | 61.4% | 0.7% | 33.5% | 0.0% | $68k | 11.1% | 16.8% | 15.8% | 83.6% | 18.9% | 0.6% |
| Maples Voting District | 856 | 711 | 97.9% | 0.0% | 0.9% | 0.0% | $75k | 6.3% | 18.0% | 11.9% | 73.1% | 10.7% | 0.0% |
| McLain Voting District | 610 | 385 | 87.1% | 2.2% | 5.2% | 0.1% | $39k | 11.2% | 12.8% | 14.8% | 75.9% | 12.3% | 1.5% |
| Mutual Rights Voting District | 255 | 186 | 96.7% | 3.3% | 0.0% | 0.0% | $71k | 15.0% | 19.6% | 15.6% | 81.7% | 8.5% | 2.1% |
| North Leakesville Voting District | 1,344 | 1,245 | 49.8% | 0.6% | 45.3% | 0.1% | $58k | 7.1% | 18.0% | 9.5% | 74.6% | 31.6% | 0.5% |
| Piave Voting District | 573 | 425 | 95.9% | 0.3% | 3.6% | 0.0% | $73k | 10.5% | 20.2% | 19.8% | 86.4% | 18.8% | 0.2% |
| State Line Voting District | 1,599 | 1,294 | 55.0% | 0.1% | 43.1% | 0.0% | $53k | 8.5% | 17.4% | 17.3% | 74.8% | 26.5% | 0.1% |
| Vernal Voting District | 1,269 | 928 | 80.6% | 6.5% | 2.6% | 0.0% | $46k | 14.8% | 11.1% | 16.4% | 94.2% | 15.5% | 3.9% |
| Wade Voting District | 484 | 356 | 93.9% | 2.8% | 3.2% | 0.0% | $70k | 14.1% | 19.5% | 16.1% | 81.6% | 10.6% | 1.8% |
| Washington Voting District | 510 | 338 | 97.5% | 1.4% | 0.0% | 0.0% | $59k | 14.8% | 24.6% | 16.4% | 84.1% | 14.7% | 1.0% |
Perry: 15 precincts
| Precinct | Population | Voting-age pop. | % White non-Hisp. | % Hispanic | % Black | % Asian | Median income* | % Bachelor's+ | % 18-29 (of adults) | % 65+ | % Homeowners | % Below poverty | % Spanish at home (adults) |
|---|---|---|---|---|---|---|---|---|---|---|---|---|---|
| Arlington Voting District | 1,160 | 835 | 67.7% | 0.2% | 21.8% | 5.3% | $61k | 12.4% | 13.9% | 15.2% | 95.4% | 23.6% | 0.1% |
| Beaumont City Hall Voting District | 145 | 121 | 41.5% | 1.0% | 37.9% | 18.7% | $76k | 3.2% | 8.8% | 11.4% | 87.2% | 17.6% | 0.4% |
| Beaumont Library Voting District | 688 | 568 | 41.8% | 0.9% | 37.6% | 18.3% | $76k | 4.0% | 8.9% | 11.9% | 87.6% | 18.5% | 0.3% |
| Deep Creek Voting District | 136 | 117 | 83.4% | 4.3% | 2.5% | 0.1% | $58k | 17.4% | 7.9% | 50.1% | 90.8% | 0.1% | 0.5% |
| Hintonville Voting District | 582 | 414 | 86.7% | 0.0% | 8.5% | 0.0% | $57k | 17.7% | 19.1% | 18.5% | 95.7% | 16.0% | 0.0% |
| Holly Street Voting District | 2,178 | 1,701 | 84.6% | 2.0% | 11.3% | 0.0% | $51k | 19.0% | 15.6% | 24.7% | 74.3% | 14.3% | 1.6% |
| Indian Springs Voting District | 627 | 540 | 75.2% | 2.7% | 14.5% | 0.0% | $38k | 9.5% | 15.5% | 23.2% | 72.5% | 23.2% | 0.0% |
| Janice Voting District | 592 | 483 | 78.3% | 2.6% | 12.6% | 2.4% | $56k | 10.0% | 12.0% | 25.2% | 91.7% | 10.7% | 0.7% |
| McSwain Voting District | 499 | 369 | 88.6% | 0.0% | 9.7% | 0.0% | $65k | 14.9% | 30.7% | 14.5% | 90.6% | 14.3% | 0.0% |
| N.A. Courthouse Voting District | 869 | 697 | 75.5% | 2.4% | 17.5% | 0.3% | $39k | 9.7% | 16.5% | 15.5% | 82.2% | 22.4% | 0.6% |
| New Augusta Elementary Voting District | 875 | 631 | 73.6% | 1.8% | 19.5% | 0.8% | $42k | 14.6% | 23.6% | 12.6% | 83.1% | 26.0% | 0.4% |
| Prospect Voting District | 419 | 302 | 95.8% | 0.2% | 1.3% | 0.0% | $64k | 6.4% | 29.1% | 15.6% | 91.1% | 11.9% | 0.0% |
| Richton Multi-Purpose Voting District | 1,054 | 806 | 76.0% | 0.4% | 22.1% | 0.0% | $51k | 21.6% | 22.2% | 22.1% | 79.7% | 21.1% | 1.8% |
| Runnelstown Voting District | 1,459 | 1,219 | 84.5% | 5.3% | 7.3% | 0.0% | $50k | 8.1% | 16.3% | 19.1% | 62.4% | 19.6% | 0.7% |
| Thompson Hill Voting District | 187 | 154 | 82.7% | 3.1% | 8.0% | 0.4% | $55k | 12.4% | 11.1% | 32.5% | 91.9% | 7.5% | 0.7% |
*Median income is approximate (see note above). ACS 2020-2024 5-year.
Nonpartisan voter information. GOTV Polling does not endorse any candidate.