
Nebraska's 1st Congressional District
U.S. House · Nebraska · District 1 · General election: Tuesday, November 3, 2026
Candidates on the November 3 ballot
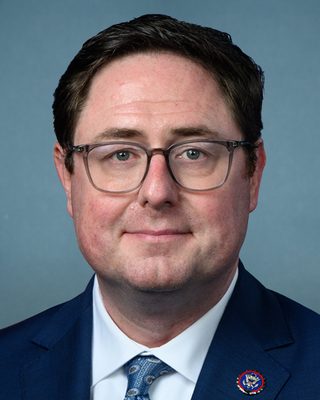 Mike FloodRepublicanIncumbentPhoto: U.S. Congress
- Chris BackemeyerDemocratic
- Nik SandmanLibertarian
- Dan HartongAmerica First
Source: Nebraska Secretary of State, Final Statewide General Candidate List, November 3, 2026 General Election, certified list (2026-09-11; retrieved 2026-10-30). Governor entries list the governor and lieutenant governor ticket as printed on the official list. Order of names does not reflect ballot order. Incumbent tags appear only where the official list marks incumbents. Photos come from the Candidate Alerts database where one is on file; otherwise initials are shown.
Federal campaign finance filings for this seat: FEC election page (FEC registration is not the same as ballot qualification).
Certified candidates
- Mike Flood RepublicanIncumbent @USRepMikeFlood
- Christopher Backemeyer Democratic
- Nik Sandman Libertarian
- Dan Hartong O
Certified candidate list from Candidate Alerts, as of 2026-09-24, based on Nebraska Secretary of State; certified. Includes candidates the database marks as on the November 3 ballot. Incumbent tags here follow the database.
Past election results
| Candidate | Party | Votes | Share |
|---|---|---|---|
| Mike Flood | Republican | 187,559 | 60.1% |
| Carol Blood | Democratic | 124,498 | 39.9% |
| Write-in | 130 | 0.0% | |
| Total | 312,187 |
Source: Douglas County Election Commission official results; Sarpy County Election Commission (Clarity ENR); Saunders County Election Office; Nebraska Secretary of State canvass book (county totals). Status: Official/certified county canvass results by precinct for the NE-02 counties (Douglas, Sarpy, Saunders); statewide county totals from the Nebraska Board of State Canvassers Official Report. Other counties: no precinct detail loaded.
| Candidate | Party | Votes | Share |
|---|---|---|---|
| Mike Flood | Republican | 129,236 | 57.8% |
| Patty Pansing Brooks | Democratic | 93,929 | 42.0% |
| Write-in | 257 | 0.1% | |
| Total | 223,422 |
Source: Douglas County Election Commission official results; Sarpy County Election Commission (Clarity ENR); Nebraska Secretary of State canvass book (county totals). Status: Official/certified county canvass results by precinct for the NE-02 counties (Douglas, Sarpy); statewide county totals from the Nebraska Board of State Canvassers Official Report. Other counties: no precinct detail loaded.
Held under the district lines in effect at the time. Those boundaries differ from the 2026 district.
| Candidate | Party | Votes | Share |
|---|---|---|---|
| Jeff Fortenberry | Republican | 27,295 | 60.6% |
| Kate Bolz | Democratic | 16,057 | 35.6% |
| Dennis B. Grace | Libertarian | 1,649 | 3.7% |
| Write-in | 52 | 0.1% | |
| Total | 45,053 |
Source: Douglas County Election Commission official results; Sarpy County Election Commission (Clarity ENR); Nebraska Secretary of State canvass book (county totals). Status: Official/certified county canvass results by precinct for the NE-02 counties (Douglas, Sarpy); statewide county totals from the Nebraska Board of State Canvassers Official Report. Other counties: no precinct detail loaded.
Certified results from state or county election authorities, as compiled in the Candidate Alerts precinct results database (public API candidatealerts.com/api/district-results). Totals are sums of certified precinct and county-level rows.
Demographics
2020 Census demographics by district are not yet published in this data set.
1 of 432 precincts are above 50%, and 21 are above 25%. Source: Census American Community Survey 2020-2024 5-year block groups, allocated to current precinct shapes by area.
Poll status
Map
Share of adults (18+) who speak Spanish at home, by precinct. Census ACS 2020-2024 5-year estimates on the current precinct layer. Hover a precinct for its value.
District shown in red: U.S. Census Bureau cartographic boundary file for the 119th Congress (cb_2024_us_cd119_500k). These are the lines in effect for 2026 in this state per the Candidate Alerts district registry.
Precinct map: past elections and demographics
Choose a layer above. Hover a precinct for its values.
Precinct results
Certified precinct results on current precinct shapes, grouped by county. 80 precincts. "(part)" marks a precinct only partly inside this district; its full vote is shown, so district sums are approximate and are not the official district total. Elections were held under older lines and are shown on the 2026 district.
| County | 2024 President | 2022 Governor | 2020 President | |||
|---|---|---|---|---|---|---|
| Margin | Votes | Margin | Votes | Margin | Votes | |
| Sarpy | R+6.8 | 71,415 | R+10.4 | 46,043 | R+7.8 | 74,375 |
| Douglas | D+10.2 | 4,055 | D+3.8 | 2,556 | D+8.5 | 5,410 |
| Stanton | - | - | R+66.0 | 2,467 | - | - |
| All counties (approx.) | R+5.9 | 75,470 | R+12.4 | 51,066 | R+6.7 | 79,785 |
Sarpy: 61 precincts
| Precinct | 2024 President | 2022 Governor | 2020 President | |||
|---|---|---|---|---|---|---|
| Margin | Votes | Margin | Votes | Margin | Votes | |
| Precinct 1 | D+10.6 | 1,127 | D+3.4 | 675 | D+7.7 | 1,196 |
| Precinct 10 | R+4.8 | 1,068 | R+9.7 | 660 | R+13.3 | 954 |
| Precinct 11 | R+6.8 | 1,227 | R+15.1 | 806 | R+10.4 | 2,124 |
| Precinct 12 | R+7.7 | 1,566 | R+8.6 | 1,037 | R+16.0 | 2,012 |
| Precinct 13 | R+9.5 | 1,797 | R+13.6 | 1,099 | R+5.6 | 1,739 |
| Precinct 14 | R+2.7 | 1,065 | R+6.0 | 696 | - | - |
| Precinct 15 | R+9.1 | 1,149 | R+13.0 | 767 | - | - |
| Precinct 16 | R+1.3 | 1,138 | D+1.8 | 668 | R+1.4 | 1,601 |
| Precinct 17 | R+3.1 | 1,162 | R+3.2 | 750 | R+7.7 | 1,585 |
| Precinct 18 | R+9.6 | 1,099 | R+12.3 | 715 | D+0.2 | 1,187 |
| Precinct 19 | R+5.9 | 1,498 | R+7.4 | 930 | R+12.7 | 2,671 |
| Precinct 2 | R+3.3 | 1,679 | R+9.1 | 1,232 | R+10.2 | 1,038 |
| Precinct 20 | R+19.0 | 1,428 | R+25.8 | 1,109 | D+3.7 | 1,872 |
| Precinct 21 | D+2.1 | 939 | R+7.7 | 627 | R+15.1 | 2,386 |
| Precinct 22 | R+15.2 | 989 | R+23.0 | 699 | D+0.1 | 1,652 |
| Precinct 23 (part) | D+3.3 | 1,625 | D+1.9 | 971 | R+15.7 | 2,587 |
| Precinct 24 | R+15.1 | 1,688 | R+21.8 | 1,237 | R+18.7 | 1,351 |
| Precinct 25 | - | - | - | - | R+2.3 | 1,397 |
| Precinct 26 | R+3.0 | 732 | R+9.9 | 453 | R+6.1 | 1,449 |
| Precinct 27 | R+4.9 | 1,457 | R+2.1 | 798 | - | - |
| Precinct 28 | R+0.1 | 1,281 | D+0.7 | 894 | - | - |
| Precinct 29 | R+9.4 | 998 | R+11.1 | 668 | - | - |
| Precinct 3 | R+0.8 | 1,536 | R+2.2 | 1,062 | D+2.4 | 1,773 |
| Precinct 30 | R+0.7 | 1,122 | R+6.0 | 722 | - | - |
| Precinct 31 | R+13.3 | 1,375 | R+14.0 | 922 | R+6.5 | 3,039 |
| Precinct 32 | R+0.1 | 804 | R+14.3 | 596 | R+9.3 | 1,305 |
| Precinct 33 | D+4.4 | 1,216 | D+1.1 | 742 | D+4.6 | 1,613 |
| Precinct 34 | D+2.3 | 1,343 | D+1.4 | 878 | R+0.4 | 1,798 |
| Precinct 35 | R+2.7 | 1,290 | R+4.5 | 875 | R+6.6 | 1,645 |
| Precinct 36 | R+12.7 | 1,138 | R+15.1 | 733 | R+21.5 | 1,543 |
| Precinct 37 | R+3.5 | 933 | R+7.7 | 624 | R+12.4 | 2,813 |
| Precinct 38 | R+15.1 | 1,209 | R+17.9 | 868 | R+5.8 | 1,541 |
| Precinct 39 | R+6.4 | 1,413 | R+13.3 | 1,073 | R+11.3 | 1,961 |
| Precinct 4 | R+0.5 | 1,481 | R+0.4 | 970 | R+4.0 | 1,385 |
| Precinct 40 | R+21.7 | 1,486 | R+29.4 | 1,077 | R+11.7 | 1,631 |
| Precinct 41 | R+17.1 | 1,014 | R+22.8 | 701 | R+13.0 | 2,205 |
| Precinct 42 | R+12.3 | 1,622 | R+14.6 | 1,120 | R+7.6 | 1,696 |
| Precinct 43 | R+9.5 | 1,617 | R+7.7 | 1,050 | - | - |
| Precinct 44 | R+13.5 | 1,420 | R+22.4 | 973 | - | - |
| Precinct 45 | R+8.8 | 1,196 | R+13.3 | 754 | - | - |
| Precinct 46 | D+5.7 | 1,340 | D+7.4 | 731 | - | - |
| Precinct 47 | R+13.7 | 1,046 | R+10.5 | 696 | - | - |
| Precinct 48 (part) | R+11.2 | 1,129 | R+7.9 | 746 | R+19.8 | 2,559 |
| Precinct 49 | D+0.8 | 1,084 | D+4.6 | 590 | - | - |
| Precinct 5 | D+1.0 | 1,261 | R+8.3 | 762 | R+0.8 | 1,210 |
| Precinct 50 (part) | R+12.1 | 1,044 | R+18.9 | 657 | - | - |
| Precinct 53 | R+2.0 | 1,149 | R+11.0 | 670 | - | - |
| Precinct 54 (part) | - | - | - | - | R+5.2 | 2,093 |
| Precinct 55 (part) | - | - | - | - | R+10.6 | 2,615 |
| Precinct 56 | - | - | - | - | R+12.2 | 1,610 |
| Precinct 57 | R+6.7 | 1,678 | R+7.0 | 791 | D+0.5 | 1,725 |
| Precinct 58 | R+11.8 | 1,387 | R+23.9 | 765 | - | - |
| Precinct 6 | D+1.1 | 1,393 | D+1.7 | 892 | D+3.3 | 1,440 |
| Precinct 62 | R+13.8 | 1,322 | R+17.5 | 663 | R+5.2 | 2,667 |
| Precinct 64 | R+14.2 | 1,311 | R+17.4 | 857 | - | - |
| Precinct 65 | R+14.3 | 1,111 | R+14.8 | 555 | - | - |
| Precinct 66 | R+37.1 | 612 | R+46.0 | 417 | - | - |
| Precinct 7 | R+0.2 | 1,159 | D+0.3 | 789 | R+9.4 | 1,278 |
| Precinct 70 | R+5.6 | 1,591 | R+9.5 | 962 | - | - |
| Precinct 8 | R+0.7 | 984 | R+6.4 | 700 | R+12.0 | 1,290 |
| Precinct 9 | R+15.3 | 887 | R+14.6 | 569 | R+4.4 | 1,139 |
Douglas: 9 precincts
| Precinct | 2024 President | 2022 Governor | 2020 President | |||
|---|---|---|---|---|---|---|
| Margin | Votes | Margin | Votes | Margin | Votes | |
| 04-10 (part) | - | - | - | - | D+46.1 | 912 |
| 04-11 (part) | - | - | - | - | D+11.2 | 1,101 |
| 04-12 (part) | - | - | - | - | D+0.7 | 1,129 |
| 04-14 (part) | D+33.7 | 915 | D+33.2 | 455 | - | - |
| 04-16 (part) | D+11.7 | 1,072 | D+2.7 | 677 | - | - |
| 04-17 (part) | D+0.0 | 1,052 | R+6.4 | 684 | - | - |
| 05-28 (part) | - | - | - | - | R+3.5 | 1,144 |
| 08-04 (part) | R+9.4 | 556 | R+11.1 | 407 | R+8.0 | 677 |
| 08-06 (part) | D+7.4 | 460 | D+5.1 | 333 | D+0.4 | 447 |
Stanton: 10 precincts
| Precinct | 2024 President | 2022 Governor | 2020 President | |||
|---|---|---|---|---|---|---|
| Margin | Votes | Margin | Votes | Margin | Votes | |
| BST | - | - | R+78.8 | 99 | - | - |
| DEW | - | - | R+80.2 | 86 | - | - |
| DMR | - | - | R+69.5 | 82 | - | - |
| ELK | - | - | R+80.4 | 107 | - | - |
| HMR | - | - | R+77.9 | 199 | - | - |
| PK | - | - | R+58.3 | 259 | - | - |
| SBE | - | - | R+81.3 | 75 | - | - |
| SBW | - | - | R+60.1 | 824 | - | - |
| STN | - | - | R+65.7 | 658 | - | - |
| UCB | - | - | R+55.1 | 78 | - | - |
2024 President (Kamala D. Harris vs. Donald J. Trump). Source: Douglas County Election Commission official results; Sarpy County Election Commission (Clarity ENR); Saunders County Election Office; Nebraska Secretary of State canvass book (county totals). Official/certified county canvass results by precinct for the NE-02 counties (Douglas, Sarpy, Saunders); statewide county totals from the Nebraska Board of State Canvassers Official Report. Other counties: no precinct detail loaded..
2022 Governor (Carol Blood vs. Jim Pillen). Source: Douglas County Election Commission official results; Sarpy County Election Commission (Clarity ENR); Nebraska Secretary of State canvass book (county totals). Official/certified county canvass results by precinct for the NE-02 counties (Douglas, Sarpy); statewide county totals from the Nebraska Board of State Canvassers Official Report. Other counties: no precinct detail loaded..
2020 President (Joseph R. Biden vs. Donald J. Trump). Source: Douglas County Election Commission official results; Sarpy County Election Commission (Clarity ENR); Nebraska Secretary of State canvass book (county totals). Official/certified county canvass results by precinct for the NE-02 counties (Douglas, Sarpy); statewide county totals from the Nebraska Board of State Canvassers Official Report. Other counties: no precinct detail loaded..
Precinct demographics
Demographics are Census American Community Survey (ACS) 2020-2024 5-year estimates for block groups, assigned to precincts by area share. They describe the resident population, not registered or likely voters, and include non-citizens. ACS margins of error are not shown; small precincts carry large error. Area weighting assumes people are spread evenly within each block group, so large rural precincts are the least reliable. Median income is a household-weighted average of block-group medians, an approximation.
| Area | Population | Voting-age pop. | % White non-Hisp. | % Hispanic | % Black | % Asian | Median income* | % Bachelor's+ | % 18-29 (of adults) | % 65+ | % Homeowners | % Below poverty | % Spanish at home (adults) |
|---|---|---|---|---|---|---|---|---|---|---|---|---|---|
| District | 669,695 | 510,353 | 76.5% | 12.4% | 3.3% | 2.7% | $84k | 35.9% | 24.5% | 15.7% | 64.3% | 10.0% | 7.3% |
| Lancaster (in district) | 324,026 | 251,494 | 77.8% | 8.5% | 3.7% | 4.1% | $81k | 41.8% | 28.3% | 15.3% | 58.9% | 11.9% | 4.4% |
| Sarpy (in district) | 144,528 | 109,037 | 72.9% | 13.8% | 4.8% | 2.6% | $100k | 39.5% | 23.0% | 13.7% | 65.7% | 6.2% | 7.8% |
| Dodge (in district) | 36,945 | 27,598 | 77.7% | 17.8% | 0.5% | 0.5% | $79k | 22.0% | 19.2% | 19.3% | 67.2% | 11.0% | 11.2% |
| Madison (in district) | 35,395 | 26,432 | 77.3% | 16.3% | 0.8% | 1.3% | $69k | 23.7% | 20.1% | 17.4% | 65.5% | 13.1% | 10.5% |
| Platte (in district) | 34,612 | 25,432 | 72.7% | 23.7% | 0.7% | 0.2% | $74k | 23.0% | 19.1% | 18.3% | 71.6% | 9.8% | 17.3% |
| Cass (in district) | 27,097 | 20,880 | 90.5% | 4.1% | 0.3% | 0.3% | $96k | 32.2% | 16.0% | 18.8% | 85.5% | 5.2% | 1.6% |
| Seward (in district) | 17,578 | 13,479 | 93.7% | 3.0% | 0.8% | 0.5% | $84k | 33.1% | 23.6% | 18.2% | 72.0% | 7.4% | 1.9% |
| Douglas (in district) | 12,732 | 8,790 | 36.8% | 48.0% | 11.0% | 1.1% | $79k | 13.7% | 21.8% | 9.4% | 72.3% | 17.2% | 33.9% |
| Colfax (in district) | 10,664 | 7,404 | 44.8% | 47.8% | 3.5% | 0.2% | $86k | 14.8% | 19.3% | 13.8% | 76.3% | 6.9% | 34.8% |
| Cuming (in district) | 8,929 | 6,689 | 85.2% | 12.4% | 0.4% | 0.3% | $72k | 24.9% | 16.3% | 21.6% | 68.9% | 6.7% | 8.7% |
| Butler (in district) | 8,425 | 6,408 | 89.9% | 6.3% | 0.3% | 0.0% | $84k | 24.0% | 15.4% | 20.9% | 79.9% | 9.7% | 4.3% |
| Stanton (in district) | 5,793 | 4,344 | 89.0% | 7.0% | 0.1% | 1.1% | $78k | 24.1% | 15.6% | 20.6% | 78.3% | 9.4% | 4.0% |
| Polk (in district) | 2,969 | 2,365 | 89.5% | 6.9% | 0.0% | 0.4% | $80k | 20.7% | 18.8% | 21.3% | 78.6% | 6.8% | 4.7% |
| Antelope (in district) | 2 | 2 | 94.1% | 1.6% | 0.5% | 1.1% | $73k | 13.6% | 20.9% | 25.5% | 82.7% | 14.9% | 0.6% |
Lancaster: 201 precincts
| Precinct | Population | Voting-age pop. | % White non-Hisp. | % Hispanic | % Black | % Asian | Median income* | % Bachelor's+ | % 18-29 (of adults) | % 65+ | % Homeowners | % Below poverty | % Spanish at home (adults) |
|---|---|---|---|---|---|---|---|---|---|---|---|---|---|
| 10A Precinct | 1,854 | 1,584 | 71.4% | 6.9% | 13.1% | 2.9% | $55k | 56.4% | 54.8% | 7.4% | 28.4% | 17.6% | 5.2% |
| 10B-1 Precinct | 1,204 | 887 | 65.6% | 5.7% | 25.6% | 0.0% | $59k | 39.8% | 31.1% | 10.6% | 28.1% | 17.6% | 3.1% |
| 10B-2 Precinct | 1,388 | 1,189 | 85.4% | 0.0% | 8.6% | 0.0% | $80k | 49.1% | 22.1% | 21.6% | 57.6% | 4.4% | 0.0% |
| 10B-4 Precinct | 1,667 | 1,298 | 92.5% | 3.7% | 3.7% | 0.0% | $87k | 52.2% | 25.3% | 19.2% | 72.2% | 6.6% | 1.8% |
| 10B-5 Precinct | 1,474 | 1,247 | 70.3% | 23.1% | 0.5% | 0.9% | $42k | 40.4% | 27.4% | 25.6% | 37.3% | 22.0% | 15.6% |
| 10C-12 Precinct | 737 | 599 | 91.0% | 5.0% | 0.7% | 0.6% | $110k | 52.7% | 10.1% | 37.5% | 73.7% | 3.3% | 4.2% |
| 10C-4 Precinct | 977 | 769 | 94.8% | 3.0% | 0.1% | 0.0% | $151k | 60.9% | 10.7% | 30.3% | 99.9% | 2.8% | 2.1% |
| 10C-5 Precinct | 1,165 | 870 | 95.5% | 1.2% | 0.3% | 3.0% | $82k | 49.7% | 16.6% | 13.9% | 88.3% | 17.6% | 0.7% |
| 10C-6 Precinct | 781 | 583 | 95.4% | 1.2% | 0.3% | 3.0% | $82k | 49.7% | 16.6% | 13.9% | 88.2% | 17.6% | 0.8% |
| 10C-7 Precinct | 870 | 733 | 77.7% | 11.5% | 3.3% | 0.0% | $39k | 40.1% | 7.9% | 34.7% | 55.8% | 7.3% | 6.0% |
| 10C-8 Precinct | 546 | 433 | 93.6% | 3.1% | 0.6% | 0.6% | $84k | 51.5% | 15.2% | 32.2% | 71.9% | 6.4% | 2.9% |
| 10D-1 Precinct | 776 | 662 | 87.5% | 9.7% | 0.0% | 0.0% | $68k | 57.2% | 32.2% | 12.4% | 79.5% | 9.0% | 5.1% |
| 10D-2 Precinct | 1,426 | 975 | 85.2% | 11.3% | 0.2% | 0.0% | $110k | 48.7% | 19.0% | 13.0% | 85.0% | 14.4% | 5.0% |
| 10D-3 Precinct | 634 | 464 | 61.2% | 2.1% | 4.1% | 3.3% | $84k | 30.0% | 17.9% | 14.4% | 51.3% | 3.3% | 0.0% |
| 10D-4 Precinct | 922 | 766 | 76.5% | 11.5% | 0.3% | 0.7% | $72k | 42.0% | 33.1% | 16.0% | 83.9% | 6.0% | 13.3% |
| 10D-8 Precinct | 1,227 | 1,080 | 75.2% | 10.2% | 7.9% | 5.2% | $51k | 34.7% | 21.2% | 31.3% | 83.7% | 6.5% | 1.0% |
| 10E-1 Precinct | 1,003 | 882 | 93.2% | 4.8% | 0.6% | 0.1% | $99k | 43.0% | 18.8% | 34.0% | 71.7% | 6.3% | 1.0% |
| 10E-10 Precinct | 926 | 784 | 89.8% | 6.1% | 0.7% | 1.8% | $114k | 49.8% | 25.2% | 19.7% | 93.8% | 5.3% | 1.8% |
| 10E-11 Precinct | 913 | 686 | 78.0% | 7.0% | 2.5% | 3.0% | $87k | 47.1% | 16.0% | 22.7% | 91.5% | 4.5% | 2.6% |
| 10E-12 Precinct | 1,899 | 1,714 | 79.8% | 11.2% | 4.7% | 0.7% | $68k | 42.4% | 40.5% | 19.8% | 39.3% | 5.2% | 2.5% |
| 10E-14 Precinct | 682 | 513 | 78.3% | 6.2% | 2.3% | 4.3% | $91k | 50.3% | 14.5% | 22.8% | 91.9% | 3.8% | 2.8% |
| 10E-15 Precinct | 2,120 | 1,648 | 92.3% | 2.1% | 0.4% | 3.8% | $123k | 66.0% | 17.2% | 21.4% | 74.5% | 1.3% | 2.2% |
| 10E-16 Precinct | 1,607 | 1,121 | 85.1% | 3.1% | 1.3% | 6.3% | $148k | 67.2% | 11.3% | 16.2% | 91.4% | 1.5% | 1.3% |
| 10E-17 Precinct | 1,039 | 722 | 84.7% | 3.2% | 1.3% | 6.6% | $149k | 67.2% | 10.6% | 16.4% | 93.6% | 1.6% | 1.2% |
| 10E-4 Precinct | 1,579 | 1,326 | 78.1% | 10.4% | 0.1% | 1.7% | $73k | 46.0% | 23.8% | 20.5% | 75.3% | 16.0% | 0.0% |
| 10E-5 Precinct | 1,775 | 1,362 | 73.2% | 12.2% | 0.2% | 5.4% | $50k | 40.1% | 33.9% | 11.3% | 46.9% | 25.6% | 4.9% |
| 10E-7 Precinct | 1,948 | 1,356 | 84.6% | 1.8% | 6.8% | 0.6% | $78k | 27.5% | 21.4% | 13.7% | 51.8% | 8.4% | 0.9% |
| 10E-8 Precinct | 1,202 | 920 | 74.3% | 10.7% | 0.8% | 1.1% | $58k | 40.1% | 17.3% | 25.6% | 54.5% | 9.9% | 0.0% |
| 10F-1 Precinct | 1,134 | 866 | 72.8% | 9.6% | 1.5% | 6.5% | $58k | 34.0% | 22.0% | 18.9% | 64.1% | 13.8% | 0.7% |
| 10F-10 Precinct | 1,016 | 759 | 82.9% | 11.7% | 1.2% | 1.1% | $86k | 57.2% | 17.0% | 32.7% | 66.9% | 17.5% | 3.1% |
| 10F-11 Precinct | 1,173 | 982 | 77.5% | 13.6% | 1.3% | 5.0% | $81k | 56.5% | 27.1% | 22.1% | 38.7% | 7.6% | 4.7% |
| 10F-12 Precinct | 1,465 | 1,289 | 91.7% | 4.8% | 0.0% | 1.9% | $50k | 40.3% | 15.6% | 42.5% | 44.7% | 9.0% | 2.8% |
| 10F-14 Precinct | 1,226 | 938 | 68.6% | 9.0% | 0.7% | 11.4% | $126k | 58.3% | 11.8% | 25.2% | 94.6% | 0.6% | 6.1% |
| 10F-15 Precinct | 1,153 | 888 | 85.2% | 1.3% | 0.0% | 2.8% | $83k | 77.3% | 10.0% | 26.8% | 55.4% | 2.0% | 0.1% |
| 10F-16P Precinct | 943 | 721 | 88.3% | 3.7% | 0.6% | 2.3% | $132k | 66.6% | 12.3% | 28.4% | 89.7% | 2.9% | 2.3% |
| 10F-2 Precinct | 1,171 | 935 | 74.1% | 2.4% | 3.7% | 7.3% | $50k | 33.5% | 26.7% | 23.1% | 64.5% | 12.3% | 1.0% |
| 10F-3 Precinct | 947 | 708 | 75.5% | 18.4% | 0.8% | 4.4% | $114k | 64.1% | 7.1% | 19.7% | 91.5% | 6.1% | 2.9% |
| 10F-4 Precinct | 1,086 | 819 | 61.7% | 9.5% | 1.8% | 12.6% | $103k | 39.9% | 24.3% | 11.7% | 90.5% | 1.6% | 7.8% |
| 10F-5 Precinct | 1,037 | 929 | 93.0% | 2.8% | 1.3% | 1.4% | $89k | 53.7% | 13.5% | 32.1% | 82.8% | 4.6% | 2.8% |
| 10F-6 Precinct | 1,269 | 868 | 82.5% | 3.2% | 0.0% | 7.8% | $88k | 51.1% | 4.5% | 28.2% | 87.1% | 20.3% | 3.0% |
| 10F-7 Precinct | 1,235 | 1,028 | 87.8% | 6.3% | 1.3% | 1.3% | $69k | 44.7% | 11.3% | 42.8% | 52.3% | 4.9% | 5.7% |
| 10G-1 Precinct | 1,015 | 941 | 86.2% | 6.4% | 3.9% | 0.1% | $83k | 43.7% | 5.1% | 59.5% | 44.0% | 20.6% | 4.1% |
| 10G-2 Precinct | 553 | 431 | 80.5% | 2.9% | 0.0% | 6.0% | $118k | 51.4% | 20.7% | 18.9% | 92.5% | 1.9% | 2.3% |
| 10G-3 Precinct | 1,916 | 1,566 | 83.7% | 5.9% | 1.8% | 3.1% | $85k | 41.0% | 18.5% | 20.9% | 83.6% | 5.9% | 1.8% |
| 10G-4 Precinct | 1,378 | 1,160 | 80.8% | 5.6% | 2.3% | 6.0% | $87k | 43.4% | 19.8% | 23.3% | 75.6% | 5.5% | 2.1% |
| 10G-5 Precinct | 699 | 478 | 97.0% | 0.2% | 0.1% | 0.1% | $119k | 55.9% | 10.9% | 16.7% | 98.6% | 0.4% | 0.3% |
| 10G-6 Precinct | 1,527 | 1,323 | 76.6% | 13.1% | 6.7% | 1.8% | $88k | 55.3% | 25.4% | 25.5% | 54.0% | 6.4% | 1.0% |
| 10G-7 Precinct | 845 | 600 | 80.1% | 6.5% | 0.5% | 7.0% | $80k | 51.9% | 7.4% | 32.5% | 76.2% | 23.3% | 3.6% |
| 10H-1 Precinct | 913 | 779 | 90.0% | 1.4% | 0.2% | 2.4% | $109k | 64.3% | 9.5% | 43.4% | 76.1% | 2.0% | 0.6% |
| 10H-2 Precinct | 1,465 | 1,133 | 91.7% | 3.0% | 0.0% | 4.5% | $164k | 71.9% | 6.6% | 31.4% | 93.8% | 0.3% | 1.0% |
| 10H-3 Precinct | 2,532 | 1,896 | 81.8% | 2.9% | 1.6% | 6.0% | $108k | 55.3% | 10.2% | 18.1% | 72.6% | 3.8% | 2.8% |
| 10H-4 Precinct | 1,894 | 1,492 | 85.7% | 5.9% | 0.2% | 5.8% | $87k | 55.5% | 30.2% | 18.6% | 55.1% | 3.3% | 3.1% |
| 10H-5 Precinct | 2,896 | 1,846 | 92.3% | 3.2% | 0.1% | 1.7% | $120k | 51.5% | 11.6% | 11.5% | 92.9% | 8.0% | 3.8% |
| 10H-6 Precinct | 1,345 | 1,014 | 74.0% | 7.1% | 1.1% | 4.8% | $111k | 67.1% | 11.4% | 21.2% | 81.5% | 4.2% | 4.2% |
| 10H-7 Precinct | 1,139 | 848 | 82.0% | 2.7% | 1.4% | 6.4% | $109k | 56.3% | 10.6% | 18.1% | 73.6% | 3.7% | 2.5% |
| 10H-8 Precinct | 889 | 688 | 90.2% | 4.3% | 0.3% | 3.6% | $96k | 61.0% | 27.9% | 16.7% | 54.2% | 3.2% | 2.2% |
| 11A-1 Precinct | 1,476 | 1,187 | 53.3% | 18.6% | 4.4% | 7.3% | $42k | 29.1% | 41.9% | 7.6% | 22.2% | 20.0% | 14.4% |
| 11A-2 Precinct | 2,840 | 2,061 | 61.1% | 7.3% | 2.8% | 6.3% | $56k | 29.5% | 28.8% | 9.2% | 25.0% | 19.8% | 6.0% |
| 11B-1 Precinct | 1,824 | 1,479 | 72.8% | 8.8% | 6.5% | 10.4% | $60k | 26.1% | 36.3% | 13.7% | 47.8% | 10.9% | 5.3% |
| 11C Precinct | 563 | 482 | 88.4% | 6.8% | 0.8% | 0.0% | $26k | 40.6% | 67.8% | 7.6% | 20.3% | 43.0% | 3.2% |
| 11D-2 Precinct | 1,368 | 1,173 | 88.3% | 6.9% | 0.8% | 0.0% | $26k | 40.9% | 68.1% | 7.5% | 19.8% | 43.7% | 3.2% |
| 11E-1 Precinct | 1,271 | 1,100 | 76.8% | 4.1% | 9.9% | 6.1% | $78k | 23.7% | 31.0% | 20.7% | 76.9% | 11.6% | 0.3% |
| 11E-10 Precinct | 878 | 629 | 87.4% | 6.4% | 2.2% | 0.7% | $87k | 32.1% | 26.5% | 15.8% | 82.9% | 11.6% | 1.3% |
| 11E-3 Precinct | 2,265 | 1,833 | 70.8% | 8.7% | 2.7% | 5.0% | $66k | 29.0% | 43.4% | 8.3% | 10.0% | 11.1% | 3.4% |
| 11E-5 Precinct | 1,190 | 854 | 87.1% | 7.1% | 1.6% | 0.5% | $88k | 29.1% | 28.2% | 16.7% | 82.3% | 12.2% | 1.8% |
| 11E-6 Precinct | 2,700 | 2,418 | 79.0% | 4.4% | 5.8% | 3.1% | $58k | 27.6% | 48.2% | 13.4% | 22.6% | 9.0% | 1.9% |
| 11E-7 Precinct | 1,121 | 1,035 | 75.8% | 9.0% | 3.6% | 7.0% | $35k | 40.5% | 45.4% | 13.4% | 63.3% | 28.7% | 1.2% |
| 11E-9 Precinct | 647 | 590 | 74.0% | 7.2% | 1.6% | 10.7% | $75k | 38.0% | 52.2% | 7.7% | 17.1% | 11.8% | 5.2% |
| 12A-10 Precinct | 1,996 | 1,702 | 71.1% | 9.2% | 3.9% | 7.7% | $79k | 47.7% | 32.5% | 19.3% | 55.2% | 10.8% | 4.3% |
| 12A-4 Precinct | 2,295 | 1,757 | 88.9% | 4.5% | 3.3% | 0.3% | $69k | 29.2% | 26.7% | 14.5% | 69.3% | 10.8% | 5.8% |
| 12A-5 Precinct | 1,172 | 940 | 87.6% | 4.0% | 3.1% | 0.4% | $71k | 34.3% | 26.9% | 17.5% | 78.1% | 2.5% | 0.2% |
| 12A-7 Precinct | 1,310 | 1,036 | 84.1% | 12.4% | 0.4% | 0.7% | $109k | 39.2% | 17.0% | 22.9% | 83.1% | 1.5% | 6.5% |
| 12A-8 Precinct | 997 | 815 | 86.6% | 10.5% | 0.6% | 0.5% | $133k | 45.9% | 10.5% | 29.2% | 97.9% | 0.2% | 1.4% |
| 12A-9 Precinct | 1,237 | 835 | 91.4% | 0.0% | 0.0% | 1.1% | $86k | 50.4% | 22.2% | 11.8% | 78.0% | 3.8% | 0.5% |
| 12B-1 Precinct | 1,331 | 1,167 | 81.9% | 7.2% | 4.4% | 2.9% | $70k | 26.9% | 33.5% | 18.4% | 70.9% | 3.7% | 1.6% |
| 12B-2 Precinct | 1,293 | 970 | 82.7% | 10.9% | 1.2% | 3.9% | $86k | 33.3% | 29.5% | 16.4% | 72.3% | 3.2% | 5.7% |
| 12B-4 Precinct | 781 | 702 | 82.0% | 10.4% | 0.1% | 7.5% | $58k | 27.5% | 30.9% | 26.5% | 73.4% | 1.1% | 6.2% |
| 12B-6 Precinct | 1,755 | 857 | 83.3% | 14.2% | 1.4% | 0.0% | $88k | 39.3% | 13.4% | 9.1% | 92.0% | 4.0% | 3.7% |
| 12B-7 Precinct | 1,245 | 1,006 | 77.6% | 14.1% | 0.0% | 8.3% | $60k | 31.5% | 27.8% | 11.9% | 55.0% | 11.8% | 5.7% |
| 12B-8 Precinct | 2,038 | 1,506 | 86.9% | 3.9% | 1.3% | 4.9% | $129k | 55.6% | 17.5% | 17.4% | 87.1% | 3.7% | 0.6% |
| 12C-2 Precinct | 1,746 | 1,483 | 83.7% | 6.6% | 0.2% | 0.0% | $48k | 30.5% | 17.9% | 32.0% | 58.9% | 11.9% | 3.5% |
| 12C-6 Precinct | 1,877 | 1,359 | 79.5% | 14.0% | 3.4% | 0.4% | $65k | 22.5% | 17.8% | 12.3% | 69.9% | 8.5% | 6.9% |
| 12C-7 Precinct | 2,271 | 1,700 | 83.3% | 11.2% | 0.0% | 0.0% | $59k | 22.3% | 38.5% | 13.6% | 57.7% | 12.3% | 4.8% |
| 12D Precinct | 2,234 | 1,795 | 78.5% | 13.9% | 3.0% | 0.8% | $43k | 24.1% | 30.9% | 20.7% | 38.8% | 17.5% | 6.0% |
| 12F Precinct | 1,397 | 1,119 | 74.2% | 20.8% | 3.2% | 1.2% | $41k | 27.6% | 24.1% | 20.9% | 53.1% | 13.9% | 2.8% |
| 12G-1 Precinct | 1,010 | 819 | 53.1% | 9.6% | 7.4% | 18.7% | $71k | 53.5% | 44.0% | 4.3% | 2.2% | 19.5% | 4.1% |
| 12G-2 Precinct | 1,612 | 1,308 | 62.6% | 7.1% | 8.8% | 13.5% | $71k | 53.5% | 46.3% | 5.7% | 12.0% | 16.8% | 2.7% |
| 1A Precinct | 3,904 | 3,206 | 64.9% | 10.8% | 7.8% | 6.5% | $60k | 35.0% | 50.4% | 7.4% | 31.9% | 21.4% | 5.5% |
| 1A-1 Precinct | 2,726 | 2,423 | 89.2% | 4.5% | 1.5% | 2.9% | $69k | 54.2% | 50.2% | 8.9% | 38.5% | 20.4% | 2.5% |
| 1B Precinct | 3,371 | 3,226 | 69.5% | 10.6% | 11.8% | 3.5% | $38k | 33.0% | 76.9% | 3.9% | 11.6% | 47.7% | 7.2% |
| 1D-1 Precinct | 2,041 | 1,609 | 67.1% | 11.3% | 10.0% | 7.6% | $51k | 16.0% | 28.6% | 12.7% | 51.9% | 16.4% | 10.6% |
| 1D-10 Precinct | 3,279 | 2,214 | 58.8% | 9.3% | 8.6% | 15.2% | $117k | 47.5% | 26.7% | 4.3% | 88.2% | 10.1% | 1.5% |
| 1D-2 Precinct | 3,474 | 2,708 | 56.7% | 19.5% | 3.5% | 10.2% | $53k | 25.6% | 35.0% | 13.2% | 51.4% | 16.3% | 8.5% |
| 1D-4 Precinct | 1,512 | 1,173 | 80.7% | 1.7% | 2.2% | 11.8% | $65k | 40.8% | 21.9% | 26.5% | 59.0% | 8.5% | 0.2% |
| 1D-5 Precinct | 1,411 | 1,059 | 49.9% | 29.2% | 5.4% | 3.7% | $54k | 28.9% | 31.3% | 10.7% | 55.7% | 13.8% | 5.9% |
| 1D-6 Precinct | 2,445 | 1,811 | 65.2% | 8.8% | 5.7% | 12.3% | $58k | 28.1% | 26.5% | 11.2% | 56.3% | 22.3% | 5.3% |
| 1D-7 Precinct | 962 | 755 | 77.8% | 5.2% | 2.6% | 11.4% | $83k | 32.1% | 34.2% | 19.2% | 83.5% | 16.0% | 1.4% |
| 1D-8 Precinct | 1,562 | 1,248 | 84.2% | 8.9% | 1.4% | 4.4% | $84k | 26.7% | 26.0% | 26.8% | 91.4% | 11.5% | 2.6% |
| 1D-9 Precinct | 2,322 | 1,955 | 80.5% | 3.5% | 2.4% | 10.9% | $65k | 42.9% | 29.8% | 23.1% | 62.1% | 13.2% | 0.3% |
| 1E-2 Precinct | 3,270 | 2,319 | 72.7% | 14.4% | 1.2% | 3.1% | $49k | 16.5% | 28.1% | 9.0% | 36.0% | 26.7% | 15.3% |
| 1E-3 Precinct | 1,963 | 1,489 | 52.0% | 36.6% | 0.9% | 10.3% | $84k | 20.1% | 26.7% | 10.5% | 56.9% | 9.1% | 16.8% |
| 1E-4 Precinct | 1,082 | 883 | 92.2% | 1.3% | 0.3% | 3.7% | $128k | 47.3% | 14.5% | 9.7% | 89.0% | 3.8% | 0.0% |
| 1E-5 Precinct | 409 | 308 | 84.0% | 0.3% | 4.7% | 1.9% | $70k | 50.4% | 31.6% | 6.5% | 47.6% | 7.2% | 0.0% |
| 1E-6 Precinct | 1,939 | 1,161 | 84.3% | 0.5% | 6.4% | 0.6% | $93k | 51.4% | 18.6% | 3.6% | 75.7% | 0.7% | 0.0% |
| 1E-7 Precinct | 2,969 | 2,169 | 54.7% | 33.8% | 3.6% | 2.4% | $58k | 15.9% | 24.9% | 9.5% | 53.6% | 10.6% | 20.9% |
| 1E-8 Precinct | 1,923 | 1,363 | 83.4% | 0.2% | 5.6% | 1.4% | $70k | 51.0% | 30.4% | 5.5% | 50.0% | 5.9% | 0.0% |
| 1E-9 Precinct | 1,095 | 830 | 91.1% | 2.0% | 0.5% | 3.8% | $149k | 56.5% | 20.9% | 7.6% | 70.0% | 10.8% | 0.2% |
| 1F-1 Precinct | 1,810 | 1,245 | 65.9% | 17.8% | 8.5% | 0.4% | $66k | 25.2% | 33.9% | 6.1% | 31.0% | 22.6% | 12.2% |
| 1F-2 Precinct | 2,309 | 1,604 | 65.3% | 16.7% | 5.4% | 3.0% | $97k | 28.6% | 34.0% | 4.6% | 79.0% | 7.7% | 8.9% |
| 1F-3 Precinct | 1,749 | 1,224 | 65.8% | 16.6% | 5.5% | 3.3% | $102k | 30.5% | 35.3% | 4.2% | 87.4% | 7.1% | 10.1% |
| 2A Precinct | 3,377 | 2,761 | 62.2% | 27.0% | 2.4% | 2.4% | $39k | 26.2% | 45.6% | 6.9% | 29.8% | 31.6% | 11.6% |
| 2C-1 Precinct | 1,884 | 1,527 | 76.2% | 8.8% | 6.6% | 3.3% | $57k | 27.2% | 49.2% | 6.7% | 44.5% | 19.9% | 2.1% |
| 2C-2 Precinct | 1,212 | 824 | 65.4% | 16.6% | 5.4% | 0.0% | $59k | 19.1% | 14.0% | 12.1% | 84.6% | 0.9% | 2.9% |
| 2C-3 Precinct | 1,192 | 903 | 73.8% | 10.3% | 6.9% | 3.8% | $90k | 25.7% | 28.6% | 13.3% | 67.7% | 8.8% | 4.3% |
| 2D-1 Precinct | 2,977 | 2,361 | 63.5% | 13.1% | 10.5% | 3.1% | $98k | 18.9% | 25.1% | 7.1% | 73.9% | 13.6% | 9.0% |
| 2D-2 Precinct | 2,382 | 1,543 | 81.5% | 0.4% | 13.3% | 0.0% | $61k | 38.8% | 17.5% | 5.7% | 90.4% | 2.5% | 0.6% |
| 2D-3 Precinct | 796 | 628 | 68.4% | 12.7% | 5.2% | 9.4% | $99k | 38.7% | 26.8% | 6.8% | 91.1% | 5.4% | 10.1% |
| 2D-5 Precinct | 3 | 2 | 80.8% | 3.7% | 0.0% | 14.4% | $107k | 40.5% | 13.6% | 11.8% | 82.5% | 1.8% | 4.0% |
| 3A Precinct | 4,500 | 3,934 | 52.7% | 15.5% | 10.0% | 15.3% | $46k | 40.0% | 63.1% | 10.9% | 19.2% | 38.7% | 7.0% |
| 3D Precinct | 5,942 | 5,684 | 77.3% | 8.2% | 4.9% | 5.4% | $52k | 23.6% | 83.9% | 2.2% | 16.8% | 43.1% | 3.7% |
| 4A Precinct | 2,980 | 2,853 | 67.1% | 17.4% | 3.8% | 7.7% | $29k | 24.7% | 46.2% | 13.9% | 7.1% | 31.6% | 12.1% |
| 5B-1 Precinct | 3,063 | 2,591 | 59.0% | 26.4% | 4.9% | 6.4% | $34k | 37.2% | 45.4% | 7.2% | 5.5% | 40.1% | 16.2% |
| 5C-1 Precinct | 1,710 | 1,205 | 50.4% | 30.0% | 6.3% | 1.1% | $74k | 15.2% | 29.0% | 7.4% | 57.2% | 5.5% | 14.4% |
| 5C-3 Precinct | 2,000 | 1,328 | 66.9% | 6.0% | 11.1% | 7.6% | $58k | 30.3% | 19.3% | 16.4% | 40.5% | 11.9% | 8.4% |
| 5E-3 Precinct | 1,261 | 971 | 88.8% | 4.2% | 3.3% | 1.5% | $111k | 28.5% | 28.9% | 12.7% | 86.8% | 4.4% | 1.4% |
| 5E-4 Precinct | 671 | 552 | 85.7% | 7.2% | 2.2% | 3.0% | $93k | 42.9% | 29.3% | 17.1% | 58.6% | 4.6% | 1.3% |
| 5E-5 Precinct | 447 | 357 | 90.7% | 0.0% | 1.2% | 6.5% | $116k | 64.6% | 15.0% | 21.6% | 74.5% | 7.1% | 0.5% |
| 5E-6 Precinct | 1,986 | 1,535 | 80.4% | 4.3% | 2.7% | 10.3% | $95k | 57.5% | 24.8% | 15.1% | 49.3% | 11.7% | 1.5% |
| 5E-7 Precinct | 1,955 | 1,464 | 75.5% | 6.5% | 3.2% | 12.5% | $91k | 54.2% | 30.0% | 10.7% | 37.0% | 11.8% | 2.2% |
| 5E-8 Precinct | 1,670 | 1,227 | 85.7% | 2.6% | 1.3% | 9.8% | $138k | 64.0% | 20.0% | 13.9% | 65.0% | 0.9% | 1.6% |
| 5E-9 Precinct | 92 | 74 | 91.8% | 1.8% | 0.2% | 2.6% | $163k | 65.1% | 4.6% | 31.9% | 77.7% | 3.8% | 1.5% |
| 6A-1 Precinct | 2,130 | 1,809 | 57.1% | 17.6% | 12.2% | 4.7% | $34k | 36.5% | 35.4% | 19.1% | 12.6% | 20.8% | 7.2% |
| 6D-2 Precinct | 2,350 | 1,834 | 64.9% | 1.5% | 8.9% | 5.4% | $39k | 31.4% | 32.1% | 9.4% | 23.4% | 30.0% | 1.9% |
| 6E-1 Precinct | 1,057 | 880 | 86.8% | 1.9% | 4.5% | 1.1% | $79k | 51.8% | 14.6% | 30.4% | 75.1% | 9.7% | 0.2% |
| 6E-2 Precinct | 873 | 702 | 90.0% | 0.0% | 1.1% | 0.0% | $79k | 47.2% | 21.0% | 19.1% | 75.2% | 10.0% | 1.4% |
| 6F-1 Precinct | 3,181 | 2,828 | 70.2% | 5.2% | 13.1% | 0.4% | $63k | 21.0% | 28.5% | 11.0% | 61.9% | 9.4% | 5.4% |
| 7A Precinct | 4,185 | 3,012 | 64.9% | 8.2% | 9.2% | 7.0% | $54k | 34.6% | 32.8% | 7.2% | 48.9% | 20.4% | 4.8% |
| 7D-2 Precinct | 2,951 | 2,160 | 57.4% | 18.5% | 16.2% | 2.1% | $64k | 40.0% | 36.4% | 8.9% | 55.7% | 23.4% | 14.4% |
| 8A Precinct | 3,105 | 2,470 | 60.2% | 20.6% | 6.2% | 6.3% | $34k | 27.7% | 48.4% | 7.6% | 19.6% | 39.6% | 10.3% |
| 8C-2 Precinct | 2,536 | 1,718 | 53.3% | 14.7% | 20.7% | 3.8% | $56k | 31.3% | 27.4% | 4.7% | 46.6% | 26.6% | 12.8% |
| 9A-1 Precinct | 902 | 592 | 63.7% | 19.0% | 2.4% | 2.3% | $42k | 34.4% | 30.0% | 7.4% | 35.8% | 29.2% | 12.0% |
| 9B-1 Precinct | 1,158 | 971 | 82.5% | 8.4% | 0.0% | 0.3% | $55k | 36.8% | 20.4% | 17.7% | 61.2% | 24.8% | 10.8% |
| 9C-1 Precinct | 2,001 | 1,565 | 65.8% | 4.9% | 4.8% | 11.3% | $65k | 41.1% | 31.4% | 8.0% | 56.8% | 10.3% | 2.5% |
| 9D-1 Precinct | 861 | 783 | 87.7% | 4.1% | 5.8% | 0.1% | $59k | 49.0% | 30.1% | 16.6% | 67.3% | 9.2% | 4.5% |
| 9E-1 Precinct | 920 | 690 | 87.7% | 2.6% | 1.7% | 0.7% | $109k | 60.9% | 14.0% | 18.9% | 90.3% | 4.5% | 0.3% |
| 9E-2 Precinct | 988 | 698 | 91.7% | 2.4% | 0.0% | 0.6% | $131k | 68.4% | 4.9% | 15.2% | 97.9% | 1.8% | 1.2% |
| 9E-4 Precinct | 1,419 | 1,020 | 93.2% | 2.8% | 1.0% | 0.3% | $137k | 72.0% | 12.0% | 24.2% | 89.6% | 4.9% | 1.3% |
| 9E-5 Precinct | 863 | 597 | 95.5% | 2.8% | 0.0% | 0.1% | $155k | 76.3% | 8.9% | 20.9% | 95.8% | 2.7% | 1.8% |
| 9F-1 Precinct | 1,057 | 839 | 91.0% | 1.5% | 0.0% | 0.8% | $95k | 51.8% | 6.5% | 32.0% | 85.0% | 2.5% | 0.4% |
| 9F-10 Precinct | 1,402 | 1,092 | 73.8% | 21.0% | 1.2% | 0.0% | $51k | 39.7% | 41.9% | 5.8% | 27.1% | 20.7% | 10.1% |
| 9F-11 Precinct | 1,706 | 1,463 | 82.7% | 8.5% | 5.9% | 0.8% | $72k | 38.8% | 32.8% | 9.2% | 43.6% | 10.3% | 6.4% |
| 9F-2 Precinct | 1,296 | 1,079 | 91.6% | 1.3% | 0.0% | 0.0% | $88k | 53.2% | 9.1% | 32.2% | 81.0% | 0.0% | 0.8% |
| 9F-3 Precinct | 1,234 | 866 | 89.3% | 0.2% | 0.0% | 0.4% | $99k | 42.8% | 14.3% | 13.3% | 85.5% | 7.3% | 0.2% |
| 9F-4 Precinct | 1,146 | 960 | 89.8% | 3.8% | 3.8% | 0.0% | $104k | 36.0% | 12.5% | 25.9% | 94.0% | 7.1% | 2.9% |
| 9F-5 Precinct | 1,483 | 1,239 | 77.9% | 6.4% | 1.0% | 10.3% | $80k | 38.9% | 15.1% | 19.3% | 79.1% | 5.2% | 1.9% |
| 9F-9 Precinct | 976 | 745 | 78.2% | 11.6% | 1.2% | 0.0% | $63k | 34.8% | 30.4% | 9.4% | 50.7% | 19.1% | 2.9% |
| 9G-1 Precinct | 1,129 | 928 | 90.1% | 0.0% | 0.1% | 7.0% | $159k | 73.0% | 5.8% | 34.2% | 83.3% | 7.9% | 1.1% |
| 9G-2 Precinct | 1,734 | 1,103 | 64.4% | 4.6% | 0.8% | 0.1% | $68k | 53.6% | 17.9% | 7.9% | 61.1% | 28.9% | 1.7% |
| 9G-3 Precinct | 1,242 | 1,148 | 83.0% | 11.6% | 0.1% | 0.0% | $76k | 50.3% | 50.9% | 22.6% | 19.1% | 9.4% | 1.0% |
| 9G-4 Precinct | 1,763 | 1,386 | 94.6% | 2.0% | 0.2% | 0.6% | $66k | 44.4% | 38.9% | 8.8% | 20.4% | 4.2% | 0.5% |
| 9G-5 Precinct | 1,128 | 835 | 87.3% | 5.7% | 1.4% | 0.0% | $85k | 62.3% | 28.6% | 6.6% | 56.3% | 5.6% | 1.1% |
| 9G-6 Precinct | 983 | 844 | 88.5% | 7.5% | 0.9% | 0.0% | $95k | 48.5% | 29.8% | 27.2% | 61.8% | 7.4% | 0.9% |
| 9G-7 Precinct | 1,089 | 849 | 88.7% | 6.2% | 2.9% | 0.1% | $122k | 56.2% | 13.1% | 28.1% | 84.4% | 7.3% | 0.9% |
| 9G-8 Precinct | 1,122 | 809 | 89.6% | 2.9% | 4.3% | 0.0% | $114k | 43.1% | 3.9% | 24.3% | 97.5% | 13.7% | 5.3% |
| 9G-9 Precinct | 617 | 446 | 95.9% | 2.4% | 0.0% | 0.9% | $119k | 61.3% | 15.0% | 20.9% | 97.8% | 0.0% | 0.6% |
| 9H-1 Precinct | 790 | 591 | 85.4% | 8.0% | 4.8% | 0.0% | $128k | 64.7% | 10.9% | 28.0% | 68.4% | 8.8% | 0.9% |
| 9H-2 Precinct | 1,383 | 973 | 90.7% | 0.9% | 0.1% | 2.6% | $126k | 58.9% | 13.1% | 11.5% | 83.6% | 1.7% | 0.4% |
| 9H-3 Precinct | 1,119 | 843 | 85.3% | 7.3% | 0.4% | 1.9% | $98k | 55.4% | 22.6% | 16.9% | 59.1% | 2.4% | 2.7% |
| 9H-4 Precinct | 786 | 600 | 87.8% | 3.6% | 3.6% | 1.4% | $92k | 64.6% | 8.1% | 29.2% | 73.8% | 11.8% | 0.4% |
| 9H-5 Precinct | 840 | 656 | 85.0% | 4.6% | 0.6% | 3.0% | $106k | 56.9% | 24.7% | 14.1% | 65.2% | 3.2% | 2.2% |
| 9H-6 Precinct | 1,056 | 765 | 94.5% | 3.0% | 0.4% | 0.9% | $154k | 68.5% | 12.7% | 17.6% | 98.5% | 2.8% | 0.8% |
| 9H-7 Precinct | 1,304 | 897 | 89.9% | 4.2% | 0.0% | 1.7% | $113k | 57.0% | 12.6% | 14.8% | 72.5% | 1.2% | 1.2% |
| 9H-8 Precinct | 2,574 | 1,753 | 77.2% | 0.3% | 0.8% | 17.7% | $121k | 56.9% | 22.6% | 10.8% | 63.5% | 2.1% | 0.0% |
| Buda Precinct | 1,340 | 1,062 | 93.5% | 1.4% | 0.0% | 0.0% | $117k | 25.9% | 8.9% | 27.4% | 94.4% | 5.3% | 3.5% |
| Centerville Precinct | 1,110 | 883 | 93.9% | 1.2% | 0.0% | 0.0% | $117k | 27.1% | 8.9% | 27.5% | 94.5% | 5.7% | 3.1% |
| Denton Precinct | 2,198 | 1,639 | 89.7% | 3.1% | 0.0% | 2.8% | $124k | 39.3% | 13.7% | 17.1% | 88.7% | 2.9% | 4.0% |
| Elk Precinct | 706 | 510 | 89.5% | 5.3% | 0.4% | 3.8% | $111k | 44.7% | 16.1% | 17.3% | 85.0% | 5.4% | 3.4% |
| Garfield 1 Precinct | 467 | 342 | 67.7% | 8.7% | 13.0% | 0.7% | $79k | 24.1% | 18.3% | 4.2% | 91.2% | 7.8% | 7.3% |
| Grant 1 Precinct | 2,597 | 1,877 | 91.7% | 1.7% | 0.2% | 2.4% | $134k | 64.1% | 18.5% | 13.1% | 79.1% | 7.9% | 4.9% |
| Grant 2 Precinct | 1,388 | 1,093 | 90.9% | 4.5% | 0.0% | 3.7% | $77k | 59.9% | 31.3% | 18.2% | 57.3% | 6.5% | 0.6% |
| Grant 3 Precinct | 3,807 | 2,855 | 90.3% | 2.7% | 0.9% | 2.9% | $115k | 58.2% | 11.3% | 20.9% | 76.9% | 4.2% | 2.1% |
| Grant 4 Precinct | 206 | 140 | 77.2% | 0.3% | 0.8% | 17.7% | $121k | 56.9% | 22.6% | 10.8% | 63.5% | 2.1% | 0.0% |
| Hickman Precinct | 629 | 425 | 94.2% | 4.0% | 0.0% | 0.0% | $112k | 39.5% | 13.7% | 11.9% | 87.3% | 3.2% | 1.2% |
| Middle Creek Precinct | 5,147 | 3,775 | 71.0% | 13.0% | 4.8% | 4.0% | $98k | 29.0% | 20.5% | 8.1% | 70.0% | 8.2% | 6.8% |
| Murdock South Precinct | 2,382 | 1,890 | 78.1% | 7.1% | 3.6% | 4.9% | $93k | 47.6% | 30.0% | 16.0% | 64.1% | 11.0% | 3.1% |
| Nemaha Precinct | 2,311 | 1,580 | 92.1% | 3.3% | 0.3% | 0.4% | $118k | 48.7% | 12.0% | 13.8% | 89.6% | 3.8% | 0.4% |
| North Bluff Precinct | 1,296 | 1,021 | 80.3% | 5.4% | 10.0% | 2.8% | $71k | 45.4% | 43.5% | 8.8% | 38.4% | 9.7% | 2.0% |
| Oak Precinct | 3,726 | 2,903 | 79.0% | 4.1% | 1.8% | 8.5% | $75k | 45.7% | 33.2% | 10.2% | 48.4% | 10.9% | 1.0% |
| Panama Precinct | 1,216 | 870 | 90.4% | 4.9% | 0.0% | 0.3% | $114k | 43.6% | 16.1% | 16.3% | 86.9% | 6.7% | 2.6% |
| Rock Creek Precinct | 712 | 537 | 99.9% | 0.0% | 0.1% | 0.0% | $115k | 35.0% | 11.0% | 34.2% | 85.1% | 6.9% | 0.0% |
| Saltillo 1 Precinct | 1,047 | 748 | 89.7% | 2.7% | 1.3% | 0.7% | $143k | 43.0% | 6.4% | 17.8% | 98.7% | 0.8% | 1.3% |
| Saltillo 2 Precinct | 3,883 | 2,625 | 92.6% | 3.5% | 0.4% | 0.2% | $127k | 44.6% | 12.1% | 13.3% | 91.6% | 2.3% | 1.6% |
| South Pass Precinct | 743 | 526 | 90.2% | 4.9% | 0.0% | 0.4% | $107k | 44.2% | 18.7% | 15.1% | 86.5% | 7.5% | 3.3% |
| Stevens Creek Precinct | 898 | 678 | 86.1% | 2.1% | 3.4% | 2.1% | $114k | 34.6% | 21.2% | 20.5% | 81.1% | 13.0% | 0.5% |
| Stockton Precinct | 753 | 454 | 96.3% | 0.0% | 1.0% | 0.7% | $142k | 53.8% | 8.2% | 18.1% | 94.6% | 1.2% | 0.8% |
| Waverly 2 Precinct | 3,771 | 2,683 | 88.8% | 4.7% | 1.2% | 0.6% | $115k | 38.0% | 16.3% | 20.3% | 83.4% | 6.6% | 0.4% |
| Waverly North Precinct | 1,367 | 864 | 85.4% | 13.3% | 0.0% | 0.0% | $120k | 34.9% | 16.2% | 9.3% | 86.9% | 0.2% | 1.2% |
| Waverly South Precinct | 1,549 | 1,152 | 90.9% | 1.5% | 0.0% | 0.0% | $97k | 46.9% | 15.3% | 28.7% | 75.8% | 0.9% | 0.0% |
| West Salt Precinct | 1,802 | 1,334 | 93.0% | 2.9% | 0.2% | 1.8% | $115k | 39.8% | 11.6% | 21.6% | 83.7% | 4.5% | 1.6% |
| Yankee Hill East Precinct | 2,666 | 2,086 | 89.6% | 4.5% | 0.8% | 2.3% | $120k | 46.0% | 20.0% | 19.3% | 75.2% | 4.4% | 1.8% |
| Yankee Hill West Precinct | 2,305 | 1,783 | 89.5% | 3.8% | 0.0% | 2.8% | $142k | 54.8% | 8.3% | 23.1% | 81.3% | 4.4% | 3.0% |
Sarpy: 57 precincts
| Precinct | Population | Voting-age pop. | % White non-Hisp. | % Hispanic | % Black | % Asian | Median income* | % Bachelor's+ | % 18-29 (of adults) | % 65+ | % Homeowners | % Below poverty | % Spanish at home (adults) |
|---|---|---|---|---|---|---|---|---|---|---|---|---|---|
| Precinct 1 | 3,188 | 1,980 | 37.3% | 55.8% | 4.6% | 0.8% | $59k | 13.4% | 23.4% | 8.8% | 55.0% | 11.6% | 38.9% |
| Precinct 10 | 6,053 | 4,261 | 68.3% | 14.1% | 7.7% | 1.8% | $67k | 19.2% | 29.8% | 6.6% | 50.6% | 9.2% | 6.7% |
| Precinct 11 | 2,148 | 1,836 | 71.3% | 9.9% | 9.4% | 5.0% | $86k | 37.3% | 21.3% | 22.4% | 63.3% | 5.9% | 3.0% |
| Precinct 12 | 2,871 | 2,168 | 73.8% | 7.6% | 8.1% | 4.6% | $105k | 43.0% | 22.3% | 14.9% | 92.9% | 0.9% | 4.1% |
| Precinct 13 | 2,270 | 1,788 | 80.6% | 3.9% | 9.3% | 1.3% | $125k | 52.3% | 25.5% | 11.4% | 73.7% | 5.8% | 3.3% |
| Precinct 14 | 2,225 | 1,800 | 66.9% | 22.1% | 0.0% | 1.0% | $92k | 21.6% | 17.3% | 18.9% | 90.2% | 4.1% | 11.8% |
| Precinct 15 | 2,990 | 2,365 | 50.1% | 39.5% | 3.0% | 0.0% | $102k | 19.6% | 25.3% | 11.9% | 80.9% | 20.8% | 29.8% |
| Precinct 16 | 2,347 | 1,853 | 61.9% | 31.8% | 1.6% | 0.0% | $85k | 21.4% | 26.7% | 16.5% | 76.1% | 6.1% | 28.2% |
| Precinct 17 | 2,939 | 2,211 | 62.5% | 23.6% | 3.4% | 5.8% | $132k | 31.1% | 21.3% | 18.3% | 92.8% | 3.1% | 16.9% |
| Precinct 18 | 2,777 | 2,224 | 59.1% | 22.2% | 4.6% | 0.5% | $102k | 33.4% | 25.4% | 13.1% | 58.4% | 9.7% | 13.1% |
| Precinct 19 | 4,737 | 3,650 | 72.1% | 9.7% | 6.2% | 7.6% | $92k | 43.2% | 32.3% | 7.1% | 43.9% | 5.5% | 7.2% |
| Precinct 2 | 4,022 | 3,168 | 82.2% | 7.2% | 1.5% | 6.1% | $113k | 52.3% | 16.5% | 24.2% | 69.6% | 4.3% | 0.2% |
| Precinct 20 | 2,125 | 1,647 | 85.9% | 4.7% | 2.8% | 2.5% | $147k | 63.7% | 15.0% | 15.1% | 76.8% | 1.5% | 1.3% |
| Precinct 21 | 1,724 | 1,120 | 85.5% | 12.1% | 1.4% | 0.0% | $130k | 41.5% | 2.0% | 13.6% | 98.9% | 0.0% | 11.8% |
| Precinct 22 | 2,440 | 2,237 | 86.3% | 10.1% | 0.4% | 1.1% | $120k | 43.2% | 19.0% | 35.6% | 52.7% | 4.0% | 8.0% |
| Precinct 23 | 3,636 | 2,445 | 62.7% | 16.3% | 5.8% | 1.1% | $72k | 32.5% | 34.3% | 8.0% | 31.5% | 14.7% | 10.4% |
| Precinct 24 | 1,410 | 993 | 81.2% | 5.1% | 3.9% | 4.9% | $138k | 59.0% | 13.7% | 11.7% | 83.8% | 4.2% | 5.2% |
| Precinct 26 | 2,463 | 1,787 | 81.0% | 6.3% | 4.4% | 4.2% | $124k | 49.4% | 15.3% | 14.2% | 80.0% | 3.1% | 3.7% |
| Precinct 27 | 3,814 | 2,555 | 59.9% | 14.0% | 7.1% | 1.7% | $78k | 28.4% | 35.1% | 7.1% | 24.8% | 4.1% | 5.5% |
| Precinct 28 | 2,978 | 1,949 | 70.9% | 12.6% | 5.8% | 4.9% | $120k | 52.4% | 15.9% | 11.6% | 85.4% | 0.4% | 4.6% |
| Precinct 29 | 2,921 | 2,344 | 79.6% | 7.7% | 2.4% | 4.9% | $115k | 39.9% | 27.2% | 14.5% | 75.1% | 3.9% | 5.0% |
| Precinct 3 | 3,500 | 2,428 | 58.0% | 18.6% | 15.9% | 1.8% | $73k | 45.3% | 22.8% | 15.7% | 62.1% | 6.4% | 12.1% |
| Precinct 30 | 2,357 | 1,811 | 79.6% | 8.4% | 6.1% | 0.7% | $69k | 35.0% | 28.0% | 15.0% | 51.4% | 13.7% | 3.7% |
| Precinct 31 | 3,508 | 2,425 | 62.4% | 32.9% | 3.5% | 0.0% | $106k | 33.8% | 25.2% | 6.6% | 56.6% | 6.3% | 20.3% |
| Precinct 32 | 1,375 | 1,108 | 91.6% | 5.0% | 0.0% | 1.3% | $151k | 49.8% | 18.9% | 23.3% | 80.5% | 4.0% | 0.7% |
| Precinct 33 | 2,296 | 1,779 | 71.2% | 12.0% | 5.6% | 6.0% | $84k | 23.0% | 30.1% | 10.1% | 65.4% | 16.0% | 7.8% |
| Precinct 34 | 1,986 | 1,661 | 65.8% | 24.3% | 5.9% | 0.0% | $80k | 29.7% | 25.9% | 16.1% | 25.8% | 3.6% | 12.6% |
| Precinct 35 | 2,103 | 1,550 | 72.6% | 23.2% | 1.1% | 0.7% | $98k | 44.1% | 23.9% | 15.1% | 55.0% | 1.2% | 6.3% |
| Precinct 36 | 2,485 | 1,952 | 73.0% | 13.2% | 6.4% | 3.9% | $127k | 52.7% | 26.8% | 11.9% | 66.0% | 5.5% | 7.9% |
| Precinct 37 | 1,189 | 934 | 71.6% | 13.9% | 6.5% | 4.6% | $122k | 52.9% | 28.7% | 11.1% | 63.0% | 5.4% | 8.6% |
| Precinct 38 | 1,870 | 1,469 | 79.8% | 1.6% | 10.1% | 1.1% | $184k | 50.1% | 17.2% | 15.4% | 94.5% | 2.5% | 0.8% |
| Precinct 39 | 2,649 | 2,164 | 68.1% | 20.8% | 7.3% | 0.9% | $116k | 42.6% | 21.2% | 17.0% | 77.9% | 1.9% | 15.9% |
| Precinct 4 | 3,502 | 2,750 | 61.2% | 20.7% | 3.5% | 4.8% | $113k | 47.3% | 21.4% | 15.2% | 75.1% | 3.3% | 17.3% |
| Precinct 40 | 2,375 | 1,983 | 90.0% | 4.9% | 3.7% | 0.3% | $117k | 51.2% | 22.4% | 20.8% | 76.0% | 2.0% | 1.5% |
| Precinct 41 | 1,358 | 965 | 71.9% | 4.0% | 6.1% | 8.1% | $133k | 52.8% | 13.6% | 10.4% | 87.6% | 3.1% | 0.0% |
| Precinct 42 | 2,740 | 2,133 | 85.6% | 6.0% | 2.0% | 2.8% | $90k | 44.3% | 23.2% | 19.3% | 82.0% | 5.0% | 2.8% |
| Precinct 43 | 3,084 | 2,180 | 82.5% | 8.5% | 3.9% | 0.1% | $120k | 61.9% | 22.1% | 11.0% | 82.3% | 10.0% | 0.8% |
| Precinct 44 | 2,635 | 2,159 | 87.0% | 7.0% | 1.3% | 1.4% | $89k | 41.6% | 23.9% | 18.8% | 68.7% | 6.6% | 4.5% |
| Precinct 45 | 2,428 | 1,883 | 73.9% | 8.8% | 4.2% | 6.0% | $94k | 37.6% | 19.5% | 12.3% | 50.4% | 9.2% | 3.8% |
| Precinct 46 | 3,828 | 3,036 | 89.3% | 6.6% | 0.8% | 2.0% | $90k | 43.7% | 32.9% | 9.9% | 55.1% | 6.1% | 2.3% |
| Precinct 47 | 1,540 | 1,306 | 82.8% | 11.1% | 3.4% | 0.0% | $97k | 37.8% | 17.3% | 18.5% | 91.5% | 5.1% | 1.7% |
| Precinct 48 | 2,113 | 1,686 | 72.3% | 20.0% | 0.0% | 1.7% | $101k | 41.6% | 20.9% | 9.0% | 79.0% | 5.3% | 3.0% |
| Precinct 49 | 1,711 | 1,248 | 83.3% | 9.0% | 0.0% | 2.4% | $73k | 30.2% | 29.2% | 5.6% | 54.4% | 3.4% | 0.0% |
| Precinct 5 | 2,823 | 2,129 | 69.5% | 22.8% | 7.1% | 0.5% | $84k | 28.0% | 23.8% | 22.2% | 63.3% | 8.8% | 12.5% |
| Precinct 50 | 1,461 | 1,029 | 90.2% | 4.9% | 0.0% | 2.4% | $122k | 40.0% | 11.4% | 7.8% | 98.2% | 0.0% | 0.0% |
| Precinct 53 | 2,535 | 2,010 | 90.5% | 0.7% | 0.3% | 0.8% | $80k | 37.0% | 23.5% | 10.5% | 57.1% | 4.9% | 0.2% |
| Precinct 57 | 2,416 | 1,709 | 75.0% | 6.1% | 7.8% | 2.4% | $112k | 49.0% | 11.0% | 14.8% | 65.0% | 1.8% | 0.8% |
| Precinct 58 | 2,242 | 1,777 | 84.8% | 9.4% | 0.9% | 3.3% | $107k | 61.1% | 25.5% | 9.4% | 50.4% | 3.6% | 4.4% |
| Precinct 6 | 3,294 | 2,555 | 67.5% | 12.4% | 11.4% | 4.3% | $47k | 15.7% | 35.7% | 16.5% | 27.0% | 20.3% | 4.5% |
| Precinct 62 | 907 | 629 | 88.4% | 6.9% | 0.0% | 4.7% | $140k | 51.0% | 7.0% | 16.2% | 99.6% | 0.4% | 5.0% |
| Precinct 64 | 1,312 | 852 | 79.1% | 5.8% | 8.1% | 2.0% | $123k | 48.0% | 16.8% | 6.5% | 92.9% | 2.6% | 3.7% |
| Precinct 65 | 1,263 | 819 | 79.0% | 5.8% | 8.2% | 2.0% | $123k | 48.0% | 16.8% | 6.4% | 92.9% | 2.6% | 3.7% |
| Precinct 66 | 3,450 | 2,528 | 75.4% | 8.4% | 6.8% | 1.6% | $129k | 50.5% | 19.2% | 11.6% | 81.6% | 3.7% | 5.9% |
| Precinct 7 | 2,412 | 1,874 | 67.2% | 8.3% | 7.0% | 3.7% | $67k | 27.6% | 18.4% | 19.8% | 53.8% | 9.7% | 3.0% |
| Precinct 70 | 2,730 | 1,939 | 67.6% | 12.3% | 3.9% | 5.4% | $182k | 49.7% | 14.1% | 10.9% | 95.0% | 2.1% | 7.3% |
| Precinct 8 | 1,586 | 1,131 | 86.4% | 8.7% | 1.7% | 1.5% | $61k | 20.3% | 13.1% | 15.3% | 44.8% | 10.4% | 3.8% |
| Precinct 9 | 1,388 | 1,066 | 65.8% | 5.6% | 5.5% | 1.7% | $56k | 13.7% | 15.0% | 13.7% | 72.2% | 9.2% | 1.7% |
Dodge: 32 precincts
| Precinct | Population | Voting-age pop. | % White non-Hisp. | % Hispanic | % Black | % Asian | Median income* | % Bachelor's+ | % 18-29 (of adults) | % 65+ | % Homeowners | % Below poverty | % Spanish at home (adults) |
|---|---|---|---|---|---|---|---|---|---|---|---|---|---|
| Cuming-Everett Precinct | 1,461 | 979 | 85.1% | 8.2% | 0.9% | 2.0% | $74k | 24.6% | 12.4% | 18.1% | 78.7% | 8.1% | 5.2% |
| Elkhorn Precinct | 3,416 | 2,543 | 81.0% | 15.4% | 0.0% | 0.6% | $94k | 19.8% | 17.2% | 24.0% | 66.0% | 12.6% | 11.5% |
| Fremont Precinct 1A | 1,917 | 1,339 | 66.9% | 28.8% | 0.0% | 0.1% | $72k | 19.3% | 18.2% | 13.2% | 70.1% | 4.6% | 14.6% |
| Fremont Precinct 1B | 1,410 | 1,110 | 70.6% | 17.5% | 0.5% | 0.0% | $86k | 30.7% | 28.7% | 19.5% | 77.3% | 7.4% | 13.0% |
| Fremont Precinct 1C | 1,553 | 1,165 | 96.0% | 2.4% | 0.0% | 0.0% | $113k | 42.3% | 14.7% | 25.4% | 88.9% | 3.9% | 1.8% |
| Fremont Precinct 1D | 723 | 542 | 69.3% | 24.6% | 0.0% | 0.2% | $68k | 10.1% | 14.1% | 16.7% | 63.7% | 8.3% | 17.7% |
| Fremont Precinct 1E | 746 | 495 | 75.8% | 20.7% | 0.0% | 1.0% | $94k | 28.8% | 13.7% | 23.1% | 69.0% | 10.7% | 14.9% |
| Fremont Precinct 2A | 874 | 644 | 84.1% | 14.9% | 0.0% | 0.0% | $55k | 19.5% | 18.6% | 12.3% | 75.2% | 28.0% | 8.3% |
| Fremont Precinct 2B | 972 | 668 | 75.2% | 22.1% | 0.0% | 0.0% | $93k | 24.9% | 18.7% | 14.0% | 51.1% | 3.4% | 6.9% |
| Fremont Precinct 2C | 370 | 295 | 91.5% | 0.8% | 0.0% | 0.0% | $78k | 15.5% | 6.4% | 30.1% | 60.8% | 6.0% | 0.6% |
| Fremont Precinct 2D | 666 | 478 | 71.4% | 24.1% | 0.0% | 0.4% | $49k | 17.6% | 12.0% | 26.8% | 66.6% | 14.7% | 18.0% |
| Fremont Precinct 2E | 1,570 | 1,054 | 62.7% | 32.4% | 1.8% | 0.0% | $56k | 21.7% | 8.3% | 23.1% | 51.1% | 13.4% | 16.8% |
| Fremont Precinct 3A | 841 | 665 | 62.5% | 33.8% | 2.4% | 0.1% | $67k | 22.1% | 29.0% | 4.4% | 46.4% | 15.5% | 28.5% |
| Fremont Precinct 3B | 780 | 646 | 73.0% | 17.5% | 0.7% | 0.2% | $53k | 20.7% | 15.4% | 13.9% | 47.3% | 27.2% | 4.6% |
| Fremont Precinct 3C | 320 | 236 | 55.7% | 44.2% | 0.0% | 0.0% | $63k | 11.5% | 24.7% | 6.5% | 51.4% | 19.8% | 38.0% |
| Fremont Precinct 3D | 1,621 | 1,164 | 67.1% | 25.1% | 3.6% | 0.0% | $54k | 25.2% | 17.5% | 15.3% | 59.5% | 19.6% | 14.8% |
| Fremont Precinct 3E | 1,355 | 1,070 | 81.0% | 17.0% | 0.8% | 0.1% | $62k | 19.6% | 45.3% | 9.3% | 44.8% | 18.0% | 8.5% |
| Fremont Precinct 4A | 1,074 | 882 | 79.5% | 14.8% | 0.0% | 2.6% | $90k | 19.1% | 13.5% | 22.4% | 70.1% | 1.5% | 14.1% |
| Fremont Precinct 4B | 698 | 663 | 80.0% | 12.1% | 0.0% | 0.0% | $82k | 17.8% | 22.5% | 31.7% | 57.9% | 2.9% | 11.4% |
| Fremont Precinct 4C | 957 | 770 | 84.1% | 10.7% | 0.0% | 1.7% | $116k | 16.6% | 21.5% | 20.3% | 59.0% | 8.0% | 7.0% |
| Fremont Precinct 4D | 1,357 | 1,024 | 92.3% | 5.7% | 0.0% | 0.8% | $107k | 37.4% | 14.4% | 23.8% | 84.3% | 3.1% | 5.2% |
| Fremont Precinct 4E | 1,133 | 929 | 85.0% | 12.9% | 0.7% | 0.0% | $66k | 23.5% | 48.5% | 11.9% | 56.4% | 8.4% | 5.7% |
| Hooper City Precinct | 36 | 23 | 83.4% | 9.1% | 1.8% | 1.5% | $72k | 24.9% | 8.2% | 16.6% | 79.6% | 8.0% | 4.3% |
| Logan-Hooper Precinct | 1,067 | 722 | 82.3% | 11.2% | 0.6% | 3.0% | $85k | 27.1% | 16.3% | 14.7% | 76.6% | 6.4% | 11.5% |
| Maple-Nickerson Precinct | 963 | 774 | 70.2% | 28.7% | 0.0% | 0.0% | $95k | 19.3% | 20.0% | 15.6% | 84.6% | 11.2% | 29.9% |
| North Bend Village Precinct | 72 | 53 | 83.3% | 14.2% | 0.0% | 0.0% | $92k | 19.7% | 8.3% | 21.9% | 82.7% | 7.8% | 7.4% |
| Pebble Precinct | 911 | 697 | 83.6% | 10.3% | 0.0% | 0.5% | $70k | 17.4% | 16.0% | 23.8% | 80.0% | 9.6% | 4.1% |
| Platte East Precinct | 2,003 | 1,517 | 77.6% | 15.1% | 0.0% | 0.4% | $64k | 12.2% | 9.7% | 30.7% | 54.1% | 14.6% | 15.0% |
| Platte West Precinct | 3,223 | 2,333 | 69.0% | 28.8% | 0.4% | 0.1% | $84k | 18.6% | 26.0% | 13.4% | 69.1% | 15.5% | 11.8% |
| Ridgely-Union-Cotterell Precinct- Pleasant Valley | 2,098 | 1,535 | 89.9% | 8.3% | 0.0% | 0.0% | $82k | 24.1% | 9.7% | 23.6% | 81.9% | 8.5% | 3.6% |
| Scribner City Precinct | 194 | 149 | 84.4% | 9.1% | 0.0% | 0.5% | $60k | 16.2% | 15.4% | 25.9% | 84.4% | 15.3% | 4.6% |
| Webster Precinct | 564 | 436 | 82.8% | 11.7% | 0.0% | 0.0% | $76k | 17.3% | 16.2% | 23.5% | 78.3% | 6.5% | 4.0% |
Madison: 23 precincts
| Precinct | Population | Voting-age pop. | % White non-Hisp. | % Hispanic | % Black | % Asian | Median income* | % Bachelor's+ | % 18-29 (of adults) | % 65+ | % Homeowners | % Below poverty | % Spanish at home (adults) |
|---|---|---|---|---|---|---|---|---|---|---|---|---|---|
| BC-Battle Creek Precinct | 502 | 358 | 92.4% | 1.6% | 0.2% | 0.3% | $90k | 24.4% | 11.4% | 14.2% | 83.3% | 4.9% | 0.9% |
| Fairview-Kalamazoo-Green Garden Precinct | 405 | 298 | 97.0% | 1.0% | 0.0% | 0.7% | $86k | 20.1% | 6.4% | 23.7% | 74.8% | 2.6% | 0.6% |
| Madison 1st Ward | 80 | 56 | 41.3% | 49.0% | 0.2% | 5.4% | $66k | 20.8% | 22.9% | 13.1% | 77.9% | 16.4% | 43.0% |
| Madison 2nd Ward | 43 | 32 | 39.7% | 49.4% | 0.1% | 8.6% | $67k | 14.4% | 19.4% | 16.4% | 74.5% | 12.3% | 41.9% |
| Meadow Grove-Jefferson-Grove-Highland Precinct | 2,177 | 1,545 | 93.8% | 1.9% | 0.3% | 0.2% | $82k | 23.8% | 12.3% | 18.7% | 83.1% | 7.1% | 0.6% |
| Norfolk 1-1 Precinct | 1,524 | 1,104 | 77.8% | 20.6% | 0.5% | 0.1% | $67k | 13.9% | 34.1% | 12.8% | 66.1% | 16.3% | 8.5% |
| Norfolk 1-2 Precinct | 1,062 | 753 | 71.2% | 21.9% | 0.3% | 0.0% | $59k | 11.1% | 28.3% | 10.6% | 49.6% | 19.8% | 8.4% |
| Norfolk 1-3 Precinct | 1,219 | 994 | 78.2% | 13.2% | 0.4% | 0.0% | $53k | 17.1% | 23.4% | 17.1% | 52.5% | 13.4% | 6.4% |
| Norfolk 2-1 Precinct | 1,475 | 1,088 | 83.5% | 7.5% | 0.1% | 0.7% | $108k | 43.7% | 15.3% | 21.5% | 77.3% | 9.4% | 2.5% |
| Norfolk 2-2 Precinct | 1,257 | 924 | 80.9% | 9.7% | 0.2% | 0.3% | $106k | 31.0% | 14.7% | 15.8% | 86.5% | 8.6% | 9.0% |
| Norfolk 2-3 Precinct | 2,478 | 1,914 | 77.4% | 10.8% | 2.0% | 3.0% | $69k | 34.4% | 20.3% | 21.1% | 61.4% | 7.0% | 5.8% |
| Norfolk 3-1 Precinct | 1,412 | 1,075 | 77.9% | 21.2% | 0.1% | 0.0% | $49k | 20.3% | 27.0% | 17.4% | 61.6% | 5.1% | 19.4% |
| Norfolk 3-2 Precinct | 1,970 | 1,497 | 70.0% | 24.5% | 1.2% | 0.0% | $53k | 16.3% | 18.7% | 16.7% | 57.1% | 21.0% | 20.1% |
| Norfolk 3-3 Precinct | 2,111 | 1,532 | 75.0% | 13.0% | 3.4% | 3.1% | $69k | 29.7% | 23.0% | 22.1% | 59.9% | 10.0% | 5.6% |
| Norfolk 4-1 Precinct | 1,837 | 1,399 | 83.2% | 13.8% | 0.7% | 0.2% | $56k | 15.8% | 21.8% | 9.3% | 47.8% | 18.3% | 7.5% |
| Norfolk 4-2 Precinct | 2,121 | 1,627 | 80.9% | 10.3% | 2.7% | 4.4% | $60k | 17.1% | 15.8% | 24.4% | 61.4% | 17.1% | 5.2% |
| Norfolk 4-3 Precinct | 1,604 | 1,131 | 58.7% | 35.0% | 0.0% | 0.0% | $63k | 21.0% | 24.9% | 9.2% | 70.2% | 19.0% | 12.9% |
| Norfolk Precinct | 4,295 | 3,488 | 83.2% | 13.3% | 0.5% | 0.1% | $51k | 21.4% | 26.7% | 19.8% | 48.6% | 21.1% | 8.6% |
| Schoolcraft-Emerick-SCrk-NG Precinct | 1,180 | 874 | 66.4% | 30.0% | 0.0% | 0.2% | $59k | 14.6% | 17.3% | 20.9% | 76.6% | 13.3% | 20.0% |
| Tilden 2nd Ward Precinct | 9 | 7 | 96.1% | 2.3% | 0.3% | 0.0% | $74k | 23.4% | 12.6% | 26.0% | 85.1% | 8.4% | 0.3% |
| Union-Madison Precinct | 2,632 | 1,906 | 48.0% | 42.5% | 0.1% | 6.2% | $71k | 18.2% | 19.1% | 15.5% | 77.7% | 12.2% | 36.3% |
| Valley Precinct | 3,285 | 2,305 | 86.1% | 7.8% | 0.2% | 0.3% | $108k | 35.7% | 11.9% | 15.7% | 84.6% | 6.8% | 5.6% |
| Warnerville Precinct | 717 | 524 | 87.9% | 9.8% | 0.0% | 0.0% | $72k | 28.6% | 10.0% | 15.6% | 87.4% | 12.3% | 11.8% |
Platte: 30 precincts
| Precinct | Population | Voting-age pop. | % White non-Hisp. | % Hispanic | % Black | % Asian | Median income* | % Bachelor's+ | % 18-29 (of adults) | % 65+ | % Homeowners | % Below poverty | % Spanish at home (adults) |
|---|---|---|---|---|---|---|---|---|---|---|---|---|---|
| Bismark Precinct | 1,440 | 1,101 | 74.0% | 22.2% | 1.3% | 0.2% | $92k | 25.0% | 20.4% | 20.5% | 67.9% | 8.1% | 17.4% |
| Butler/Loup Precinct | 980 | 703 | 90.8% | 5.5% | 3.1% | 0.1% | $98k | 25.8% | 24.4% | 27.5% | 98.1% | 3.8% | 1.0% |
| Columbus Twp A Precinct | 3,461 | 2,514 | 47.1% | 49.4% | 1.2% | 0.0% | $62k | 19.3% | 22.5% | 14.5% | 69.7% | 9.1% | 38.0% |
| Columbus Twp B Precinct | 2,454 | 1,897 | 84.8% | 9.3% | 1.0% | 0.9% | $81k | 32.0% | 12.0% | 23.2% | 79.6% | 8.1% | 5.7% |
| Columbus Ward 1A | 1,336 | 908 | 79.3% | 20.7% | 0.0% | 0.0% | $81k | 17.9% | 18.2% | 11.1% | 94.5% | 5.9% | 14.5% |
| Columbus Ward 1B | 1,013 | 745 | 63.1% | 26.9% | 5.1% | 1.9% | $78k | 9.9% | 19.3% | 13.7% | 81.1% | 2.3% | 18.3% |
| Columbus Ward 1C | 1,054 | 750 | 63.2% | 30.2% | 2.7% | 0.8% | $56k | 7.6% | 18.9% | 12.9% | 62.5% | 14.1% | 25.2% |
| Columbus Ward 1D | 984 | 755 | 71.4% | 28.6% | 0.0% | 0.0% | $55k | 13.9% | 8.6% | 19.2% | 75.2% | 13.5% | 20.0% |
| Columbus Ward 2A | 1,517 | 984 | 66.1% | 30.0% | 1.0% | 0.0% | $53k | 11.5% | 23.0% | 9.1% | 60.4% | 18.7% | 24.7% |
| Columbus Ward 2B | 1,164 | 851 | 69.0% | 27.6% | 0.6% | 0.0% | $56k | 16.1% | 18.6% | 15.8% | 68.3% | 16.8% | 21.3% |
| Columbus Ward 2C | 1,760 | 1,484 | 70.4% | 27.6% | 0.0% | 0.0% | $64k | 18.3% | 28.3% | 20.5% | 56.0% | 14.3% | 24.0% |
| Columbus Ward 2D | 1,486 | 1,129 | 59.2% | 39.7% | 0.1% | 0.0% | $72k | 28.1% | 24.3% | 13.4% | 56.9% | 18.5% | 31.4% |
| Columbus Ward 3A | 2,035 | 1,491 | 59.9% | 37.8% | 0.0% | 0.0% | $33k | 24.8% | 19.6% | 21.1% | 28.5% | 23.9% | 25.4% |
| Columbus Ward 3B | 876 | 711 | 87.9% | 7.5% | 0.0% | 0.0% | $68k | 22.4% | 17.3% | 27.6% | 72.5% | 0.5% | 6.2% |
| Columbus Ward 3C | 832 | 613 | 82.5% | 9.6% | 0.0% | 0.0% | $99k | 33.9% | 18.4% | 25.5% | 78.9% | 1.1% | 4.6% |
| Columbus Ward 3D | 1,816 | 1,338 | 82.2% | 9.9% | 0.1% | 0.0% | $96k | 33.5% | 17.9% | 25.1% | 77.8% | 1.8% | 4.9% |
| Columbus Ward 4A | 1,558 | 994 | 60.9% | 35.6% | 0.4% | 0.0% | $54k | 22.2% | 26.9% | 12.1% | 51.6% | 24.7% | 26.0% |
| Columbus Ward 4B | 1,218 | 936 | 65.8% | 30.9% | 0.3% | 0.0% | $80k | 25.8% | 17.5% | 20.2% | 83.7% | 7.9% | 18.1% |
| Columbus Ward 4C | 998 | 820 | 69.4% | 27.4% | 0.5% | 0.0% | $96k | 24.5% | 18.4% | 24.0% | 94.4% | 2.0% | 17.5% |
| Columbus Ward 4D | 1,018 | 603 | 45.5% | 54.0% | 0.2% | 0.0% | $77k | 15.7% | 16.6% | 5.9% | 88.8% | 2.5% | 42.7% |
| Creston Precinct | 234 | 162 | 96.3% | 0.3% | 0.0% | 0.0% | $98k | 22.4% | 13.5% | 17.6% | 83.3% | 2.1% | 3.4% |
| Granville Precinct | 489 | 359 | 98.1% | 0.5% | 0.1% | 0.1% | $84k | 23.2% | 18.5% | 21.6% | 85.7% | 5.9% | 0.8% |
| Humphrey Precinct | 321 | 230 | 97.2% | 0.4% | 0.0% | 0.0% | $91k | 22.8% | 16.1% | 19.6% | 84.6% | 4.1% | 2.0% |
| Joliet Precinct | 311 | 231 | 98.3% | 0.6% | 0.0% | 0.0% | $87k | 27.7% | 19.6% | 22.7% | 86.6% | 3.8% | 0.7% |
| Lost Creek/Burrows Precinct | 939 | 675 | 96.7% | 0.9% | 0.3% | 0.2% | $88k | 23.3% | 11.7% | 18.5% | 85.2% | 6.8% | 0.8% |
| Oconee/Monroe Precinct | 834 | 593 | 96.3% | 0.9% | 0.8% | 0.3% | $98k | 27.7% | 5.6% | 19.4% | 90.7% | 6.1% | 0.5% |
| Shell Creek Precinct | 1,138 | 868 | 95.3% | 1.2% | 0.3% | 1.2% | $118k | 36.1% | 18.2% | 20.7% | 83.0% | 3.0% | 1.1% |
| Sherman/Grand Prairie Precinct | 469 | 326 | 96.3% | 0.3% | 0.0% | 0.0% | $98k | 22.4% | 13.5% | 17.6% | 83.3% | 2.1% | 3.4% |
| St. Bernard Precinct | 332 | 246 | 98.2% | 0.6% | 0.0% | 0.0% | $86k | 26.9% | 19.4% | 22.5% | 86.4% | 4.2% | 0.7% |
| Walker/Woodville Precinct | 546 | 412 | 98.4% | 0.7% | 0.0% | 0.0% | $90k | 32.7% | 20.9% | 24.0% | 87.7% | 1.5% | 0.7% |
Cass: 30 precincts
| Precinct | Population | Voting-age pop. | % White non-Hisp. | % Hispanic | % Black | % Asian | Median income* | % Bachelor's+ | % 18-29 (of adults) | % 65+ | % Homeowners | % Below poverty | % Spanish at home (adults) |
|---|---|---|---|---|---|---|---|---|---|---|---|---|---|
| Avoca Precinct | 591 | 452 | 94.8% | 0.8% | 0.3% | 0.0% | $89k | 25.2% | 18.0% | 18.9% | 87.4% | 9.7% | 1.4% |
| Buccaneer Bay | 109 | 93 | 87.6% | 0.7% | 1.8% | 0.5% | $141k | 26.4% | 8.1% | 19.3% | 99.0% | 4.3% | 0.2% |
| Center Precinct | 1,317 | 877 | 90.7% | 4.4% | 0.1% | 0.0% | $89k | 27.1% | 15.5% | 16.2% | 78.0% | 6.1% | 3.3% |
| East Louisville Precinct | 1,031 | 774 | 86.1% | 3.8% | 0.1% | 0.8% | $100k | 35.7% | 15.8% | 17.8% | 85.2% | 5.8% | 0.7% |
| Eight Mile Grove Precinct | 1,932 | 1,572 | 88.8% | 1.3% | 1.5% | 0.5% | $134k | 28.4% | 10.0% | 18.1% | 97.7% | 4.9% | 0.5% |
| Elmwood Precinct | 547 | 400 | 97.1% | 1.8% | 0.0% | 0.2% | $96k | 40.4% | 9.3% | 24.3% | 83.1% | 2.5% | 0.3% |
| Liberty Precinct | 908 | 716 | 93.6% | 2.3% | 0.9% | 0.0% | $112k | 28.8% | 23.8% | 17.6% | 86.0% | 3.4% | 2.0% |
| McKelverly Precinct | 636 | 477 | 95.5% | 2.4% | 0.0% | 0.4% | $99k | 35.5% | 12.8% | 20.6% | 85.1% | 6.2% | 1.2% |
| Mount Pleasant Precinct | 576 | 403 | 95.0% | 2.6% | 0.4% | 0.0% | $94k | 29.7% | 15.6% | 17.4% | 91.9% | 7.8% | 1.8% |
| Nehawka Precinct | 501 | 399 | 92.4% | 2.0% | 1.3% | 0.0% | $106k | 25.4% | 26.1% | 16.3% | 80.8% | 4.8% | 2.2% |
| North Plattsmouth Precinct | 2,523 | 2,065 | 83.3% | 6.5% | 0.8% | 0.6% | $98k | 33.4% | 9.5% | 23.8% | 78.7% | 2.8% | 1.2% |
| North Rock Bluff Precinct | 816 | 646 | 95.1% | 1.8% | 0.0% | 0.0% | $100k | 37.9% | 15.0% | 21.6% | 95.4% | 7.5% | 0.8% |
| Plattsmouth 1st Ward 1st Precinct | 274 | 197 | 86.1% | 8.3% | 0.3% | 0.0% | $79k | 30.5% | 21.0% | 8.5% | 79.9% | 3.9% | 4.6% |
| Plattsmouth 1st Ward 2nd Precinct | 376 | 272 | 88.9% | 7.5% | 0.6% | 0.1% | $85k | 37.0% | 16.5% | 17.3% | 70.9% | 1.9% | 2.0% |
| Plattsmouth 2nd Ward 1st Precinct | 516 | 379 | 89.1% | 7.4% | 0.2% | 0.1% | $77k | 26.4% | 23.6% | 9.0% | 77.9% | 5.7% | 4.0% |
| Plattsmouth 2nd Ward 2nd Precinct | 988 | 781 | 87.0% | 10.5% | 0.0% | 0.0% | $84k | 22.7% | 25.7% | 10.8% | 68.3% | 5.2% | 0.0% |
| Plattsmouth 3rd Ward 1st Precinct | 449 | 356 | 85.8% | 8.4% | 0.0% | 0.0% | $77k | 25.4% | 27.7% | 15.6% | 68.1% | 7.0% | 0.2% |
| Plattsmouth 3rd Ward 2nd Precinct | 355 | 259 | 81.5% | 9.2% | 0.0% | 0.1% | $75k | 30.1% | 28.0% | 15.3% | 78.1% | 1.1% | 0.9% |
| Plattsmouth 4th Ward 1st Precinct | 525 | 424 | 88.6% | 5.2% | 0.1% | 0.0% | $71k | 26.3% | 26.6% | 17.8% | 66.7% | 12.0% | 2.0% |
| Plattsmouth 4th Ward 2nd Precinct | 102 | 88 | 89.3% | 3.5% | 0.0% | 0.0% | $73k | 29.0% | 24.2% | 23.1% | 70.8% | 15.1% | 0.5% |
| Salt Creek Precinct | 774 | 620 | 91.8% | 3.6% | 0.0% | 0.9% | $109k | 24.5% | 20.4% | 11.7% | 90.1% | 15.1% | 3.3% |
| South Bend Precinct | 946 | 769 | 98.5% | 1.0% | 0.0% | 0.5% | $98k | 59.6% | 4.7% | 25.2% | 90.6% | 1.7% | 0.1% |
| South Plattsmouth Precinct | 2,306 | 1,805 | 87.0% | 6.3% | 0.1% | 0.5% | $77k | 29.8% | 20.8% | 19.9% | 82.0% | 5.7% | 1.5% |
| South Rock Bluff Precinct | 2,120 | 1,615 | 96.9% | 2.0% | 0.0% | 0.0% | $121k | 37.6% | 15.6% | 22.1% | 98.6% | 1.6% | 1.1% |
| Stove Creek Precinct | 1,002 | 757 | 94.7% | 1.5% | 0.0% | 0.0% | $86k | 34.4% | 18.1% | 23.0% | 88.2% | 9.0% | 2.6% |
| Tipton Precinct | 2,222 | 1,699 | 90.2% | 4.7% | 0.0% | 0.0% | $84k | 31.7% | 13.5% | 13.5% | 92.4% | 3.3% | 3.7% |
| Weeping Water 1st Ward | 29 | 19 | 89.0% | 4.7% | 0.0% | 0.0% | $84k | 22.3% | 15.3% | 16.1% | 73.9% | 6.2% | 3.7% |
| Weeping Water 2nd Ward | 714 | 487 | 90.4% | 3.9% | 0.0% | 0.0% | $84k | 24.0% | 15.5% | 17.2% | 77.6% | 7.1% | 3.2% |
| West Louisville Precinct | 1,104 | 840 | 87.7% | 3.4% | 0.0% | 0.8% | $99k | 39.6% | 14.1% | 18.9% | 85.7% | 5.2% | 0.5% |
| West Rock Bluff Precinct | 807 | 640 | 95.2% | 2.0% | 0.2% | 0.8% | $86k | 23.3% | 10.4% | 27.7% | 86.9% | 6.3% | 1.5% |
Seward: 17 precincts
| Precinct | Population | Voting-age pop. | % White non-Hisp. | % Hispanic | % Black | % Asian | Median income* | % Bachelor's+ | % 18-29 (of adults) | % 65+ | % Homeowners | % Below poverty | % Spanish at home (adults) |
|---|---|---|---|---|---|---|---|---|---|---|---|---|---|
| B Precinct | 431 | 321 | 96.6% | 1.6% | 0.4% | 0.2% | $84k | 33.4% | 5.1% | 12.8% | 90.9% | 7.4% | 3.4% |
| C Precinct | 893 | 676 | 95.1% | 1.6% | 0.2% | 0.1% | $90k | 28.4% | 12.2% | 17.9% | 84.4% | 6.1% | 2.0% |
| City of Seward Ward 1 | 543 | 393 | 94.9% | 4.2% | 0.0% | 0.0% | $85k | 46.0% | 16.8% | 20.2% | 70.6% | 5.4% | 1.6% |
| City of Seward Ward 2 | 1,905 | 1,422 | 91.3% | 8.4% | 0.0% | 0.0% | $70k | 36.9% | 14.8% | 28.8% | 58.9% | 3.8% | 2.4% |
| City of Seward Ward 3 | 440 | 360 | 92.3% | 3.3% | 1.2% | 1.5% | $79k | 37.3% | 51.8% | 10.1% | 54.5% | 15.9% | 1.5% |
| City of Seward Ward 4 | 843 | 699 | 91.4% | 5.6% | 0.8% | 0.7% | $87k | 48.0% | 54.7% | 12.2% | 63.3% | 12.2% | 1.3% |
| E Precinct | 467 | 358 | 93.7% | 1.6% | 0.0% | 0.1% | $96k | 23.9% | 18.4% | 22.9% | 77.9% | 4.8% | 0.7% |
| G Precinct | 4,034 | 3,144 | 94.9% | 1.9% | 0.7% | 0.9% | $86k | 39.9% | 34.4% | 14.3% | 66.0% | 10.8% | 1.5% |
| H Precinct | 1,008 | 740 | 93.8% | 3.2% | 0.0% | 0.6% | $101k | 38.9% | 2.5% | 20.2% | 91.7% | 4.1% | 0.3% |
| I Precinct | 991 | 768 | 97.3% | 1.6% | 0.0% | 0.2% | $98k | 32.0% | 11.7% | 18.0% | 79.5% | 5.8% | 0.5% |
| J Precinct | 1,571 | 1,193 | 92.0% | 1.7% | 2.6% | 0.8% | $82k | 26.0% | 25.5% | 15.6% | 69.6% | 6.3% | 2.0% |
| K Precinct | 1,186 | 906 | 95.0% | 1.7% | 0.4% | 0.6% | $81k | 28.1% | 16.9% | 18.4% | 76.5% | 8.5% | 2.5% |
| M-BX Precinct | 479 | 363 | 94.0% | 2.4% | 0.0% | 0.1% | $85k | 23.6% | 14.4% | 25.2% | 84.4% | 5.7% | 2.3% |
| M-CO Precinct | 652 | 485 | 94.3% | 3.5% | 0.0% | 0.0% | $70k | 23.1% | 8.9% | 28.2% | 92.7% | 7.0% | 4.5% |
| O Precinct | 1,789 | 1,381 | 92.4% | 1.9% | 2.6% | 0.6% | $81k | 25.4% | 25.9% | 15.9% | 66.7% | 6.6% | 2.3% |
| O-1 Precinct | 305 | 240 | 90.2% | 3.8% | 2.3% | 0.1% | $83k | 28.0% | 23.0% | 19.1% | 64.2% | 6.2% | 3.3% |
| O-2 Precinct | 41 | 31 | 91.6% | 0.5% | 3.9% | 1.3% | $74k | 21.4% | 33.7% | 11.7% | 63.5% | 7.0% | 2.0% |
Douglas: 5 precincts
| Precinct | Population | Voting-age pop. | % White non-Hisp. | % Hispanic | % Black | % Asian | Median income* | % Bachelor's+ | % 18-29 (of adults) | % 65+ | % Homeowners | % Below poverty | % Spanish at home (adults) |
|---|---|---|---|---|---|---|---|---|---|---|---|---|---|
| Ward 04 Precinct 14 | 4,415 | 2,909 | 9.2% | 60.5% | 23.1% | 3.2% | $67k | 5.2% | 22.6% | 6.1% | 43.5% | 34.9% | 46.3% |
| Ward 04 Precinct 16 | 4,263 | 2,998 | 46.0% | 46.7% | 6.5% | 0.0% | $68k | 10.5% | 27.4% | 9.0% | 84.2% | 9.8% | 36.9% |
| Ward 04 Precinct 17 | 2,132 | 1,398 | 35.4% | 52.6% | 5.1% | 0.0% | $84k | 17.2% | 18.6% | 12.5% | 88.3% | 8.6% | 28.2% |
| Ward 08 Precinct 04 | 1,480 | 1,128 | 81.1% | 18.4% | 0.0% | 0.1% | $115k | 25.0% | 11.1% | 12.2% | 87.8% | 2.8% | 8.8% |
| Ward 08 Precinct 06 | 441 | 357 | 82.2% | 10.9% | 1.0% | 0.0% | $113k | 50.0% | 14.8% | 21.0% | 81.8% | 0.8% | 8.8% |
Colfax: 5 precincts
| Precinct | Population | Voting-age pop. | % White non-Hisp. | % Hispanic | % Black | % Asian | Median income* | % Bachelor's+ | % 18-29 (of adults) | % 65+ | % Homeowners | % Below poverty | % Spanish at home (adults) |
|---|---|---|---|---|---|---|---|---|---|---|---|---|---|
| 1 Precinct | 1,935 | 1,350 | 28.2% | 57.8% | 12.3% | 1.0% | $86k | 9.7% | 15.9% | 13.3% | 53.7% | 10.3% | 32.0% |
| 2 Precinct | 3,507 | 2,214 | 31.9% | 57.5% | 1.9% | 0.0% | $88k | 12.4% | 15.2% | 11.5% | 77.2% | 5.1% | 43.8% |
| 3 Precinct | 2,800 | 2,039 | 30.5% | 66.3% | 2.3% | 0.1% | $93k | 12.6% | 33.2% | 7.7% | 81.0% | 6.1% | 55.5% |
| 4 Precinct | 1,711 | 1,255 | 92.1% | 4.9% | 0.0% | 0.0% | $72k | 20.5% | 12.3% | 25.7% | 87.6% | 8.2% | 2.5% |
| 5 Precinct | 711 | 546 | 96.1% | 3.0% | 0.1% | 0.0% | $89k | 30.6% | 8.7% | 22.4% | 86.1% | 6.7% | 2.9% |
Cuming: 7 precincts
| Precinct | Population | Voting-age pop. | % White non-Hisp. | % Hispanic | % Black | % Asian | Median income* | % Bachelor's+ | % 18-29 (of adults) | % 65+ | % Homeowners | % Below poverty | % Spanish at home (adults) |
|---|---|---|---|---|---|---|---|---|---|---|---|---|---|
| Bancroft, Cleveland & Neligh Precinct | 1,093 | 816 | 90.4% | 4.1% | 0.3% | 0.8% | $73k | 24.6% | 13.5% | 22.8% | 69.8% | 6.2% | 2.6% |
| Beemer & Logan Precinct | 888 | 717 | 89.9% | 5.4% | 0.7% | 1.1% | $74k | 20.9% | 14.8% | 23.3% | 66.3% | 8.3% | 3.9% |
| SW 4 | 861 | 564 | 94.1% | 1.2% | 1.9% | 0.0% | $84k | 32.1% | 9.7% | 14.7% | 46.6% | 3.0% | 0.1% |
| St. Charles Sherman Garfield & Cuming Precinct | 2,759 | 2,050 | 80.0% | 19.4% | 0.2% | 0.1% | $73k | 26.1% | 12.5% | 23.8% | 78.5% | 3.2% | 13.8% |
| West Point Ward 1 & 3 | 643 | 509 | 76.8% | 23.2% | 0.0% | 0.0% | $62k | 15.4% | 21.7% | 17.9% | 66.6% | 12.8% | 16.5% |
| West Point Ward 2 | 858 | 643 | 77.1% | 22.9% | 0.0% | 0.0% | $66k | 21.7% | 19.9% | 16.3% | 68.5% | 12.3% | 17.6% |
| Wisner, Blaine & Grant Precinct | 1,829 | 1,389 | 89.9% | 6.6% | 0.1% | 0.3% | $69k | 27.0% | 23.6% | 23.6% | 66.7% | 8.4% | 3.8% |
Butler: 11 precincts
| Precinct | Population | Voting-age pop. | % White non-Hisp. | % Hispanic | % Black | % Asian | Median income* | % Bachelor's+ | % 18-29 (of adults) | % 65+ | % Homeowners | % Below poverty | % Spanish at home (adults) |
|---|---|---|---|---|---|---|---|---|---|---|---|---|---|
| David City Ward 1 | 85 | 64 | 91.7% | 5.1% | 0.8% | 0.0% | $66k | 27.2% | 32.6% | 12.5% | 59.8% | 25.7% | 4.1% |
| David City Ward 2 | 53 | 39 | 89.7% | 6.2% | 0.2% | 0.0% | $68k | 34.3% | 17.7% | 21.4% | 70.7% | 10.6% | 3.4% |
| David City Ward 3 | 83 | 62 | 90.8% | 5.6% | 0.5% | 0.0% | $68k | 30.7% | 25.8% | 16.6% | 64.8% | 18.9% | 3.8% |
| Franklin-Bone Creek Precinct | 2,072 | 1,557 | 88.7% | 6.5% | 0.1% | 0.0% | $72k | 31.9% | 15.9% | 22.8% | 74.2% | 8.1% | 3.4% |
| Linwood-Skull Creek - Platte Precinct | 787 | 608 | 86.8% | 6.2% | 0.2% | 0.0% | $85k | 21.5% | 17.9% | 22.9% | 79.9% | 7.7% | 2.9% |
| Oak Creek-Center Precinct | 961 | 772 | 91.8% | 5.1% | 0.1% | 0.0% | $83k | 25.7% | 12.6% | 21.8% | 81.3% | 7.2% | 2.5% |
| Plum Creek-Richardson Precinct | 652 | 550 | 93.9% | 4.2% | 0.1% | 0.0% | $89k | 21.3% | 9.9% | 21.4% | 86.9% | 6.0% | 1.9% |
| Read-Ulysses Precinct | 446 | 335 | 94.7% | 1.0% | 0.9% | 0.0% | $118k | 19.4% | 13.8% | 21.3% | 87.8% | 7.0% | 0.1% |
| Savannah-Alexis Precinct | 1,288 | 947 | 84.2% | 14.6% | 0.0% | 0.0% | $75k | 13.8% | 10.4% | 22.2% | 88.7% | 9.0% | 13.3% |
| Summit-Reading Precinct | 526 | 382 | 94.3% | 0.5% | 0.3% | 0.0% | $98k | 22.2% | 7.2% | 21.0% | 92.4% | 4.3% | 0.4% |
| Union-Olive Precinct | 1,471 | 1,091 | 92.1% | 4.2% | 0.6% | 0.0% | $96k | 24.6% | 24.0% | 15.6% | 71.2% | 18.3% | 3.5% |
Stanton: 10 precincts
| Precinct | Population | Voting-age pop. | % White non-Hisp. | % Hispanic | % Black | % Asian | Median income* | % Bachelor's+ | % 18-29 (of adults) | % 65+ | % Homeowners | % Below poverty | % Spanish at home (adults) |
|---|---|---|---|---|---|---|---|---|---|---|---|---|---|
| BST precinct (Stanton County) | 622 | 487 | 90.8% | 5.4% | 0.0% | 2.0% | $78k | 29.6% | 15.4% | 27.2% | 84.6% | 11.6% | 3.9% |
| DMR precinct (Stanton County) | 176 | 133 | 98.8% | 1.1% | 0.0% | 0.0% | $94k | 16.8% | 19.8% | 18.9% | 83.0% | 3.1% | 0.0% |
| DWY precinct (Stanton County) | 514 | 380 | 83.0% | 17.0% | 0.0% | 0.0% | $69k | 31.6% | 5.4% | 14.7% | 88.0% | 6.9% | 13.8% |
| ELK precinct (Stanton County) | 495 | 366 | 86.3% | 11.3% | 0.3% | 0.0% | $72k | 26.7% | 13.0% | 18.2% | 78.4% | 8.2% | 7.0% |
| HMR precinct (Stanton County) | 440 | 334 | 95.2% | 0.8% | 0.0% | 3.4% | $87k | 20.5% | 19.6% | 22.2% | 78.2% | 8.5% | 0.0% |
| PK precinct (Stanton County) | 475 | 362 | 90.5% | 0.8% | 0.0% | 7.5% | $78k | 25.5% | 19.0% | 26.0% | 72.7% | 15.1% | 0.2% |
| SBE precinct (Stanton County) | 303 | 224 | 83.0% | 17.0% | 0.0% | 0.0% | $69k | 31.6% | 5.4% | 14.7% | 88.0% | 6.9% | 13.8% |
| SBW precinct (Stanton County) | 1,245 | 910 | 88.2% | 6.8% | 0.0% | 0.0% | $82k | 16.3% | 14.6% | 15.2% | 77.3% | 8.0% | 4.2% |
| STN precinct (Stanton County) | 1,349 | 1,016 | 88.5% | 6.0% | 0.5% | 0.2% | $73k | 25.0% | 19.8% | 24.9% | 70.5% | 11.5% | 0.8% |
| UCB precinct (Stanton County) | 175 | 133 | 98.8% | 1.0% | 0.0% | 0.0% | $94k | 16.8% | 19.8% | 18.9% | 83.0% | 3.1% | 0.0% |
Polk: 3 precincts
| Precinct | Population | Voting-age pop. | % White non-Hisp. | % Hispanic | % Black | % Asian | Median income* | % Bachelor's+ | % 18-29 (of adults) | % 65+ | % Homeowners | % Below poverty | % Spanish at home (adults) |
|---|---|---|---|---|---|---|---|---|---|---|---|---|---|
| North Osceola Precinct | 1,136 | 963 | 95.9% | 2.8% | 0.0% | 0.3% | $72k | 20.0% | 15.2% | 22.6% | 78.9% | 3.5% | 3.7% |
| South Canada Precinct | 1,081 | 792 | 85.2% | 10.0% | 0.0% | 0.1% | $87k | 18.3% | 21.1% | 17.7% | 81.0% | 7.7% | 4.2% |
| South Osceola Precinct | 752 | 611 | 86.2% | 8.6% | 0.1% | 0.9% | $83k | 24.9% | 21.5% | 24.3% | 74.9% | 10.5% | 7.0% |
Antelope: 1 precincts
| Precinct | Population | Voting-age pop. | % White non-Hisp. | % Hispanic | % Black | % Asian | Median income* | % Bachelor's+ | % 18-29 (of adults) | % 65+ | % Homeowners | % Below poverty | % Spanish at home (adults) |
|---|---|---|---|---|---|---|---|---|---|---|---|---|---|
| Tilden 1st Ward | 2 | 2 | 94.1% | 1.6% | 0.5% | 1.1% | $73k | 13.6% | 20.9% | 25.5% | 82.7% | 14.9% | 0.6% |
*Median income is approximate (see note above). ACS 2020-2024 5-year.
Nonpartisan voter information. GOTV Polling does not endorse any candidate.