
Tennessee's 4th Congressional District
U.S. House · Tennessee · District 4 · General election: Tuesday, November 3, 2026
Candidates on the November 3 ballot
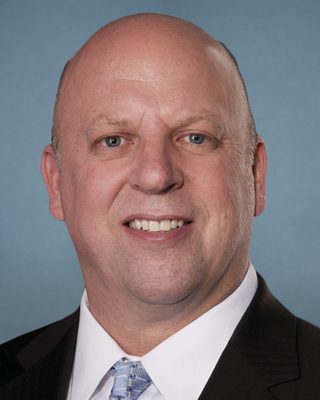 Scott DesJarlaisRepublicanPhoto: U.S. Congress
- Victoria BroderickDemocratic
- Jacob Kristopher AndersIndependent
- Clay FairclothIndependent
Source: Tennessee Secretary of State, Division of Elections, certified candidate lists, November 3, 2026, certified list (list published 2026-09-24; retrieved 2026-10-30). Order of names does not reflect ballot order. Incumbent tags appear only where the official list marks incumbents. Photos come from the Candidate Alerts database where one is on file; otherwise initials are shown.
Federal campaign finance filings for this seat: FEC election page (FEC registration is not the same as ballot qualification).
Certified candidates
- Scott DesJarlais RepublicanIncumbent @DesJarlaisTN04
- Victoria Broderick Democratic
- Clay Faircloth Independent
- Jacob Kristopher Anders Independent
Certified candidate list from Candidate Alerts, as of 2026-09-24, based on Tennessee Secretary of State, Division of Elections. Includes candidates the database marks as on the November 3 ballot. Incumbent tags here follow the database.
Past election results
Held under the district lines in effect at the time. Those boundaries differ from the 2026 district.
| Candidate | Party | Votes | Share |
|---|---|---|---|
| Scott DesJarlais | Republican | 39,503 | 65.9% |
| Thomas E. Davis | Republican | 9,781 | 16.3% |
| Harold "Rocky" Jones | Republican | 6,065 | 10.1% |
| Joshua James | Republican | 4,598 | 7.7% |
| Total | 59,947 |
Source: Tennessee Secretary of State, certified results by precinct (All by Precinct workbook), August 6, 2026 primary. Status: Certified (Tennessee Secretary of State official results); every contest reconciles county by county, candidate by candidate, to the SOS Republican/Democratic Primary by County reports (20260806RepublicanPrimarybyCounty.pdf, 20260806DemocraticPrimarybyCounty.pdf)
Held under the district lines in effect at the time. Those boundaries differ from the 2026 district.
| Candidate | Party | Votes | Share |
|---|---|---|---|
| Victoria Broderick | Democratic | 12,432 | 37.9% |
| Mike Cortese | Democratic | 9,226 | 28.1% |
| Joyce E. Neal | Democratic | 7,230 | 22.0% |
| Tim Lanier | Democratic | 2,458 | 7.5% |
| Cliff Huffman | Democratic | 1,480 | 4.5% |
| Total | 32,826 |
Source: Tennessee Secretary of State, certified results by precinct (All by Precinct workbook), August 6, 2026 primary. Status: Certified (Tennessee Secretary of State official results); every contest reconciles county by county, candidate by candidate, to the SOS Republican/Democratic Primary by County reports (20260806RepublicanPrimarybyCounty.pdf, 20260806DemocraticPrimarybyCounty.pdf)
Held under the district lines in effect at the time. Those boundaries differ from the 2026 district.
| Candidate | Party | Votes | Share |
|---|---|---|---|
| Scott DesJarlais | Republican | 219,133 | 70.0% |
| Victoria Isabel Broderick | Democratic | 83,832 | 26.8% |
| Keith Nolan | Independent | 5,601 | 1.8% |
| Earnest Ensley | Independent | 4,689 | 1.5% |
| Total | 313,255 |
Source: Tennessee Secretary of State, certified results by precinct (All by Precinct workbook). Status: Certified (Tennessee Secretary of State official results)
Held under the district lines in effect at the time. Those boundaries differ from the 2026 district.
| Candidate | Party | Votes | Share |
|---|---|---|---|
| Scott DesJarlais | Republican | 122,401 | 70.6% |
| Wayne Steele | Democratic | 44,648 | 25.7% |
| Mike Winton | Independent | 2,834 | 1.6% |
| Clyde Benson | Independent | 1,806 | 1.0% |
| David Leighton Jones | Independent | 708 | 0.4% |
| Tharon Chandler | Independent | 585 | 0.3% |
| Joseph "Krishnadas" Magyer | Independent | 455 | 0.3% |
| Total | 173,437 |
Source: Tennessee Secretary of State, certified results by precinct (All by Precinct workbook). Status: Certified (Tennessee Secretary of State official results)
Held under the district lines in effect at the time. Those boundaries differ from the 2026 district.
| Candidate | Party | Votes | Share |
|---|---|---|---|
| Scott DesJarlais | Republican | 223,802 | 66.7% |
| Christopher J. Hale | Democratic | 111,908 | 33.3% |
| Total | 335,710 |
Source: Tennessee Secretary of State, certified results by precinct (All by Precinct workbook). Status: Certified (Tennessee Secretary of State official results)
Certified results from state or county election authorities, as compiled in the Candidate Alerts precinct results database (public API candidatealerts.com/api/district-results). Totals are sums of certified precinct and county-level rows.
Demographics
2020 Census demographics by district are not yet published in this data set.
0 of 193 precincts are above 50%, and 10 are above 25%. Source: Census American Community Survey 2020-2024 5-year block groups, allocated to current precinct shapes by area.
Poll status
Map
Share of adults (18+) who speak Spanish at home, by precinct. Census ACS 2020-2024 5-year estimates on the current precinct layer. Hover a precinct for its value.
Tennessee votes on new congressional district lines in 2026. The Census 119th Congress boundary file does not reflect the new lines, so only the state outline is shown here.
Precinct map: past elections and demographics
Choose a layer above. Hover a precinct for its values.
Precinct results
Certified precinct results on current precinct shapes, grouped by county. 243 precincts. "(part)" marks a precinct only partly inside this district; its full vote is shown, so district sums are approximate and are not the official district total. Elections were held under older lines and are shown on the 2026 district.
| County | 2024 President | 2022 Governor | 2020 President | |||
|---|---|---|---|---|---|---|
| Margin | Votes | Margin | Votes | Margin | Votes | |
| Rutherford | R+22.3 | 140,495 | R+26.7 | 71,634 | R+15.9 | 128,516 |
| Davidson | D+26.1 | 69,880 | D+26.5 | 39,993 | D+30.9 | 73,879 |
| Coffee | R+55.9 | 23,810 | R+56.5 | 13,616 | R+50.3 | 24,137 |
| Franklin | R+53.2 | 19,728 | R+52.1 | 11,516 | R+47.8 | 19,102 |
| Warren | R+56.1 | 17,015 | R+53.1 | 8,857 | R+49.6 | 15,986 |
| Marion | R+55.1 | 13,485 | R+56.0 | 7,447 | R+50.2 | 12,811 |
| Sequatchie | R+66.3 | 7,890 | R+70.1 | 4,341 | R+62.9 | 7,247 |
| Grundy | R+69.1 | 5,792 | R+64.6 | 3,071 | R+65.4 | 5,333 |
| Cannon | R+66.6 | 6,249 | R+64.3 | 3,440 | - | - |
| Bledsoe | R+70.5 | 6,191 | R+73.8 | 3,408 | - | - |
| Van Buren | R+67.2 | 3,265 | R+67.7 | 1,898 | R+61.6 | 2,920 |
| All counties (approx.) | R+23.5 | 313,800 | R+24.9 | 169,221 | R+14.9 | 289,931 |
Rutherford: 49 precincts
| Precinct | 2024 President | 2022 Governor | 2020 President | |||
|---|---|---|---|---|---|---|
| Margin | Votes | Margin | Votes | Margin | Votes | |
| 1-1 | D+16.4 | 4,422 | D+4.7 | 1,994 | D+31.8 | 4,749 |
| 10-1 (part) | R+7.8 | 3,415 | R+12.3 | 1,809 | R+26.0 | 4,038 |
| 11-1 (part) | R+7.0 | 2,522 | R+11.9 | 1,234 | R+13.5 | 5,658 |
| 12-1 | R+10.2 | 3,287 | R+16.7 | 1,667 | R+56.6 | 1,220 |
| 12-2 | R+32.9 | 1,513 | R+42.3 | 931 | R+53.6 | 2,187 |
| 13-1 | R+14.4 | 6,421 | R+17.4 | 3,183 | R+40.9 | 2,171 |
| 14-1 | R+10.3 | 614 | R+10.3 | 349 | - | - |
| 14-2 | R+26.8 | 8,178 | R+30.9 | 4,646 | R+35.5 | 4,056 |
| 15-1 | R+16.7 | 5,212 | R+22.0 | 2,857 | - | - |
| 15-1 | - | - | - | - | R+17.1 | 3,670 |
| 15-2 | R+26.6 | 3,537 | R+30.3 | 2,142 | - | - |
| 15-2 | - | - | - | - | D+0.4 | 3,044 |
| 16-1 (part) | D+16.1 | 1,986 | D+19.7 | 1,043 | R+3.5 | 2,650 |
| 16-1 | - | - | - | - | D+14.0 | 2,705 |
| 16-2 | R+9.9 | 2,909 | R+16.0 | 1,428 | - | - |
| 16-2 | - | - | - | - | R+3.4 | 595 |
| 16-3 | - | - | - | - | D+1.3 | 3,064 |
| 17-1 | D+16.4 | 3,563 | D+6.1 | 1,542 | D+2.1 | 1,492 |
| 17-1 | - | - | - | - | D+21.5 | 2,330 |
| 17-2 | - | - | - | - | D+46.0 | 535 |
| 17-3 | - | - | - | - | D+55.7 | 255 |
| 18-1 | D+32.9 | 1,502 | D+37.7 | 706 | R+10.4 | 2,021 |
| 18-1 | - | - | - | - | D+24.0 | 2,662 |
| 18-2 | R+19.2 | 3,938 | R+28.7 | 2,179 | D+13.3 | 886 |
| 18-2 | - | - | - | - | R+22.6 | 2,690 |
| 19-1 | R+26.4 | 9,532 | R+30.6 | 4,731 | R+11.5 | 2,486 |
| 19-1 (part) | - | - | - | - | R+30.0 | 3,075 |
| 19-2 | - | - | - | - | R+11.0 | 3,388 |
| 2-1 | R+50.5 | 6,580 | R+54.9 | 3,454 | R+48.5 | 3,066 |
| 2-2 | R+41.4 | 2,329 | R+42.8 | 1,126 | R+39.3 | 3,527 |
| 20-1 | R+14.4 | 6,742 | R+15.2 | 3,158 | D+4.8 | 3,575 |
| 20-1 | - | - | - | - | R+29.3 | 6,214 |
| 20-2 | - | - | - | - | R+13.9 | 6,066 |
| 21-1 | R+2.6 | 1,588 | R+10.7 | 929 | R+24.7 | 3,908 |
| 21-1 | - | - | - | - | D+33.1 | 2,899 |
| 21-2 | R+1.4 | 4,508 | R+4.4 | 2,007 | R+28.5 | 4,680 |
| 21-2 | - | - | - | - | R+16.7 | 2,840 |
| 3-1 | R+64.0 | 383 | R+61.6 | 198 | R+59.3 | 1,313 |
| 3-2 | R+33.9 | 6,737 | R+37.6 | 3,412 | R+46.9 | 3,640 |
| 4-1 | R+29.8 | 6,918 | R+31.7 | 3,793 | R+19.9 | 2,760 |
| 4-2 | R+26.7 | 469 | R+32.4 | 207 | R+43.7 | 955 |
| 5-1 | D+5.5 | 4,311 | R+5.6 | 2,123 | D+6.6 | 1,389 |
| 6-1 | R+57.2 | 1,956 | R+54.2 | 1,103 | R+24.2 | 3,376 |
| 6-2 | R+40.7 | 7,454 | R+42.5 | 3,435 | - | - |
| 7-1 | R+17.7 | 7,799 | R+21.6 | 4,035 | R+2.9 | 2,198 |
| 7-1 | - | - | - | - | R+13.2 | 3,745 |
| 8-1 | R+45.9 | 9,735 | R+49.8 | 5,105 | D+23.6 | 2,370 |
| 8-1 | - | - | - | - | R+39.4 | 4,369 |
| 9-1 (part) | R+36.6 | 10,435 | R+35.7 | 5,108 | R+46.9 | 3,999 |
Davidson: 72 precincts
| Precinct | 2024 President | 2022 Governor | 2020 President | |||
|---|---|---|---|---|---|---|
| Margin | Votes | Margin | Votes | Margin | Votes | |
| 04-1 | D+19.9 | 2,816 | D+24.0 | 1,670 | - | - |
| 04-2 | D+0.5 | 4,215 | R+3.3 | 2,898 | - | - |
| 04-2 | - | - | - | - | D+27.6 | 1,583 |
| 04-4 | - | - | - | - | R+0.2 | 3,608 |
| 08-1 | D+39.4 | 3,604 | D+45.8 | 1,557 | - | - |
| 08-2 | D+23.2 | 431 | D+38.1 | 257 | - | - |
| 08-3 | D+41.2 | 2,647 | D+37.5 | 1,522 | - | - |
| 12-2 (part) | D+34.8 | 1,916 | D+35.4 | 931 | - | - |
| 12-2 | - | - | - | - | R+7.8 | 3,436 |
| 12-3 | R+1.1 | 3,577 | R+7.3 | 2,399 | - | - |
| 12-4 | R+28.9 | 384 | R+37.1 | 272 | - | - |
| 12-5 | - | - | - | - | D+100.0 | 4 |
| 13-1 | D+38.9 | 1,118 | D+40.4 | 621 | - | - |
| 13-1 | - | - | - | - | D+46.6 | 1,417 |
| 13-2 | D+28.1 | 802 | D+35.7 | 488 | - | - |
| 13-2 | - | - | - | - | D+25.3 | 505 |
| 13-3 | D+15.8 | 1,141 | D+21.8 | 707 | D+81.1 | 106 |
| 13-3 | - | - | - | - | D+19.1 | 3,233 |
| 13-4 | D+38.0 | 129 | D+42.5 | 87 | - | - |
| 13-4 | - | - | - | - | D+17.2 | 267 |
| 13-5 | D+21.8 | 2,495 | D+20.7 | 1,461 | D+23.9 | 460 |
| 14-1 (part) | - | - | - | - | D+21.8 | 2,989 |
| 14-3 | - | - | - | - | D+40.0 | 653 |
| 14-4 | - | - | - | - | D+34.1 | 44 |
| 16-2 | D+30.1 | 2,699 | D+42.6 | 1,665 | - | - |
| 16-3 (part) | - | - | - | - | D+38.8 | 3,918 |
| 16-4 | D+12.6 | 413 | D+19.1 | 283 | - | - |
| 16-5 | - | - | - | - | D+100.0 | 1 |
| 26-1 | - | - | - | - | D+45.3 | 1,352 |
| 26-3 | - | - | - | - | D+18.5 | 2,579 |
| 26-4 | D+14.2 | 2,288 | D+18.4 | 1,541 | D+18.8 | 496 |
| 27-1 | D+21.3 | 1,104 | D+29.4 | 626 | D+29.8 | 1,224 |
| 27-1 | - | - | - | - | D+30.3 | 1,725 |
| 27-2 | - | - | - | - | D+23.9 | 1,884 |
| 27-3 | D+14.3 | 2,421 | D+14.2 | 1,489 | D+51.6 | 900 |
| 27-3 | - | - | - | - | D+19.9 | 2,009 |
| 27-4 | D+19.0 | 1,198 | D+17.1 | 750 | D+40.6 | 2,009 |
| 28-1 | D+16.7 | 12 | D+14.3 | 7 | D+20.0 | 3,390 |
| 28-1 | - | - | - | - | D+41.7 | 2,061 |
| 28-2 | D+17.3 | 434 | D+8.3 | 229 | D+4.6 | 4,063 |
| 28-2 | - | - | - | - | D+50.6 | 1,659 |
| 28-3 | D+29.5 | 1,237 | D+29.4 | 666 | D+63.7 | 2,473 |
| 28-3 | - | - | - | - | D+43.6 | 1,221 |
| 28-4 | D+52.5 | 890 | D+49.2 | 461 | D+72.4 | 653 |
| 28-5 | D+43.0 | 1,495 | D+53.4 | 773 | D+52.6 | 1,799 |
| 29-1 | D+48.0 | 1,263 | D+43.4 | 822 | D+62.4 | 2,096 |
| 29-1 | - | - | - | - | D+36.9 | 1,010 |
| 29-2 | D+54.2 | 1,550 | D+57.2 | 762 | R+37.8 | 360 |
| 29-2 | - | - | - | - | D+43.5 | 2,124 |
| 29-3 | D+39.0 | 1,114 | D+42.7 | 658 | D+39.0 | 2,698 |
| 29-3 | - | - | - | - | D+50.4 | 927 |
| 29-4 | D+32.0 | 2,250 | D+32.9 | 1,439 | D+45.8 | 4,664 |
| 29-4 | - | - | - | - | D+37.0 | 2,769 |
| 30-1 | D+20.9 | 1,141 | D+28.0 | 664 | D+29.4 | 1,528 |
| 30-1 | - | - | - | - | D+37.5 | 973 |
| 30-2 | D+33.7 | 928 | D+40.3 | 484 | - | - |
| 30-2 | - | - | - | - | D+30.6 | 1,009 |
| 30-3 | D+32.8 | 1,143 | D+34.5 | 658 | - | - |
| 31-1 | D+36.7 | 245 | D+56.7 | 141 | - | - |
| 31-2 | D+18.1 | 3,215 | D+21.5 | 1,926 | - | - |
| 31-3 | D+4.5 | 2,800 | D+6.4 | 1,551 | - | - |
| 31-4 | D+31.4 | 2,130 | D+36.4 | 1,163 | - | - |
| 32-1 | D+59.1 | 457 | D+56.5 | 191 | - | - |
| 32-2 | D+59.1 | 942 | D+68.8 | 333 | - | - |
| 32-3 | D+52.7 | 2,352 | D+58.8 | 1,149 | - | - |
| 32-4 | D+56.2 | 1,702 | D+58.2 | 890 | - | - |
| 33-1 | R+1.2 | 2,879 | R+4.7 | 1,601 | - | - |
| 33-2 | D+36.4 | 1,748 | D+38.7 | 877 | - | - |
| 33-3 | R+2.1 | 48 | D+7.4 | 27 | - | - |
| 33-4 | D+45.0 | 1,276 | D+45.8 | 589 | - | - |
| 33-5 | D+46.0 | 363 | D+59.4 | 212 | - | - |
| 33-6 | D+19.9 | 868 | D+29.6 | 496 | - | - |
Coffee: 24 precincts
| Precinct | 2024 President | 2022 Governor | 2020 President | |||
|---|---|---|---|---|---|---|
| Margin | Votes | Margin | Votes | Margin | Votes | |
| 1-1 First Baptist | R+47.4 | 1,942 | R+48.8 | 956 | R+44.1 | 1,091 |
| 16 Lion's Club | - | - | - | - | R+39.3 | 1,558 |
| 17 National Guard Armory | - | - | - | - | R+33.4 | 590 |
| 18 First Christian | - | - | - | - | R+34.9 | 1,116 |
| 19 CD Stamps Center | - | - | - | - | R+20.7 | 705 |
| 2-1 Trinity Baptist | R+46.5 | 2,675 | - | - | R+45.3 | 688 |
| 20 Sr Citizens Center | - | - | - | - | R+37.1 | 1,155 |
| 21 Wilson Ave | - | - | - | - | R+36.7 | 1,223 |
| 3-1 Rescue Squad | R+63.2 | 1,969 | R+51.7 | 1,249 | R+44.9 | 1,324 |
| 3-2 Lakewood | R+65.9 | 1,104 | R+63.1 | 1,100 | R+40.6 | 1,231 |
| 4-1 New Union | R+67.9 | 1,753 | R+66.7 | 580 | R+61.0 | 1,104 |
| 4-2 Forest Mill | R+67.9 | 1,320 | R+64.9 | 960 | R+59.2 | 1,020 |
| 5-1 Hickerson | R+65.8 | 1,872 | R+68.4 | 721 | R+63.8 | 1,135 |
| 5-2 Blanton's Chapel | R+66.3 | 1,622 | R+63.0 | 1,061 | R+66.4 | 1,309 |
| 6-1 Conference | R+66.3 | 1,504 | R+64.5 | 991 | R+63.9 | 783 |
| 6-2 Hillsboro | R+67.5 | 1,420 | R+66.3 | 799 | R+59.1 | 430 |
| 6-2 Hillsboro | - | - | R+69.2 | 746 | R+58.6 | 1,121 |
| 7-2 Wesley Heights | R+39.2 | 804 | R+41.8 | 555 | R+58.3 | 1,144 |
| 8-1 Lion's Club | R+47.0 | 1,128 | R+37.7 | 379 | R+63.2 | 1,284 |
| 8-2 Grace Baptist | R+44.1 | 1,933 | - | - | R+56.6 | 775 |
| 9-1 D.W. Wilson CC | R+39.2 | 1,410 | R+48.4 | 708 | R+69.9 | 551 |
| 9-1 Wilson Ave | - | - | R+40.9 | 778 | R+60.2 | 1,300 |
| 9-2 Cedar Lane | R+42.5 | 1,354 | R+48.9 | 1,198 | - | - |
| 9-2 Cedar Lane | - | - | R+49.1 | 835 | R+44.1 | 1,500 |
Franklin: 18 precincts
| Precinct | 2024 President | 2022 Governor | 2020 President | |||
|---|---|---|---|---|---|---|
| Margin | Votes | Margin | Votes | Margin | Votes | |
| 1-1 Annex | R+47.4 | 2,577 | R+50.2 | 1,430 | R+40.5 | 2,454 |
| 2-1 Clark Memorial | R+51.1 | 2,630 | R+54.6 | 1,557 | R+45.7 | 2,542 |
| 3-1 Broadview | R+70.4 | 1,138 | R+69.8 | 703 | R+64.4 | 933 |
| 3-2 Huntland | R+74.2 | 920 | R+72.4 | 489 | R+66.1 | 882 |
| 3-3 Walnut Grove | R+64.1 | 487 | R+61.9 | 281 | R+60.9 | 455 |
| 4-1 Belvidere | R+65.7 | 580 | R+67.1 | 319 | R+57.8 | 512 |
| 4-2 Cowan | R+57.0 | 1,290 | R+57.5 | 772 | R+51.6 | 1,313 |
| 4-3 Liberty | R+75.1 | 694 | R+73.4 | 429 | R+72.1 | 645 |
| 5-1 Keith Springs | R+68.1 | 207 | R+71.7 | 127 | R+61.6 | 185 |
| 5-2 Sewanee | D+37.7 | 1,161 | D+44.8 | 878 | D+41.2 | 1,238 |
| 5-3 Sherwood | R+75.3 | 150 | R+75.8 | 95 | R+77.8 | 162 |
| 6-1 Alto/Oak Grove | R+63.5 | 824 | R+62.1 | 486 | R+60.6 | 751 |
| 6-2 Capitol Hill | R+66.9 | 815 | R+67.5 | 455 | R+64.6 | 828 |
| 6-3 UTSI | R+58.5 | 850 | R+57.1 | 445 | R+49.1 | 888 |
| 7-1 North Lake | R+59.2 | 1,607 | R+58.9 | 948 | R+57.3 | 1,580 |
| 7-2 CG/Winchester Springs | R+67.6 | 1,430 | R+68.5 | 851 | R+64.1 | 1,442 |
| 8-1 Decherd | R+37.7 | 987 | R+43.9 | 456 | R+32.8 | 935 |
| 8-2 Estill Springs | R+59.1 | 1,381 | R+58.9 | 795 | R+57.0 | 1,357 |
Warren: 20 precincts
| Precinct | 2024 President | 2022 Governor | 2020 President | |||
|---|---|---|---|---|---|---|
| Margin | Votes | Margin | Votes | Margin | Votes | |
| 1-1 Christ Community Chur | R+32.8 | 1,256 | R+35.8 | 710 | R+35.2 | 1,117 |
| 10-1 Centertown UMC | R+58.3 | 846 | R+54.1 | 458 | R+52.1 | 975 |
| 10-2 Centertown CIC | R+65.6 | 726 | R+51.0 | 367 | R+56.0 | 629 |
| 11-1 Midway | R+65.5 | 438 | R+67.2 | 259 | R+62.4 | 447 |
| 11-2 Hwy 56 North | R+65.4 | 1,061 | R+65.7 | 548 | R+57.8 | 911 |
| 12-1 Highway Dept | R+63.1 | 636 | R+62.9 | 318 | R+53.4 | 599 |
| 12-2 Lucky | R+59.6 | 670 | R+54.8 | 341 | R+55.9 | 585 |
| 2-1 Courthouse | R+48.5 | 895 | R+40.4 | 596 | R+40.2 | 1,043 |
| 2-2 Airport | R+63.7 | 804 | R+59.3 | 398 | R+54.8 | 775 |
| 3-1 Westwood | R+57.6 | 634 | R+54.0 | 350 | R+46.8 | 710 |
| 3-2 Smartt | R+60.2 | 976 | R+58.6 | 497 | R+49.9 | 740 |
| 4-1 TSU | R+48.8 | 1,080 | R+43.5 | 563 | R+40.2 | 1,016 |
| 5-1 Mall | R+47.0 | 742 | R+49.0 | 339 | R+37.7 | 716 |
| 5-2 Chamber | R+41.4 | 333 | R+45.5 | 154 | R+39.5 | 309 |
| 6-1 Redemption Center | R+48.0 | 1,022 | R+38.8 | 508 | R+38.3 | 940 |
| 7-1 Friendship | R+59.2 | 1,546 | R+58.8 | 701 | R+50.4 | 1,356 |
| 8-1 Shellsford | R+62.5 | 1,243 | R+63.0 | 616 | R+63.0 | 1,086 |
| 8-3 Bonner | R+64.0 | 486 | R+64.3 | 269 | R+62.0 | 413 |
| 9-1 Morrison | R+58.7 | 1,218 | R+51.7 | 606 | R+55.0 | 1,166 |
| 9-2 Viola | R+64.5 | 403 | R+67.2 | 259 | R+55.2 | 453 |
Marion: 16 precincts
| Precinct | 2024 President | 2022 Governor | 2020 President | |||
|---|---|---|---|---|---|---|
| Margin | Votes | Margin | Votes | Margin | Votes | |
| Elder Mountain | R+41.2 | 187 | R+55.3 | 123 | R+44.3 | 194 |
| Foster Falls | R+73.7 | 620 | R+75.9 | 328 | R+68.4 | 554 |
| Haletown-Ladd | R+59.1 | 474 | R+66.7 | 270 | R+56.8 | 486 |
| Jasper | R+53.3 | 3,213 | R+55.8 | 1,707 | R+45.8 | 2,829 |
| Kimball | R+51.2 | 971 | R+47.8 | 578 | R+48.3 | 943 |
| Lodge | R+44.5 | 209 | R+47.8 | 134 | R+50.2 | 203 |
| Monteagle | R+34.0 | 674 | R+30.2 | 490 | R+31.0 | 797 |
| New Hope | R+62.0 | 639 | R+66.3 | 350 | R+61.7 | 619 |
| Orme | R+43.9 | 66 | R+70.0 | 40 | R+46.4 | 56 |
| Powells Crossroads | R+68.9 | 1,349 | R+71.7 | 735 | R+67.9 | 1,328 |
| River Canyon | R+62.3 | 268 | R+61.7 | 154 | R+59.2 | 282 |
| Sequatchie | R+66.6 | 1,086 | R+71.1 | 582 | R+66.0 | 1,014 |
| Shellmound | R+58.7 | 537 | R+59.2 | 262 | R+56.7 | 499 |
| South Pittsburg | R+32.7 | 1,769 | R+30.5 | 938 | R+17.9 | 1,609 |
| Walden's Ridge | R+59.9 | 287 | R+53.2 | 171 | R+53.9 | 280 |
| Whitwell | R+67.9 | 1,136 | R+68.5 | 585 | R+64.5 | 1,118 |
Sequatchie: 9 precincts
| Precinct | 2024 President | 2022 Governor | 2020 President | |||
|---|---|---|---|---|---|---|
| Margin | Votes | Margin | Votes | Margin | Votes | |
| 1 Lewis Chapel | R+68.0 | 1,122 | R+76.9 | 645 | R+67.4 | 992 |
| 2 Cagle | R+64.5 | 805 | R+67.5 | 455 | R+68.3 | 778 |
| 3 Courthouse | R+69.6 | 708 | R+67.0 | 382 | R+59.2 | 625 |
| 4 Electric Co-op | R+65.3 | 518 | R+68.0 | 266 | R+58.7 | 569 |
| 5 Chapel Hill | R+72.8 | 1,138 | R+73.1 | 651 | R+67.0 | 1,068 |
| 6 Daus | R+69.2 | 721 | R+77.8 | 347 | R+67.7 | 654 |
| 7 American Legion | R+69.6 | 750 | R+63.9 | 355 | R+62.7 | 713 |
| 8 Lone Oak | R+57.0 | 1,064 | R+60.2 | 618 | R+54.4 | 941 |
| 9 Fredonia | R+62.0 | 1,064 | R+73.3 | 622 | R+59.0 | 907 |
Grundy: 9 precincts
| Precinct | 2024 President | 2022 Governor | 2020 President | |||
|---|---|---|---|---|---|---|
| Margin | Votes | Margin | Votes | Margin | Votes | |
| Altamont | R+73.9 | 1,013 | R+73.7 | 463 | R+69.2 | 866 |
| Beersheba Springs | R+70.0 | 320 | R+61.8 | 199 | R+67.5 | 326 |
| Central | R+69.3 | 293 | R+62.5 | 144 | R+61.0 | 264 |
| Coalmont | R+79.7 | 632 | R+72.6 | 310 | R+73.9 | 533 |
| Collins | R+69.9 | 143 | R+76.9 | 91 | R+78.8 | 151 |
| Gruetli-Laager | R+75.3 | 998 | R+72.9 | 495 | R+73.5 | 936 |
| Monteagle | R+49.0 | 670 | R+39.5 | 428 | R+49.5 | 628 |
| Palmer | R+74.0 | 323 | R+78.2 | 147 | R+58.9 | 304 |
| Tracy City | R+64.7 | 1,400 | R+61.6 | 794 | R+61.8 | 1,325 |
Cannon: 7 precincts
| Precinct | 2024 President | 2022 Governor | 2020 President | |||
|---|---|---|---|---|---|---|
| Margin | Votes | Margin | Votes | Margin | Votes | |
| 1-1 Westside | R+68.9 | 1,555 | R+67.0 | 910 | - | - |
| 2-1 Auburntown | R+60.4 | 555 | R+60.0 | 345 | - | - |
| 2-2 Gassaway | R+60.1 | 233 | R+49.7 | 143 | - | - |
| 2-3 Pleasant Ridge | R+62.1 | 401 | R+56.7 | 231 | - | - |
| 3-2 Woodland | R+74.6 | 1,363 | R+75.8 | 722 | - | - |
| 4-1 Eastside | R+72.6 | 1,159 | R+72.6 | 621 | - | - |
| 5-1 Woodbury | R+51.9 | 983 | R+41.5 | 468 | - | - |
Bledsoe: 12 precincts
| Precinct | 2024 President | 2022 Governor | 2020 President | |||
|---|---|---|---|---|---|---|
| Margin | Votes | Margin | Votes | Margin | Votes | |
| 1-1 Dill | R+71.6 | 289 | R+70.1 | 157 | - | - |
| 1-2 Griffith | R+58.3 | 206 | R+53.6 | 97 | - | - |
| 1-3 Mt. Crest | R+75.5 | 440 | R+78.2 | 262 | - | - |
| 2-1 Cold Springs | R+73.1 | 757 | R+73.2 | 411 | - | - |
| 2-2 Luminary | R+82.0 | 388 | R+87.2 | 211 | - | - |
| 3-1 Brayton | R+85.9 | 545 | R+87.3 | 307 | - | - |
| 3-2 Rigsby | R+80.0 | 684 | R+81.8 | 380 | - | - |
| 4-1 Pikeville | R+52.9 | 749 | R+57.0 | 391 | - | - |
| 5-1 Bellview | R+75.0 | 787 | R+81.1 | 440 | - | - |
| 5-2 Nine Mile | R+79.1 | 86 | R+91.1 | 45 | - | - |
| 6-1 Lee Station | R+56.3 | 355 | R+59.9 | 212 | - | - |
| 6-2 Lusk | R+62.3 | 905 | R+67.9 | 495 | - | - |
Van Buren: 7 precincts
| Precinct | 2024 President | 2022 Governor | 2020 President | |||
|---|---|---|---|---|---|---|
| Margin | Votes | Margin | Votes | Margin | Votes | |
| Cedar Grove | R+58.0 | 402 | R+56.0 | 225 | R+50.3 | 390 |
| Cummingsville | R+69.2 | 380 | R+70.6 | 231 | R+67.6 | 318 |
| Fall Creek Falls | R+72.9 | 620 | R+70.7 | 338 | R+68.7 | 582 |
| Piney | R+63.1 | 583 | R+74.5 | 306 | R+62.6 | 601 |
| Spencer 1 | R+71.1 | 602 | R+61.0 | 413 | R+56.9 | 422 |
| Spencer 5 | R+73.7 | 491 | R+72.3 | 282 | R+60.9 | 481 |
| White Hill | R+47.1 | 187 | R+69.9 | 103 | R+61.9 | 126 |
2024 President (Electors for Kamala D. Harris for President and Tim Walz for Vice President vs. Electors for Donald J. Trump for President and JD Vance for Vice President). Source: Tennessee Secretary of State, certified results by precinct (aggregated to county). Certified, Tennessee Secretary of State, Division of Elections (official precinct results).
2022 Governor (Jason Brantley Martin vs. Bill Lee). Source: Tennessee Secretary of State, certified results by precinct (aggregated to county). Certified, Tennessee Secretary of State, Division of Elections (official precinct results).
2020 President (Joseph R. Biden vs. Donald J. Trump). Source: Tennessee Secretary of State, certified results by precinct (aggregated to county). Certified, Tennessee Secretary of State, Division of Elections (official precinct results).
Precinct demographics
Demographics are Census American Community Survey (ACS) 2020-2024 5-year estimates for block groups, assigned to precincts by area share. They describe the resident population, not registered or likely voters, and include non-citizens. ACS margins of error are not shown; small precincts carry large error. Area weighting assumes people are spread evenly within each block group, so large rural precincts are the least reliable. Median income is a household-weighted average of block-group medians, an approximation.
| Area | Population | Voting-age pop. | % White non-Hisp. | % Hispanic | % Black | % Asian | Median income* | % Bachelor's+ | % 18-29 (of adults) | % 65+ | % Homeowners | % Below poverty | % Spanish at home (adults) |
|---|---|---|---|---|---|---|---|---|---|---|---|---|---|
| District | 815,706 | 620,733 | 64.2% | 13.2% | 14.8% | 2.8% | $77k | 30.6% | 23.1% | 13.3% | 63.6% | 13.3% | 9.2% |
| Rutherford (in district) | 327,163 | 246,740 | 64.1% | 12.3% | 14.4% | 3.4% | $89k | 36.1% | 25.9% | 11.3% | 63.6% | 9.5% | 8.5% |
| Davidson (in district) | 238,184 | 177,495 | 40.1% | 23.0% | 27.3% | 4.2% | $78k | 36.9% | 24.7% | 9.4% | 52.0% | 15.0% | 16.9% |
| Coffee (in district) | 58,502 | 44,384 | 85.2% | 6.6% | 3.9% | 1.2% | $62k | 21.9% | 18.5% | 17.7% | 69.4% | 17.4% | 3.9% |
| Franklin (in district) | 48,975 | 39,229 | 87.3% | 3.6% | 5.1% | 1.0% | $63k | 23.2% | 20.5% | 20.8% | 76.1% | 12.3% | 2.1% |
| Warren (in district) | 44,087 | 33,844 | 83.1% | 10.0% | 2.7% | 0.6% | $56k | 14.1% | 18.2% | 17.9% | 72.0% | 15.7% | 6.1% |
| Marion (in district) | 30,031 | 23,942 | 90.0% | 2.5% | 3.0% | 0.1% | $64k | 17.2% | 16.4% | 20.9% | 78.6% | 16.2% | 1.4% |
| Sequatchie (in district) | 17,458 | 13,981 | 90.1% | 5.0% | 0.5% | 0.8% | $58k | 20.7% | 16.6% | 21.8% | 77.8% | 22.1% | 2.9% |
| Bledsoe (in district) | 15,325 | 12,989 | 86.5% | 3.5% | 6.1% | 0.2% | $56k | 12.4% | 17.4% | 20.8% | 82.5% | 20.7% | 1.8% |
| Cannon (in district) | 15,218 | 11,750 | 91.9% | 3.1% | 2.3% | 0.0% | $62k | 16.8% | 16.8% | 17.7% | 78.2% | 18.3% | 1.0% |
| Grundy (in district) | 14,190 | 11,127 | 93.7% | 0.4% | 0.5% | 0.8% | $47k | 14.3% | 16.8% | 20.7% | 83.6% | 18.8% | 0.3% |
| Van Buren (in district) | 6,573 | 5,252 | 94.4% | 2.2% | 0.5% | 0.1% | $56k | 13.6% | 14.9% | 23.9% | 86.4% | 16.1% | 2.0% |
Rutherford: 31 precincts
| Precinct | Population | Voting-age pop. | % White non-Hisp. | % Hispanic | % Black | % Asian | Median income* | % Bachelor's+ | % 18-29 (of adults) | % 65+ | % Homeowners | % Below poverty | % Spanish at home (adults) |
|---|---|---|---|---|---|---|---|---|---|---|---|---|---|
| 1-1 | 17,005 | 11,930 | 40.9% | 27.9% | 24.6% | 4.7% | $90k | 20.7% | 26.3% | 5.6% | 73.7% | 19.3% | 21.5% |
| 10-1 (part) | 873 | 639 | 46.3% | 12.0% | 27.4% | 7.6% | $94k | 39.6% | 17.3% | 10.0% | 66.3% | 6.4% | 9.0% |
| 11-1 (part) | 6,180 | 4,506 | 48.2% | 23.1% | 22.8% | 2.4% | $55k | 27.1% | 28.5% | 11.2% | 37.3% | 15.4% | 16.9% |
| 12-1 | 12,531 | 8,899 | 58.3% | 22.9% | 11.4% | 2.1% | $74k | 22.5% | 28.0% | 14.3% | 41.9% | 16.3% | 15.5% |
| 12-2 | 3,354 | 2,517 | 57.7% | 30.6% | 7.1% | 2.3% | $94k | 25.5% | 14.4% | 14.9% | 77.7% | 17.5% | 15.9% |
| 13-1 | 17,776 | 13,098 | 62.0% | 10.7% | 11.0% | 5.6% | $83k | 35.1% | 31.1% | 7.7% | 51.6% | 3.9% | 8.1% |
| 14-1 | 1,125 | 980 | 74.3% | 3.9% | 18.0% | 0.0% | $53k | 32.9% | 29.9% | 18.7% | 49.9% | 17.0% | 1.8% |
| 14-2 | 18,353 | 14,219 | 70.0% | 5.9% | 10.6% | 5.0% | $111k | 46.4% | 23.1% | 12.8% | 64.5% | 4.5% | 3.3% |
| 15-1 | 12,699 | 10,045 | 63.1% | 5.5% | 24.4% | 1.2% | $91k | 42.8% | 23.6% | 15.8% | 61.2% | 12.4% | 5.1% |
| 15-2 | 5,049 | 4,182 | 86.6% | 0.3% | 8.1% | 2.4% | $99k | 55.7% | 17.6% | 25.2% | 57.4% | 5.0% | 0.1% |
| 16-1 | 7,008 | 5,714 | 69.8% | 13.4% | 10.9% | 0.4% | $50k | 35.9% | 34.2% | 12.8% | 34.7% | 21.0% | 10.2% |
| 16-2 | 9,590 | 7,539 | 60.3% | 11.3% | 12.9% | 6.4% | $86k | 36.8% | 33.9% | 9.0% | 40.7% | 10.8% | 5.8% |
| 17-1 | 15,300 | 12,415 | 60.0% | 11.8% | 19.3% | 0.7% | $52k | 37.8% | 54.1% | 8.7% | 27.1% | 17.7% | 7.6% |
| 18-1 | 5,530 | 4,345 | 50.6% | 15.3% | 29.0% | 0.1% | $59k | 28.9% | 30.8% | 12.1% | 28.3% | 18.6% | 15.1% |
| 18-2 | 7,741 | 6,044 | 67.9% | 8.0% | 16.8% | 1.8% | $76k | 40.7% | 23.4% | 14.8% | 44.5% | 10.5% | 4.7% |
| 19-1 (part) | 12,426 | 9,334 | 67.7% | 11.9% | 9.1% | 4.6% | $106k | 43.0% | 23.0% | 9.8% | 78.9% | 5.0% | 9.3% |
| 2-1 | 11,290 | 8,460 | 79.4% | 6.4% | 7.6% | 1.3% | $109k | 40.5% | 14.4% | 13.9% | 92.5% | 5.0% | 3.9% |
| 2-2 | 4,036 | 2,814 | 81.8% | 7.3% | 1.6% | 0.8% | $122k | 43.9% | 26.3% | 6.7% | 97.5% | 7.1% | 4.9% |
| 20-1 | 15,271 | 11,446 | 63.1% | 7.1% | 15.3% | 5.7% | $88k | 40.5% | 28.9% | 8.3% | 52.7% | 3.4% | 4.3% |
| 21-1 | 4,883 | 3,960 | 57.8% | 11.8% | 23.7% | 2.3% | $71k | 32.6% | 36.9% | 12.8% | 59.5% | 16.0% | 8.8% |
| 21-2 | 10,228 | 7,593 | 50.1% | 15.6% | 23.3% | 5.4% | $78k | 39.4% | 34.0% | 8.5% | 55.8% | 12.7% | 9.3% |
| 3-1 | 2,252 | 1,623 | 75.0% | 9.7% | 7.1% | 0.9% | $132k | 30.0% | 23.0% | 7.9% | 82.3% | 1.7% | 6.6% |
| 3-2 | 15,009 | 11,575 | 63.7% | 10.9% | 12.7% | 6.8% | $101k | 25.9% | 19.9% | 10.2% | 77.8% | 9.0% | 7.5% |
| 4-1 | 16,348 | 12,898 | 73.3% | 8.9% | 8.1% | 1.8% | $85k | 42.0% | 23.7% | 15.6% | 69.7% | 7.9% | 6.9% |
| 4-2 | 1,182 | 822 | 80.2% | 12.7% | 6.1% | 0.2% | $44k | 20.3% | 20.3% | 9.5% | 65.1% | 26.1% | 5.8% |
| 5-1 | 19,106 | 14,170 | 41.3% | 29.3% | 23.4% | 1.6% | $76k | 22.8% | 21.1% | 9.2% | 65.2% | 14.1% | 23.4% |
| 6-1 | 4,969 | 3,723 | 74.0% | 11.4% | 9.8% | 1.0% | $96k | 29.5% | 15.8% | 14.5% | 87.8% | 10.4% | 6.9% |
| 6-2 | 17,607 | 12,301 | 71.1% | 10.1% | 13.9% | 1.3% | $108k | 35.0% | 19.6% | 10.6% | 84.8% | 4.6% | 4.9% |
| 7-1 | 20,090 | 15,367 | 61.9% | 9.1% | 15.8% | 7.2% | $92k | 41.6% | 26.9% | 11.5% | 67.6% | 6.8% | 5.8% |
| 8-1 | 18,825 | 13,939 | 85.3% | 4.6% | 5.2% | 2.2% | $109k | 39.3% | 17.0% | 13.5% | 86.2% | 4.5% | 3.2% |
| 9-1 (part) | 13,526 | 9,645 | 73.9% | 7.9% | 9.4% | 3.9% | $116k | 41.4% | 19.2% | 9.9% | 90.0% | 4.4% | 6.5% |
Davidson: 45 precincts
| Precinct | Population | Voting-age pop. | % White non-Hisp. | % Hispanic | % Black | % Asian | Median income* | % Bachelor's+ | % 18-29 (of adults) | % 65+ | % Homeowners | % Below poverty | % Spanish at home (adults) |
|---|---|---|---|---|---|---|---|---|---|---|---|---|---|
| 12-2 (part) | 5,488 | 4,602 | 39.1% | 12.0% | 43.5% | 2.6% | $59k | 44.9% | 40.4% | 9.1% | 16.3% | 19.5% | 4.6% |
| 12-3 | 5,441 | 4,412 | 80.6% | 3.7% | 13.8% | 0.0% | $106k | 48.9% | 16.1% | 17.9% | 76.6% | 2.6% | 2.7% |
| 12-4 | 3,112 | 2,130 | 56.6% | 15.1% | 20.1% | 0.2% | $116k | 35.7% | 13.2% | 8.4% | 89.4% | 2.8% | 13.8% |
| 13-1 | 9,471 | 6,360 | 25.4% | 39.6% | 32.0% | 1.2% | $53k | 17.7% | 23.1% | 5.7% | 18.0% | 23.5% | 29.1% |
| 13-2 | 1,983 | 1,591 | 34.5% | 16.1% | 44.5% | 3.0% | $65k | 38.5% | 24.7% | 12.9% | 47.8% | 25.4% | 16.2% |
| 13-3 | 2,146 | 1,795 | 51.2% | 16.1% | 24.2% | 4.8% | $95k | 43.1% | 11.9% | 16.7% | 91.0% | 5.0% | 5.6% |
| 13-4 | 315 | 250 | 44.0% | 10.6% | 40.5% | 2.2% | $65k | 46.1% | 27.6% | 11.2% | 47.6% | 19.2% | 8.1% |
| 13-5 | 6,761 | 5,698 | 58.0% | 6.5% | 29.5% | 2.7% | $76k | 53.0% | 27.9% | 11.3% | 57.7% | 16.3% | 3.9% |
| 16-2 | 7,677 | 6,323 | 64.8% | 19.4% | 8.4% | 2.2% | $83k | 45.9% | 33.9% | 10.1% | 49.6% | 24.6% | 19.3% |
| 16-4 | 1,264 | 998 | 66.2% | 20.6% | 11.3% | 0.3% | $67k | 32.3% | 14.8% | 18.5% | 64.6% | 1.9% | 18.0% |
| 26-4 (part) | 6,973 | 5,731 | 63.3% | 24.7% | 5.4% | 4.2% | $73k | 51.7% | 22.5% | 14.5% | 42.0% | 14.5% | 15.4% |
| 27-1 | 4,067 | 2,711 | 22.7% | 47.6% | 15.3% | 8.5% | $69k | 22.2% | 16.3% | 11.9% | 75.3% | 17.9% | 29.6% |
| 27-3 | 8,250 | 5,899 | 43.2% | 40.7% | 6.7% | 6.3% | $56k | 35.5% | 28.8% | 12.1% | 48.0% | 24.9% | 23.0% |
| 27-4 | 5,400 | 3,852 | 45.2% | 23.1% | 13.0% | 3.2% | $72k | 39.9% | 26.5% | 18.5% | 41.8% | 30.8% | 15.1% |
| 28-1 | 106 | 82 | 30.3% | 34.5% | 35.0% | 0.0% | $68k | 17.9% | 24.2% | 9.8% | 36.0% | 32.6% | 28.0% |
| 28-2 | 3,405 | 2,714 | 30.3% | 30.2% | 31.7% | 0.8% | $72k | 17.7% | 24.3% | 7.2% | 44.3% | 21.7% | 26.0% |
| 28-3 | 10,022 | 6,704 | 15.4% | 57.8% | 15.5% | 5.0% | $65k | 14.6% | 20.3% | 6.7% | 57.3% | 24.3% | 48.7% |
| 28-4 | 4,400 | 2,934 | 19.6% | 47.4% | 29.2% | 3.0% | $74k | 23.1% | 19.1% | 8.2% | 73.0% | 10.9% | 36.9% |
| 28-5 | 5,376 | 4,327 | 28.0% | 20.8% | 45.2% | 1.5% | $90k | 25.1% | 22.2% | 10.7% | 58.0% | 16.6% | 18.1% |
| 29-1 | 2,435 | 1,900 | 40.5% | 13.2% | 32.1% | 0.8% | $81k | 30.7% | 21.2% | 17.2% | 65.2% | 7.7% | 14.4% |
| 29-2 | 6,240 | 4,535 | 26.1% | 27.2% | 41.2% | 2.1% | $53k | 29.2% | 23.7% | 10.5% | 36.1% | 18.7% | 19.9% |
| 29-3 | 3,890 | 2,973 | 49.4% | 13.7% | 33.9% | 0.8% | $71k | 43.1% | 21.1% | 10.1% | 62.0% | 10.4% | 11.5% |
| 29-4 | 9,842 | 7,597 | 40.2% | 20.0% | 33.0% | 1.2% | $84k | 31.3% | 18.3% | 15.2% | 70.1% | 13.3% | 15.6% |
| 30-1 | 7,989 | 4,797 | 22.1% | 55.7% | 9.9% | 8.4% | $50k | 25.4% | 37.3% | 6.4% | 34.0% | 23.6% | 39.7% |
| 30-2 | 6,116 | 3,892 | 15.9% | 37.8% | 35.1% | 9.2% | $52k | 12.8% | 26.8% | 5.5% | 30.5% | 17.3% | 34.6% |
| 30-3 | 5,914 | 4,334 | 27.4% | 44.5% | 17.9% | 3.0% | $77k | 30.6% | 27.2% | 9.6% | 49.1% | 9.7% | 36.9% |
| 31-1 | 256 | 197 | 37.8% | 10.0% | 39.9% | 11.0% | $110k | 62.8% | 22.3% | 11.0% | 51.3% | 0.8% | 5.3% |
| 31-2 | 6,990 | 5,770 | 68.0% | 7.0% | 12.2% | 9.0% | $96k | 61.9% | 24.1% | 8.7% | 62.0% | 5.4% | 5.6% |
| 31-3 | 5,348 | 4,216 | 67.7% | 3.4% | 22.1% | 3.7% | $127k | 58.3% | 22.0% | 9.6% | 83.7% | 7.6% | 2.7% |
| 31-4 | 8,169 | 5,882 | 44.5% | 26.3% | 17.0% | 8.2% | $74k | 41.0% | 24.1% | 7.3% | 61.3% | 6.9% | 19.6% |
| 32-1 | 1,758 | 1,579 | 12.7% | 2.8% | 78.1% | 2.7% | $88k | 41.4% | 21.5% | 6.2% | 76.0% | 4.4% | 2.7% |
| 32-2 | 4,732 | 3,368 | 17.7% | 19.1% | 50.6% | 1.0% | $82k | 30.6% | 38.5% | 4.5% | 21.8% | 18.8% | 19.6% |
| 32-3 | 8,216 | 6,197 | 25.0% | 14.4% | 43.7% | 6.5% | $72k | 29.5% | 29.3% | 6.0% | 46.7% | 10.1% | 12.1% |
| 32-4 | 9,081 | 6,544 | 31.8% | 19.8% | 40.0% | 0.7% | $65k | 35.4% | 28.1% | 6.6% | 18.6% | 23.0% | 15.4% |
| 33-1 | 4,971 | 3,882 | 78.9% | 3.8% | 13.2% | 1.5% | $104k | 71.5% | 19.9% | 13.5% | 80.2% | 3.1% | 3.5% |
| 33-2 | 3,851 | 2,916 | 44.1% | 11.2% | 33.6% | 4.9% | $109k | 38.4% | 26.8% | 11.2% | 71.1% | 5.9% | 9.4% |
| 33-3 | 71 | 50 | 24.0% | 6.0% | 24.5% | 42.3% | $103k | 42.4% | 24.5% | 2.4% | 67.3% | 10.5% | 4.4% |
| 33-4 | 6,899 | 4,752 | 23.3% | 11.2% | 37.4% | 11.4% | $70k | 35.8% | 34.8% | 1.6% | 19.1% | 16.0% | 10.5% |
| 33-5 | 2,801 | 2,195 | 48.1% | 17.8% | 26.5% | 3.9% | $67k | 39.8% | 35.2% | 5.8% | 19.2% | 5.1% | 15.6% |
| 33-6 | 3,913 | 2,580 | 20.2% | 32.2% | 32.4% | 4.0% | $84k | 17.8% | 25.9% | 11.5% | 65.1% | 5.7% | 25.2% |
| 4-1 | 9,178 | 7,531 | 55.3% | 2.1% | 32.2% | 5.9% | $88k | 51.1% | 27.4% | 7.3% | 47.4% | 11.3% | 2.1% |
| 4-2 (part) | 6,000 | 5,093 | 74.3% | 5.9% | 7.8% | 6.3% | $121k | 63.2% | 17.0% | 15.2% | 82.3% | 3.8% | 3.2% |
| 8-1 | 13,548 | 10,036 | 31.7% | 21.7% | 34.3% | 6.0% | $85k | 21.0% | 20.1% | 5.9% | 68.3% | 15.7% | 16.2% |
| 8-2 | 1,602 | 1,105 | 37.4% | 18.8% | 36.1% | 1.9% | $74k | 28.2% | 15.1% | 10.2% | 70.2% | 14.2% | 16.4% |
| 8-3 | 6,716 | 4,467 | 29.1% | 11.2% | 54.2% | 0.8% | $82k | 32.3% | 14.0% | 7.2% | 81.4% | 19.3% | 8.4% |
Coffee: 15 precincts
| Precinct | Population | Voting-age pop. | % White non-Hisp. | % Hispanic | % Black | % Asian | Median income* | % Bachelor's+ | % 18-29 (of adults) | % 65+ | % Homeowners | % Below poverty | % Spanish at home (adults) |
|---|---|---|---|---|---|---|---|---|---|---|---|---|---|
| 1-1 First Baptist Church | 4,928 | 3,550 | 78.6% | 12.4% | 3.1% | 2.0% | $50k | 17.4% | 26.3% | 16.4% | 41.7% | 18.5% | 8.2% |
| 2-1 Trinity Baptist Church | 6,690 | 4,837 | 80.8% | 8.6% | 5.4% | 2.1% | $54k | 24.6% | 20.0% | 17.6% | 58.1% | 13.6% | 4.8% |
| 3-1 Coffee County Rescue Squad | 3,862 | 3,109 | 94.1% | 0.9% | 4.7% | 0.2% | $63k | 18.8% | 15.8% | 20.4% | 71.2% | 12.4% | 0.6% |
| 3-2 Lakewood Baptist Church | 3,085 | 2,218 | 89.2% | 8.4% | 0.2% | 0.2% | $70k | 13.6% | 18.1% | 12.2% | 84.2% | 23.0% | 2.4% |
| 4-1 New Union Church of Christ | 3,944 | 3,112 | 87.6% | 7.1% | 1.2% | 2.5% | $69k | 16.5% | 18.3% | 10.3% | 90.9% | 15.1% | 5.8% |
| 4-2 Forest Mill Church of Christ | 2,746 | 2,155 | 87.7% | 5.9% | 1.2% | 1.1% | $69k | 16.8% | 9.6% | 19.7% | 79.0% | 8.8% | 3.6% |
| 5-1 Hickerson Station Fire Hall | 5,144 | 3,831 | 79.9% | 7.3% | 4.3% | 2.9% | $74k | 31.0% | 12.8% | 19.0% | 88.1% | 11.2% | 5.8% |
| 5-2 Blanton's Chapel Community Center | 3,443 | 2,752 | 85.3% | 8.6% | 3.6% | 1.1% | $73k | 23.1% | 21.6% | 17.2% | 76.5% | 15.9% | 2.2% |
| 6-1 Conference Center | 4,507 | 3,377 | 88.6% | 3.8% | 0.9% | 1.7% | $55k | 16.1% | 14.3% | 18.5% | 75.7% | 28.0% | 2.2% |
| 6-2 Hillsboro Community Center | 4,209 | 3,096 | 97.1% | 1.3% | 0.6% | 0.3% | $58k | 15.3% | 18.8% | 14.4% | 85.6% | 15.9% | 0.6% |
| 7-2 Wesley Heights Methodist Church | 3,178 | 2,485 | 78.7% | 4.8% | 11.1% | 0.0% | $42k | 11.4% | 31.3% | 11.3% | 39.8% | 30.8% | 1.2% |
| 8-1 Lion's Club | 2,864 | 2,077 | 84.0% | 5.2% | 5.8% | 0.6% | $82k | 43.7% | 22.5% | 16.7% | 73.4% | 14.9% | 2.5% |
| 8-2 Grace Baptist Church | 2,834 | 2,387 | 88.7% | 5.2% | 3.0% | 0.3% | $77k | 35.2% | 11.9% | 27.3% | 79.5% | 9.7% | 5.8% |
| 9-1 D.W. Wilson Community Center | 3,370 | 2,485 | 86.4% | 3.2% | 7.3% | 0.2% | $49k | 12.8% | 19.5% | 26.2% | 61.0% | 21.9% | 2.4% |
| 9-2 Cedar Lane Church of Christ | 3,700 | 2,914 | 77.6% | 12.7% | 6.2% | 0.4% | $63k | 30.9% | 16.5% | 20.8% | 49.6% | 23.9% | 7.2% |
Franklin: 18 precincts
| Precinct | Population | Voting-age pop. | % White non-Hisp. | % Hispanic | % Black | % Asian | Median income* | % Bachelor's+ | % 18-29 (of adults) | % 65+ | % Homeowners | % Below poverty | % Spanish at home (adults) |
|---|---|---|---|---|---|---|---|---|---|---|---|---|---|
| 1-1 Franklin County Annex | 4,785 | 3,908 | 79.3% | 8.4% | 8.5% | 0.9% | $67k | 27.6% | 16.1% | 23.4% | 76.6% | 11.1% | 4.7% |
| 2-1 Clark Memorial School | 4,755 | 3,726 | 84.5% | 3.9% | 6.0% | 2.6% | $63k | 25.3% | 15.5% | 23.0% | 70.3% | 11.1% | 1.6% |
| 3-1 Broadview School | 1,960 | 1,704 | 87.5% | 7.2% | 1.6% | 0.7% | $70k | 28.0% | 10.1% | 30.1% | 86.4% | 13.5% | 4.6% |
| 3-2 Huntland Community Center | 2,556 | 1,912 | 95.9% | 0.7% | 1.5% | 0.2% | $58k | 16.1% | 19.4% | 18.1% | 82.8% | 10.6% | 0.6% |
| 3-3 Walnut Grove Community Church | 990 | 752 | 80.5% | 10.3% | 3.6% | 0.0% | $53k | 15.0% | 15.7% | 20.4% | 82.4% | 12.7% | 5.4% |
| 4-1 Belvidere Community Center | 1,073 | 845 | 87.4% | 4.6% | 3.8% | 0.1% | $61k | 19.6% | 16.7% | 17.9% | 85.8% | 8.2% | 1.6% |
| 4-2 Cowan Elementary School | 3,124 | 2,273 | 80.7% | 1.3% | 12.7% | 0.8% | $55k | 16.0% | 20.2% | 20.7% | 68.4% | 22.0% | 0.5% |
| 4-3 Liberty Community Center | 2,356 | 1,857 | 71.8% | 12.1% | 12.2% | 0.6% | $62k | 21.5% | 15.9% | 24.9% | 76.7% | 17.0% | 9.0% |
| 5-1 Keith Springs Community Center | 908 | 739 | 94.2% | 0.0% | 3.8% | 0.0% | $59k | 26.0% | 12.0% | 28.4% | 91.2% | 17.3% | 0.1% |
| 5-2 Sewanee Elementary School | 3,908 | 3,474 | 85.9% | 5.2% | 4.7% | 0.5% | $94k | 53.8% | 53.8% | 15.9% | 80.3% | 10.6% | 3.5% |
| 5-3 Sherwood Fire Department | 778 | 673 | 84.1% | 0.6% | 3.0% | 1.7% | $41k | 42.9% | 38.6% | 17.0% | 63.3% | 24.3% | 0.7% |
| 6-1 Alto/Oak Grove Fire Department | 1,766 | 1,552 | 93.7% | 0.3% | 2.3% | 2.3% | $72k | 25.8% | 20.4% | 22.4% | 87.8% | 8.6% | 0.2% |
| 6-2 Capitol Hill Community Center | 2,884 | 2,318 | 87.9% | 2.7% | 3.8% | 1.7% | $58k | 15.1% | 18.7% | 16.2% | 80.0% | 12.8% | 1.6% |
| 6-3 UTSI Main Campus | 2,171 | 1,729 | 88.4% | 2.1% | 3.9% | 0.2% | $74k | 16.8% | 16.1% | 18.0% | 88.0% | 9.3% | 0.7% |
| 7-1 CD Stamps | 7,193 | 5,576 | 92.3% | 1.5% | 4.2% | 1.2% | $62k | 22.1% | 15.4% | 20.7% | 72.4% | 8.7% | 0.6% |
| 7-2 Center Grove/Winchester Springs Water District | 2,586 | 2,162 | 96.3% | 1.9% | 0.5% | 0.0% | $71k | 26.1% | 20.5% | 25.7% | 87.1% | 9.5% | 0.3% |
| 8-1 Decherd Elementary School | 3,385 | 2,607 | 89.0% | 1.3% | 5.0% | 2.1% | $43k | 13.8% | 21.2% | 13.1% | 48.7% | 16.1% | 0.9% |
| 8-2 Estill Springs Community Center | 1,799 | 1,423 | 95.2% | 1.4% | 1.6% | 0.2% | $68k | 16.2% | 12.6% | 22.7% | 85.2% | 12.7% | 0.7% |
Warren: 20 precincts
| Precinct | Population | Voting-age pop. | % White non-Hisp. | % Hispanic | % Black | % Asian | Median income* | % Bachelor's+ | % 18-29 (of adults) | % 65+ | % Homeowners | % Below poverty | % Spanish at home (adults) |
|---|---|---|---|---|---|---|---|---|---|---|---|---|---|
| 01-1 Christ Community Church | 3,509 | 2,753 | 84.7% | 11.3% | 1.1% | 0.1% | $40k | 11.2% | 18.4% | 18.4% | 41.8% | 14.5% | 4.8% |
| 02-1 Courthouse | 1,442 | 1,112 | 79.9% | 19.4% | 0.0% | 0.0% | $58k | 19.0% | 17.2% | 18.1% | 73.5% | 19.1% | 9.8% |
| 02-2 Warren County Airport | 1,543 | 1,048 | 84.7% | 9.4% | 0.5% | 1.3% | $76k | 10.0% | 15.2% | 9.1% | 81.5% | 19.9% | 0.2% |
| 03-1 Westwood Church of Christ | 953 | 818 | 76.9% | 10.7% | 2.4% | 4.0% | $50k | 20.8% | 13.8% | 22.8% | 63.1% | 26.6% | 9.4% |
| 03-2 Smartt First Baptist Church | 2,119 | 1,550 | 83.4% | 12.4% | 0.4% | 0.2% | $64k | 16.9% | 19.3% | 15.6% | 77.4% | 14.2% | 5.1% |
| 04-1 TSU Nursery Res. Center | 3,014 | 2,271 | 71.1% | 9.6% | 10.5% | 0.0% | $53k | 11.1% | 18.0% | 13.4% | 71.9% | 14.6% | 4.2% |
| 05-1 Three Star Mall | 2,474 | 1,941 | 74.8% | 16.1% | 5.4% | 0.1% | $41k | 10.3% | 26.0% | 16.0% | 54.1% | 25.7% | 12.2% |
| 05-2 Chamber of Commerce | 848 | 738 | 81.0% | 4.3% | 5.0% | 8.2% | $54k | 17.0% | 20.9% | 24.0% | 65.3% | 15.2% | 2.2% |
| 06-1 Redemption Center | 3,120 | 2,426 | 79.7% | 15.2% | 2.2% | 0.1% | $50k | 9.7% | 16.7% | 20.0% | 56.2% | 14.7% | 7.5% |
| 07-1 - Friendship The Baptist Church | 2,559 | 2,275 | 89.3% | 7.6% | 2.1% | 0.0% | $58k | 14.5% | 10.4% | 28.5% | 85.4% | 9.4% | 4.2% |
| 08-1 Shellsford Baptist Church | 3,291 | 2,617 | 92.5% | 2.3% | 2.3% | 0.0% | $53k | 9.4% | 13.5% | 21.5% | 80.4% | 30.2% | 1.4% |
| 08-3 Bonner Church of Christ | 1,517 | 1,146 | 90.7% | 3.0% | 2.0% | 3.0% | $56k | 15.7% | 15.5% | 21.7% | 74.0% | 7.8% | 1.2% |
| 09-1 Morrison Ruritan Club | 2,638 | 1,918 | 82.6% | 9.7% | 1.1% | 0.0% | $73k | 21.4% | 22.4% | 14.8% | 76.7% | 11.8% | 3.7% |
| 09-2 Viola Valley Community Center | 1,726 | 1,249 | 88.8% | 8.0% | 1.0% | 0.0% | $71k | 24.5% | 12.7% | 19.5% | 79.1% | 11.9% | 5.0% |
| 10-1 Centertown United Methodist Church | 2,248 | 1,699 | 93.8% | 2.2% | 0.2% | 0.1% | $51k | 9.7% | 21.4% | 21.4% | 84.8% | 15.5% | 0.2% |
| 10-2 Centertown Community Center | 2,122 | 1,596 | 89.5% | 4.4% | 1.0% | 2.0% | $68k | 10.5% | 15.6% | 21.6% | 83.4% | 15.7% | 0.8% |
| 11-1 Midway Community Center | 1,972 | 1,391 | 78.7% | 2.5% | 8.7% | 0.4% | $54k | 26.8% | 15.0% | 15.0% | 82.1% | 15.4% | 2.0% |
| 11-2 HWY 56 N Church of Christ | 2,798 | 2,116 | 79.1% | 17.4% | 0.0% | 0.7% | $61k | 15.7% | 21.6% | 16.0% | 91.6% | 4.0% | 18.4% |
| 12-1 Highway Department | 1,992 | 1,560 | 86.6% | 6.5% | 6.5% | 0.0% | $48k | 10.0% | 31.2% | 9.1% | 45.5% | 24.4% | 4.5% |
| 12-2 Lucky Community Center | 2,203 | 1,621 | 74.6% | 23.5% | 0.0% | 0.0% | $59k | 13.2% | 18.1% | 13.5% | 90.8% | 7.4% | 22.3% |
Marion: 17 precincts
| Precinct | Population | Voting-age pop. | % White non-Hisp. | % Hispanic | % Black | % Asian | Median income* | % Bachelor's+ | % 18-29 (of adults) | % 65+ | % Homeowners | % Below poverty | % Spanish at home (adults) |
|---|---|---|---|---|---|---|---|---|---|---|---|---|---|
| 1 South Pittsburgh | 3,472 | 2,805 | 90.2% | 1.4% | 6.2% | 0.4% | $63k | 12.5% | 16.9% | 19.4% | 69.3% | 20.6% | 2.2% |
| 10 Foster Falls | 2,341 | 1,881 | 91.1% | 0.1% | 0.5% | 0.0% | $68k | 16.9% | 28.5% | 16.6% | 84.5% | 12.4% | 0.2% |
| 11 Whitwell Mountain | 1,676 | 1,327 | 93.3% | 0.1% | 2.0% | 0.0% | $48k | 12.7% | 16.0% | 21.5% | 80.9% | 24.4% | 1.6% |
| 12 Sequatchie | 1,717 | 1,451 | 92.4% | 0.1% | 0.6% | 0.0% | $57k | 11.0% | 15.3% | 28.2% | 79.7% | 17.6% | 0.3% |
| 13 Waldon's Ridge | 818 | 657 | 98.4% | 0.1% | 0.0% | 0.2% | $70k | 16.8% | 4.4% | 14.2% | 88.8% | 13.7% | 0.1% |
| 14 Elder Mountain | 177 | 162 | 85.2% | 9.9% | 0.0% | 0.0% | $87k | 40.8% | 11.5% | 40.7% | 70.9% | 29.3% | 3.5% |
| 15 River Canyon | 125 | 100 | 98.6% | 0.1% | 0.0% | 0.0% | $71k | 17.1% | 3.8% | 14.2% | 88.9% | 13.8% | 0.0% |
| 16 Whitwell | 2,914 | 2,325 | 89.8% | 7.7% | 0.6% | 0.2% | $67k | 9.3% | 15.6% | 17.2% | 78.0% | 7.6% | 3.7% |
| 17 Powells Crossroads | 3,149 | 2,661 | 93.5% | 3.7% | 0.0% | 0.0% | $64k | 13.8% | 19.5% | 21.8% | 81.6% | 8.7% | 1.6% |
| 2 New Hope | 882 | 738 | 95.6% | 0.9% | 0.0% | 0.0% | $77k | 11.6% | 18.0% | 21.0% | 87.5% | 23.5% | 0.7% |
| 3 Orme | 178 | 141 | 97.6% | 0.0% | 0.0% | 0.2% | $65k | 21.0% | 22.6% | 12.9% | 83.7% | 21.2% | 0.6% |
| 4 Lodge | 881 | 705 | 91.0% | 0.0% | 6.8% | 0.7% | $71k | 13.3% | 16.5% | 17.2% | 78.6% | 20.6% | 0.3% |
| 5 Monteagle | 672 | 526 | 98.2% | 0.3% | 0.1% | 0.1% | $64k | 23.7% | 14.5% | 21.5% | 77.1% | 28.6% | 0.2% |
| 6 Kimball | 3,495 | 2,693 | 87.7% | 3.0% | 6.3% | 0.1% | $65k | 23.9% | 16.6% | 21.8% | 70.8% | 19.7% | 2.0% |
| 7 Shellmound | 673 | 497 | 79.5% | 0.1% | 0.3% | 0.0% | $39k | 7.5% | 14.4% | 23.2% | 81.1% | 16.5% | 2.0% |
| 8 Haletown | 669 | 612 | 85.1% | 9.9% | 0.0% | 0.0% | $66k | 40.6% | 11.7% | 40.6% | 70.8% | 29.3% | 3.5% |
| 9 Jasper | 6,191 | 4,659 | 86.2% | 2.5% | 5.1% | 0.2% | $66k | 22.2% | 13.1% | 20.7% | 82.0% | 14.1% | 0.0% |
Sequatchie: 9 precincts
| Precinct | Population | Voting-age pop. | % White non-Hisp. | % Hispanic | % Black | % Asian | Median income* | % Bachelor's+ | % 18-29 (of adults) | % 65+ | % Homeowners | % Below poverty | % Spanish at home (adults) |
|---|---|---|---|---|---|---|---|---|---|---|---|---|---|
| American Legions Post 190/VFW Post 5772 | 1,105 | 824 | 91.3% | 6.5% | 0.3% | 0.0% | $54k | 24.3% | 20.8% | 20.7% | 69.1% | 25.8% | 4.8% |
| Cagle | 2,012 | 1,664 | 89.8% | 4.8% | 1.4% | 0.6% | $60k | 18.9% | 16.2% | 22.7% | 74.0% | 20.5% | 2.4% |
| Chapel Hill | 2,238 | 1,675 | 91.2% | 5.8% | 0.0% | 0.2% | $59k | 23.8% | 21.9% | 20.0% | 73.5% | 24.7% | 4.1% |
| Courthouse | 2,355 | 1,908 | 87.0% | 7.7% | 0.6% | 0.5% | $51k | 21.0% | 8.5% | 21.7% | 69.9% | 29.8% | 3.8% |
| Daus | 3,076 | 2,316 | 92.0% | 5.0% | 0.1% | 0.0% | $55k | 21.2% | 20.3% | 20.5% | 74.4% | 23.9% | 3.7% |
| Electric Co-op | 792 | 712 | 90.3% | 4.2% | 2.9% | 0.3% | $52k | 18.2% | 19.2% | 31.1% | 71.7% | 23.9% | 3.0% |
| Fredonia | 2,025 | 1,647 | 93.3% | 2.3% | 0.5% | 0.0% | $60k | 18.5% | 14.4% | 22.1% | 89.2% | 14.3% | 1.6% |
| Lewis Chapel | 1,707 | 1,472 | 86.6% | 5.1% | 0.0% | 0.2% | $74k | 21.0% | 11.1% | 20.7% | 95.5% | 15.5% | 1.9% |
| Lone Oak | 2,148 | 1,761 | 89.4% | 3.3% | 0.0% | 4.9% | $51k | 19.8% | 19.9% | 22.8% | 79.9% | 19.5% | 1.7% |
Bledsoe: 12 precincts
| Precinct | Population | Voting-age pop. | % White non-Hisp. | % Hispanic | % Black | % Asian | Median income* | % Bachelor's+ | % 18-29 (of adults) | % 65+ | % Homeowners | % Below poverty | % Spanish at home (adults) |
|---|---|---|---|---|---|---|---|---|---|---|---|---|---|
| 1-1 Dill | 863 | 724 | 98.6% | 0.7% | 0.0% | 0.0% | $59k | 22.7% | 11.6% | 16.8% | 96.7% | 23.2% | 0.8% |
| 1-2 Griffith | 859 | 722 | 98.6% | 0.8% | 0.0% | 0.0% | $57k | 22.8% | 11.4% | 17.0% | 96.6% | 23.5% | 0.8% |
| 1-3 Mt. Crest | 1,342 | 1,225 | 79.0% | 1.1% | 17.8% | 0.2% | $52k | 8.6% | 19.1% | 13.2% | 88.3% | 21.6% | 0.9% |
| 2-1 Cold Springs | 1,096 | 1,007 | 89.3% | 6.6% | 1.0% | 0.6% | $41k | 9.2% | 7.1% | 30.9% | 86.8% | 28.2% | 0.3% |
| 2-2 Luminary | 1,435 | 1,086 | 82.7% | 14.1% | 0.0% | 0.0% | $48k | 3.9% | 19.0% | 12.5% | 81.3% | 36.5% | 11.1% |
| 3-1 Brayton | 1,104 | 893 | 97.6% | 0.9% | 0.0% | 0.0% | $53k | 13.0% | 3.7% | 28.4% | 87.2% | 28.1% | 1.1% |
| 3-2 Rigsby | 1,013 | 904 | 95.9% | 0.3% | 0.0% | 0.0% | $62k | 7.3% | 13.2% | 25.9% | 92.3% | 12.6% | 0.4% |
| 5-1 Bellview | 1,592 | 1,431 | 86.6% | 1.7% | 9.4% | 0.1% | $45k | 4.1% | 16.8% | 21.6% | 85.7% | 18.9% | 1.2% |
| 5-2 Nine Mile | 107 | 99 | 90.4% | 6.9% | 0.0% | 0.7% | $39k | 9.5% | 4.8% | 32.4% | 87.8% | 29.3% | 0.0% |
| 6-1 Lee Station | 1,734 | 1,439 | 86.1% | 7.0% | 1.1% | 0.1% | $58k | 21.3% | 14.2% | 24.0% | 77.5% | 10.7% | 2.4% |
| 6-2 Lusk | 2,008 | 1,597 | 91.9% | 0.4% | 0.3% | 0.0% | $81k | 17.4% | 15.6% | 20.0% | 85.6% | 12.3% | 0.2% |
| Pikeville | 2,174 | 1,862 | 67.5% | 2.6% | 23.6% | 0.6% | $47k | 10.9% | 39.2% | 19.8% | 50.9% | 20.1% | 0.9% |
Cannon: 9 precincts
| Precinct | Population | Voting-age pop. | % White non-Hisp. | % Hispanic | % Black | % Asian | Median income* | % Bachelor's+ | % 18-29 (of adults) | % 65+ | % Homeowners | % Below poverty | % Spanish at home (adults) |
|---|---|---|---|---|---|---|---|---|---|---|---|---|---|
| 2 Short Mountain | 612 | 391 | 98.9% | 0.1% | 0.0% | 0.0% | $55k | 15.4% | 17.5% | 8.7% | 65.2% | 53.5% | 0.1% |
| 4 Short Mountain | 1,026 | 775 | 94.8% | 2.1% | 0.1% | 0.0% | $71k | 22.3% | 16.7% | 13.1% | 80.2% | 17.6% | 1.5% |
| Auburntown | 1,374 | 1,031 | 91.5% | 3.4% | 2.9% | 0.0% | $74k | 18.8% | 9.1% | 19.8% | 88.3% | 8.2% | 0.1% |
| Eastside | 4,219 | 3,404 | 92.0% | 3.6% | 0.8% | 0.0% | $59k | 14.0% | 19.8% | 14.7% | 67.2% | 17.2% | 1.0% |
| Gassaway | 890 | 642 | 86.3% | 6.5% | 5.6% | 0.0% | $69k | 16.2% | 11.3% | 22.3% | 83.7% | 26.1% | 0.2% |
| Pleasant Ridge | 1,100 | 810 | 90.6% | 4.1% | 3.2% | 0.0% | $71k | 18.1% | 12.0% | 18.8% | 84.0% | 18.5% | 0.4% |
| Westside | 2,753 | 2,148 | 95.2% | 2.3% | 0.6% | 0.0% | $67k | 23.9% | 12.1% | 21.0% | 88.7% | 13.9% | 1.6% |
| Woodbury | 565 | 431 | 89.4% | 4.9% | 1.4% | 0.0% | $56k | 12.7% | 18.5% | 14.0% | 61.5% | 17.8% | 1.0% |
| Woodland | 2,678 | 2,118 | 88.5% | 2.3% | 5.9% | 0.0% | $50k | 11.8% | 23.6% | 20.4% | 80.7% | 19.3% | 1.5% |
Grundy: 10 precincts
| Precinct | Population | Voting-age pop. | % White non-Hisp. | % Hispanic | % Black | % Asian | Median income* | % Bachelor's+ | % 18-29 (of adults) | % 65+ | % Homeowners | % Below poverty | % Spanish at home (adults) |
|---|---|---|---|---|---|---|---|---|---|---|---|---|---|
| Altamont | 2,336 | 1,834 | 96.1% | 0.1% | 0.4% | 0.0% | $43k | 17.4% | 12.6% | 18.1% | 91.9% | 22.7% | 0.0% |
| Beersheba Springs | 1,018 | 946 | 90.6% | 0.5% | 0.0% | 0.0% | $38k | 4.1% | 11.2% | 18.4% | 87.6% | 37.1% | 0.1% |
| Central | 1,432 | 1,085 | 96.3% | 0.0% | 0.1% | 0.1% | $43k | 13.3% | 10.8% | 23.3% | 88.1% | 20.6% | 1.3% |
| Coalmont | 1,304 | 998 | 95.5% | 0.0% | 0.2% | 0.0% | $40k | 16.0% | 19.5% | 21.8% | 78.9% | 26.2% | 0.5% |
| Collins | 625 | 526 | 97.2% | 0.1% | 0.0% | 1.4% | $45k | 11.4% | 16.3% | 27.3% | 94.5% | 10.9% | 0.0% |
| Gruelti-Laager | 1,798 | 1,378 | 93.9% | 0.0% | 0.6% | 0.3% | $48k | 8.7% | 13.6% | 19.9% | 90.2% | 12.7% | 0.9% |
| Monteagle | 773 | 605 | 89.8% | 0.7% | 1.1% | 1.3% | $51k | 20.6% | 18.1% | 26.3% | 74.7% | 14.6% | 0.1% |
| Palmer | 682 | 534 | 92.7% | 0.0% | 0.8% | 0.7% | $52k | 9.8% | 17.2% | 20.3% | 91.9% | 10.6% | 0.0% |
| Pelham Valley | 1,371 | 1,056 | 90.1% | 0.3% | 1.3% | 0.3% | $56k | 25.8% | 11.9% | 24.0% | 83.3% | 19.5% | 0.0% |
| Tracy City | 2,853 | 2,165 | 93.0% | 1.4% | 0.3% | 2.6% | $52k | 14.2% | 28.8% | 17.9% | 70.0% | 13.2% | 0.2% |
Van Buren: 7 precincts
| Precinct | Population | Voting-age pop. | % White non-Hisp. | % Hispanic | % Black | % Asian | Median income* | % Bachelor's+ | % 18-29 (of adults) | % 65+ | % Homeowners | % Below poverty | % Spanish at home (adults) |
|---|---|---|---|---|---|---|---|---|---|---|---|---|---|
| Cedar Grove Community Cntr. | 788 | 620 | 95.1% | 3.5% | 0.6% | 0.4% | $66k | 15.5% | 16.2% | 19.9% | 85.7% | 19.6% | 3.3% |
| Cummingsville Community Cntr. | 717 | 589 | 94.0% | 3.4% | 0.5% | 0.3% | $56k | 13.6% | 14.5% | 24.4% | 84.1% | 17.1% | 2.7% |
| Fall Creek Falls Comm. Center | 1,053 | 872 | 94.1% | 1.4% | 1.3% | 0.0% | $43k | 10.6% | 13.5% | 28.0% | 80.3% | 17.9% | 0.5% |
| Piney Fire Hall | 1,525 | 1,215 | 94.1% | 1.6% | 0.2% | 0.0% | $56k | 13.6% | 14.6% | 25.0% | 89.0% | 13.0% | 1.6% |
| Spencer 1 | 571 | 496 | 91.9% | 2.6% | 0.4% | 0.0% | $47k | 11.5% | 12.1% | 31.4% | 85.6% | 9.5% | 1.9% |
| Spencer 5 | 970 | 758 | 95.1% | 3.2% | 0.4% | 0.3% | $66k | 15.4% | 16.3% | 20.1% | 86.7% | 19.0% | 3.0% |
| White Hill Community Cntr. | 950 | 703 | 95.9% | 0.9% | 0.0% | 0.0% | $65k | 15.7% | 17.0% | 19.7% | 92.2% | 16.2% | 1.5% |
*Median income is approximate (see note above). ACS 2020-2024 5-year.
Nonpartisan voter information. GOTV Polling does not endorse any candidate.