
Texas's 27th Congressional District
U.S. House · Texas · District 27 · General election: Tuesday, November 3, 2026
Candidates on the November 3 ballot
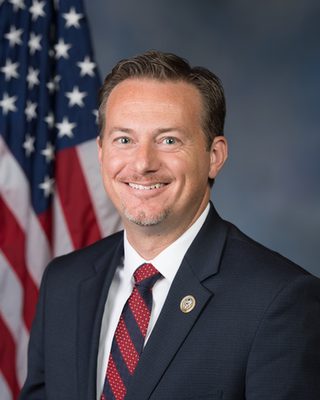 Michael CloudRepublicanPhoto: U.S. Congress
- Tanya LloydDemocratic
Source: Texas Secretary of State, 2026 Ballot Certification, certified list (2026-08-28; retrieved 2026-10-30). Names are printed in capitals on the certification; shown here in title case. Order of names does not reflect ballot order. Incumbent tags appear only where the official list marks incumbents. Photos come from the Candidate Alerts database where one is on file; otherwise initials are shown.
Federal campaign finance filings for this seat: FEC election page (FEC registration is not the same as ballot qualification).
Certified candidates
- Michael Cloud RepublicanIncumbent @RepCloudTX
- Tanya Lloyd Democratic
Certified candidate list from Candidate Alerts, as of 2026-09-24, based on Texas Secretary of State. Includes candidates the database marks as on the November 3 ballot. Incumbent tags here follow the database.
Past election results
Held under the district lines in effect at the time. Those boundaries differ from the 2026 district.
| Candidate | Party | Votes | Share |
|---|---|---|---|
| Cloud | Republican | 183,970 | 66.0% |
| Lloyd | Democratic | 94,595 | 34.0% |
| Total | 278,565 |
Source: Texas Legislative Council, Capitol Data Portal, Comprehensive Election Datasets (from SOS official canvass). Status: Official canvass returns (Texas Secretary of State), compiled by the Texas Legislative Council and reported by 2024 primary/general election VTDs
Held under the district lines in effect at the time. Those boundaries differ from the 2026 district.
| Candidate | Party | Votes | Share |
|---|---|---|---|
| Cloud | Republican | 133,416 | 64.4% |
| Perez | Democratic | 73,611 | 35.6% |
| Total | 207,027 |
Source: Texas Legislative Council, Capitol Data Portal, Comprehensive Election Datasets (from SOS official canvass). Status: Official canvass returns (Texas Secretary of State), compiled by the Texas Legislative Council and reported by 2022 general election VTDs
Held under the district lines in effect at the time. Those boundaries differ from the 2026 district.
| Candidate | Party | Votes | Share |
|---|---|---|---|
| Cloud | Republican | 172,305 | 63.1% |
| De La Fuente | Democratic | 95,466 | 34.9% |
| Gray | Libertarian | 5,482 | 2.0% |
| Total | 273,253 |
Source: Texas Legislative Council, Capitol Data Portal, Comprehensive Election Datasets (from SOS official canvass). Status: Official canvass returns (Texas Secretary of State), compiled by the Texas Legislative Council and reported by 2020 general election VTDs
Certified results from state or county election authorities, as compiled in the Candidate Alerts precinct results database (public API candidatealerts.com/api/district-results). Totals are sums of certified precinct and county-level rows.
Demographics
2020 Census demographics by district are not yet published in this data set.
40 of 440 precincts are above 50%, and 179 are above 25%. Source: Census American Community Survey 2020-2024 5-year block groups, allocated to current precinct shapes by area.
Poll status
Map
Share of adults (18+) who speak Spanish at home, by precinct. Census ACS 2020-2024 5-year estimates on the current precinct layer. Hover a precinct for its value.
Texas votes on new congressional district lines in 2026. The Census 119th Congress boundary file does not reflect the new lines, so only the state outline is shown here.
Precinct map: past elections and demographics
Choose a layer above. Hover a precinct for its values.
Precinct results
Certified precinct results on current precinct shapes, grouped by county. 465 precincts. "(part)" marks a precinct only partly inside this district; its full vote is shown, so district sums are approximate and are not the official district total. Elections were held under older lines and are shown on the 2026 district.
| County | 2024 President | 2022 Governor | 2020 President | |||
|---|---|---|---|---|---|---|
| Margin | Votes | Margin | Votes | Margin | Votes | |
| Hays | D+8.2 | 78,142 | D+15.1 | 49,906 | D+14.7 | 50,866 |
| Travis | D+34.8 | 52,911 | D+41.4 | 37,594 | D+40.5 | 55,188 |
| Bastrop | R+18.3 | 39,917 | R+16.1 | 29,256 | R+13.7 | 36,762 |
| Victoria | R+42.5 | 35,305 | R+47.7 | 25,298 | R+38.2 | 33,784 |
| Washington | R+54.5 | 18,265 | R+58.3 | 13,974 | R+49.8 | 17,449 |
| Wharton | R+51.8 | 16,471 | R+54.8 | 12,157 | R+45.1 | 15,244 |
| Nueces | D+10.1 | 15,253 | D+17.4 | 10,804 | D+24.4 | 17,394 |
| Caldwell | R+14.4 | 15,737 | R+13.7 | 11,365 | R+9.1 | 14,973 |
| Austin | R+62.5 | 15,415 | R+65.4 | 11,216 | R+57.8 | 12,314 |
| Fayette | R+61.3 | 13,359 | R+65.7 | 10,505 | R+58.0 | 12,960 |
| Matagorda | R+50.5 | 13,312 | R+52.2 | 9,724 | R+44.5 | 13,727 |
| San Patricio | R+46.2 | 12,461 | R+46.3 | 8,858 | R+43.5 | 12,046 |
| Colorado | R+57.1 | 10,012 | R+62.1 | 7,550 | R+50.6 | 9,975 |
| Calhoun | R+52.1 | 7,841 | R+52.5 | 5,593 | R+44.4 | 7,868 |
| Aransas | R+57.7 | 7,661 | R+60.4 | 5,620 | R+53.8 | 6,936 |
| Jackson | R+70.7 | 6,300 | R+75.3 | 4,598 | R+66.1 | 6,351 |
| Refugio | R+28.6 | 385 | R+29.4 | 337 | R+20.3 | 403 |
| All counties (approx.) | R+18.3 | 358,747 | R+18.1 | 254,355 | R+13.4 | 324,240 |
Hays: 77 precincts
| Precinct | 2024 President | 2022 Governor | 2020 President | |||
|---|---|---|---|---|---|---|
| Margin | Votes | Margin | Votes | Margin | Votes | |
| 0110 (part) | D+8.4 | 1,886 | D+15.7 | 1,251 | D+15.3 | 1,587 |
| 0113 (part) | D+37.8 | 1,340 | D+55.6 | 1,022 | D+47.4 | 783 |
| 0120 (part) | D+21.3 | 1,986 | D+23.9 | 773 | D+22.8 | 911 |
| 0121 (part) | D+52.5 | 1,685 | D+81.1 | 753 | D+68.8 | 1,350 |
| 0122 (part) | - | - | D+74.8 | 456 | D+61.3 | 685 |
| 0123 (part) | - | - | - | - | D+52.4 | 735 |
| 0125 | D+11.5 | 1,149 | D+20.4 | 563 | - | - |
| 0126 | - | - | - | - | D+15.7 | 2,244 |
| 0127 | - | - | - | - | D+13.5 | 743 |
| 0128 | D+5.4 | 1,285 | D+11.1 | 369 | D+18.7 | 1,976 |
| 0129 | - | - | - | - | D+27.4 | 1,750 |
| 0130 | - | - | - | - | D+29.0 | 2,135 |
| 0134 | D+17.9 | 1,538 | D+15.1 | 667 | - | - |
| 0136 | D+13.7 | 1,845 | D+30.7 | 952 | - | - |
| 0146 | D+50.0 | 4 | - | - | - | - |
| 0200 | - | 0 | - | 0 | - | - |
| 0203 | D+18.0 | 2,010 | D+25.6 | 1,481 | - | - |
| 0204 | D+8.2 | 1,085 | D+30.6 | 614 | - | - |
| 0205 | D+10.4 | 2,216 | D+20.0 | 1,539 | - | - |
| 0206 | D+8.5 | 2,053 | D+18.9 | 1,309 | - | - |
| 0216 | R+3.6 | 363 | D+42.3 | 71 | - | - |
| 0219 | D+9.0 | 633 | D+15.7 | 394 | - | - |
| 0220 | D+12.1 | 2,406 | D+16.3 | 1,852 | D+10.0 | 2,269 |
| 0221 | D+16.5 | 2,637 | D+28.5 | 1,519 | D+23.0 | 1,850 |
| 0222 | - | - | - | - | D+18.9 | 1,327 |
| 0223 | D+13.5 | 1,796 | D+19.2 | 1,232 | D+21.8 | 1,809 |
| 0224 | - | - | - | - | D+0.5 | 1,993 |
| 0225 | R+8.5 | 352 | R+21.7 | 115 | R+19.5 | 1,229 |
| 0226 | - | - | - | - | D+1.7 | 2,236 |
| 0227 | D+18.7 | 1,934 | D+30.6 | 1,400 | - | - |
| 0228 | D+16.6 | 3,219 | D+31.2 | 1,461 | - | - |
| 0229 | - | - | - | - | D+28.3 | 1,288 |
| 0231 | D+17.9 | 2,407 | D+35.5 | 1,528 | D+31.1 | 2,358 |
| 0233 | - | - | - | - | D+21.4 | 906 |
| 0234 | - | - | - | - | D+18.0 | 787 |
| 0235 | - | - | - | - | D+1.4 | 2,901 |
| 0236 | - | - | - | - | R+13.9 | 1,313 |
| 0238 | - | - | - | - | D+46.9 | 239 |
| 0252 | D+15.6 | 1,677 | D+25.4 | 1,109 | - | - |
| 0253 | D+19.3 | 1,891 | D+30.5 | 1,344 | - | - |
| 0254 | D+19.6 | 1,938 | D+31.8 | 1,449 | - | - |
| 0319 | R+1.1 | 1,297 | D+7.0 | 1,012 | - | - |
| 0320 (part) | R+21.3 | 1,536 | R+21.1 | 1,553 | - | - |
| 0325 | R+10.9 | 421 | R+14.5 | 358 | - | - |
| 0342 | R+5.7 | 2,284 | - | - | - | - |
| 0347 | D+6.0 | 1,515 | D+7.2 | 1,272 | - | - |
| 0351 (part) | D+40.1 | 891 | D+73.3 | 629 | - | - |
| 0371 | D+9.6 | 2,334 | D+13.2 | 1,616 | - | - |
| 0372 | D+34.6 | 162 | D+39.2 | 102 | - | - |
| 0373 (part) | R+26.2 | 317 | - | - | - | - |
| 0375 | R+31.7 | 41 | - | - | - | - |
| 0376 | D+10.4 | 67 | - | - | - | - |
| 0400 | - | 0 | - | 0 | - | - |
| 0416 | - | - | - | - | D+26.5 | 102 |
| 0417 | - | - | - | - | D+7.4 | 1,872 |
| 0418 | - | - | - | - | R+33.3 | 3 |
| 0419 | - | - | - | - | D+5.4 | 1,620 |
| 0421 | - | - | - | - | R+21.6 | 51 |
| 0422 | D+13.7 | 1,167 | D+18.3 | 890 | - | - |
| 0423 | D+10.5 | 1,457 | - | - | - | - |
| 0424 | D+3.0 | 1,938 | D+2.7 | 1,582 | - | - |
| 0425 | R+18.8 | 728 | R+20.7 | 555 | - | - |
| 0426 | D+5.5 | 2,139 | D+1.2 | 1,805 | - | - |
| 0430 | R+0.1 | 1,109 | R+1.5 | 890 | - | - |
| 0432 | R+13.8 | 1,859 | R+13.8 | 1,483 | - | - |
| 0435 | R+0.4 | 2,956 | D+1.3 | 2,386 | - | - |
| 0436 | R+21.2 | 2,002 | R+19.4 | 1,245 | - | - |
| 0438 | D+34.8 | 411 | D+38.5 | 296 | - | - |
| 0442 (part) | D+4.5 | 2,650 | D+5.7 | 2,166 | D+8.7 | 2,733 |
| 0443 (part) | R+5.6 | 2,514 | R+1.9 | 1,959 | R+2.0 | 3,497 |
| 0446 | R+3.9 | 2,806 | R+3.3 | 1,980 | R+2.4 | 1,971 |
| 0447 | - | - | - | - | D+7.7 | 1,613 |
| 0450 (part) | R+28.5 | 1,065 | - | - | - | - |
| 0451 (part) | D+3.2 | 1,141 | D+3.3 | 904 | - | - |
| 0453 | - | 0 | - | - | - | - |
| 0455 | - | 0 | - | - | - | - |
| 0456 | - | 0 | - | - | - | - |
Travis: 48 precincts
| Precinct | 2024 President | 2022 Governor | 2020 President | |||
|---|---|---|---|---|---|---|
| Margin | Votes | Margin | Votes | Margin | Votes | |
| 0101 (part) | - | - | - | - | D+64.1 | 5,583 |
| 0105 (part) | - | - | - | - | D+51.1 | 9,094 |
| 0106 (part) | - | - | - | - | D+12.7 | 3,082 |
| 0115 | - | - | - | - | - | 0 |
| 0127 (part) | D+38.8 | 2,409 | D+51.1 | 1,483 | - | - |
| 0143 | D+37.5 | 2,746 | D+53.8 | 1,602 | - | - |
| 0144 | D+39.7 | 1,609 | D+58.8 | 1,013 | - | - |
| 0145 (part) | D+15.5 | 1,782 | D+14.7 | 845 | - | - |
| 0302 | - | - | - | - | D+30.6 | 3,246 |
| 0303 | - | - | - | - | D+20.8 | 2,725 |
| 0304 (part) | - | - | - | - | D+39.5 | 3,646 |
| 0310 | - | - | - | - | D+36.7 | 5,811 |
| 0315 (part) | - | - | - | - | D+33.0 | 3,676 |
| 0335 (part) | D+37.1 | 2,760 | D+38.1 | 2,297 | - | - |
| 0336 | D+32.7 | 2,916 | D+40.6 | 2,228 | - | - |
| 0337 | D+41.8 | 3,703 | D+52.3 | 2,517 | - | - |
| 0343A (part) | D+41.5 | 2,209 | - | - | - | - |
| 0343B | D+41.5 | 41 | - | - | - | - |
| 0343a (part) | - | - | D+42.5 | 1,859 | - | - |
| 0343b | - | - | D+40.0 | 35 | - | - |
| 0346 (part) | D+37.7 | 3,103 | D+38.1 | 2,613 | - | - |
| 0347 (part) | D+37.7 | 2,575 | D+39.8 | 2,214 | - | - |
| 0348A | D+36.4 | 2,376 | - | - | - | - |
| 0348B | D+36.5 | 381 | - | - | - | - |
| 0348a | - | - | D+39.4 | 1,822 | - | - |
| 0348b | - | - | D+38.8 | 291 | - | - |
| 0349 | D+31.7 | 2,642 | D+29.6 | 2,259 | - | - |
| 0360 | D+22.6 | 2,540 | D+22.2 | 2,182 | - | - |
| 0367 (part) | - | - | - | - | D+35.4 | 6,065 |
| 0401 (part) | - | - | - | - | D+40.5 | 2,019 |
| 0402 (part) | - | - | - | - | D+48.6 | 2,789 |
| 0403 (part) | - | - | - | - | D+21.6 | 1,048 |
| 0406 | - | - | - | - | D+25.2 | 2,717 |
| 0411 (part) | - | - | - | - | D+53.0 | 1,970 |
| 0413 (part) | - | - | - | - | D+64.7 | 1,717 |
| 0456 (part) | D+47.6 | 1,703 | D+59.0 | 1,310 | - | - |
| 0465 (part) | D+54.0 | 1,545 | D+67.3 | 1,091 | - | - |
| 0472 | D+26.4 | 2,960 | D+26.4 | 2,026 | - | - |
| 0474 (part) | D+32.5 | 2,526 | D+48.8 | 1,063 | - | - |
| 0475 | D+20.2 | 768 | D+21.6 | 449 | - | - |
| 0481 (part) | D+32.3 | 2,117 | D+41.0 | 1,365 | - | - |
| 0482 (part) | D+31.5 | 403 | D+44.1 | 254 | - | - |
| 0483 | D+34.5 | 2,704 | D+50.0 | 1,585 | - | - |
| 0490 | D+7.1 | 1,800 | D+9.2 | 1,313 | - | - |
| 0491A (part) | D+48.4 | 2,593 | - | - | - | - |
| 0491B | - | 0 | - | - | - | - |
| 0491a (part) | - | - | D+65.8 | 1,878 | - | - |
| 0491b | - | - | - | 0 | - | - |
Bastrop: 41 precincts
| Precinct | 2024 President | 2022 Governor | 2020 President | |||
|---|---|---|---|---|---|---|
| Margin | Votes | Margin | Votes | Margin | Votes | |
| 1001 | R+33.7 | 306 | R+23.8 | 244 | R+23.7 | 2,756 |
| 1002 | R+16.9 | 586 | R+9.2 | 479 | D+6.0 | 1,760 |
| 1003 | R+26.4 | 2,131 | R+21.8 | 1,604 | R+10.2 | 2,570 |
| 1004 | D+3.7 | 1,530 | D+14.0 | 1,223 | R+6.5 | 1,668 |
| 1005 | R+24.3 | 843 | R+19.8 | 650 | - | - |
| 1006 | R+16.0 | 1,501 | R+6.9 | 1,024 | - | - |
| 1007 | R+19.5 | 2,544 | R+13.7 | 1,482 | - | - |
| 1008 | R+4.3 | 1,293 | D+0.7 | 883 | - | - |
| 1009 | R+13.1 | 1,378 | R+7.3 | 1,059 | - | - |
| 1022 | - | - | - | - | R+17.3 | 2,615 |
| 2005 | - | - | - | - | R+16.1 | 1,950 |
| 2006 | - | - | - | - | R+32.0 | 1,234 |
| 2007 | - | - | - | - | R+47.9 | 1,796 |
| 2008 | - | - | - | - | R+37.1 | 801 |
| 2009 | - | - | - | - | R+26.2 | 1,030 |
| 2010 | R+16.2 | 420 | R+1.9 | 315 | R+37.5 | 1,116 |
| 2011 | R+13.3 | 1,968 | R+4.5 | 1,197 | R+22.2 | 2,002 |
| 2012 | R+36.4 | 1,342 | R+37.4 | 1,023 | - | - |
| 2013 | R+26.5 | 2,241 | R+24.5 | 1,776 | - | - |
| 2014 | R+36.5 | 2,237 | R+38.7 | 1,737 | - | - |
| 2015 | R+27.4 | 2,212 | R+22.6 | 1,685 | - | - |
| 2016 | R+50.0 | 2,140 | R+50.2 | 1,650 | - | - |
| 3012 | - | - | - | - | R+48.0 | 758 |
| 3013 | - | - | - | - | R+38.5 | 1,140 |
| 3014 | - | - | - | - | D+2.3 | 1,674 |
| 3015 | - | - | - | - | D+19.0 | 1,761 |
| 3016 | - | - | - | - | R+7.0 | 1,954 |
| 3017 | R+25.5 | 1,923 | R+27.3 | 1,465 | - | - |
| 3018 | R+42.8 | 1,222 | R+44.0 | 984 | - | - |
| 3019 | R+9.2 | 1,544 | R+8.3 | 1,146 | - | - |
| 3020 | D+11.9 | 1,803 | D+16.2 | 1,174 | - | - |
| 4017 | - | - | - | - | D+17.7 | 2,103 |
| 4018 (part) | - | - | - | - | R+33.0 | 521 |
| 4019 | - | - | - | - | R+10.0 | 1,857 |
| 4020 | - | - | - | - | D+7.9 | 2,661 |
| 4021 | R+13.1 | 1,791 | R+10.1 | 1,393 | R+32.2 | 1,035 |
| 4022 | R+15.4 | 1,715 | R+19.3 | 1,272 | - | - |
| 4023 | R+38.9 | 1,036 | R+40.4 | 778 | - | - |
| 4024 (part) | R+18.9 | 1,204 | R+26.2 | 842 | - | - |
| 4025 | D+23.1 | 1,376 | D+29.0 | 1,040 | - | - |
| 4026 | D+14.1 | 1,631 | D+15.4 | 1,131 | - | - |
Victoria: 35 precincts
| Precinct | 2024 President | 2022 Governor | 2020 President | |||
|---|---|---|---|---|---|---|
| Margin | Votes | Margin | Votes | Margin | Votes | |
| 0001 | D+8.8 | 249 | D+14.3 | 168 | D+17.9 | 274 |
| 0002 | R+18.0 | 550 | R+12.1 | 429 | R+16.8 | 567 |
| 0003 | R+34.2 | 733 | R+34.1 | 552 | R+22.5 | 743 |
| 0004 | R+7.3 | 627 | R+8.6 | 347 | D+10.8 | 669 |
| 0005 | R+7.8 | 1,225 | R+5.7 | 823 | D+3.3 | 1,268 |
| 0006 | D+11.0 | 127 | D+23.5 | 85 | D+22.7 | 141 |
| 0007 | D+4.5 | 1,202 | D+5.1 | 742 | D+21.3 | 1,060 |
| 0008 | R+17.1 | 1,235 | R+13.1 | 746 | R+3.3 | 1,078 |
| 0009 | R+26.1 | 471 | R+20.8 | 327 | R+16.0 | 626 |
| 0010 | R+31.1 | 832 | R+33.0 | 561 | R+29.2 | 1,052 |
| 0011 | R+54.8 | 303 | R+65.0 | 263 | R+60.2 | 309 |
| 0012 | R+33.8 | 391 | R+38.3 | 248 | R+19.7 | 396 |
| 0013 | R+25.1 | 710 | R+23.5 | 366 | R+8.2 | 707 |
| 0014 | R+52.3 | 924 | R+58.3 | 659 | R+50.2 | 866 |
| 0015 | R+64.6 | 96 | R+56.9 | 72 | R+63.9 | 97 |
| 0016 | R+67.2 | 299 | R+69.2 | 237 | R+63.7 | 300 |
| 0017 | R+27.1 | 295 | R+27.9 | 222 | R+21.8 | 362 |
| 0018 | R+63.7 | 2,745 | R+68.8 | 2,039 | R+61.5 | 2,670 |
| 0019 | R+26.0 | 1,803 | R+30.8 | 1,169 | R+22.3 | 1,707 |
| 0020 | R+68.9 | 991 | R+71.8 | 790 | R+64.1 | 979 |
| 0021 | R+53.7 | 3,108 | R+56.7 | 2,352 | R+51.0 | 2,862 |
| 0022 | R+73.2 | 1,322 | R+81.5 | 1,066 | R+77.5 | 1,242 |
| 0023 | R+64.3 | 1,284 | R+72.3 | 954 | R+66.8 | 1,173 |
| 0024 | R+69.9 | 1,274 | R+74.7 | 995 | R+71.7 | 1,116 |
| 0025 | R+35.4 | 2,647 | R+39.5 | 1,797 | R+33.7 | 2,421 |
| 0026 | R+64.7 | 590 | R+69.1 | 443 | R+54.0 | 755 |
| 0027 | R+81.8 | 1,450 | R+85.5 | 1,114 | R+84.2 | 1,305 |
| 0028 | R+79.3 | 367 | R+87.0 | 276 | R+78.8 | 358 |
| 0029 | R+44.7 | 1,905 | R+52.0 | 1,522 | R+47.9 | 1,846 |
| 0030 | R+33.4 | 323 | R+43.9 | 228 | R+32.0 | 322 |
| 0031 | R+21.5 | 729 | R+24.6 | 460 | - | - |
| 0032 | D+1.3 | 625 | D+4.7 | 358 | D+9.6 | 664 |
| 0033 | R+50.4 | 3,238 | R+56.4 | 2,519 | R+50.3 | 3,138 |
| 0034 | D+10.6 | 462 | D+30.6 | 255 | D+32.0 | 515 |
| 0035 | D+15.6 | 173 | D+22.8 | 114 | D+34.7 | 196 |
Washington: 21 precincts
| Precinct | 2024 President | 2022 Governor | 2020 President | |||
|---|---|---|---|---|---|---|
| Margin | Votes | Margin | Votes | Margin | Votes | |
| 0101 | R+38.4 | 928 | R+43.2 | 745 | R+30.0 | 928 |
| 0104 | D+16.5 | 1,095 | D+21.7 | 779 | D+42.6 | 1,078 |
| 0109 | R+66.6 | 863 | R+70.6 | 671 | R+61.4 | 826 |
| 0115 | R+54.6 | 736 | R+61.5 | 563 | R+52.8 | 706 |
| 0117 | D+45.5 | 44 | D+50.0 | 24 | D+53.2 | 47 |
| 0121 | R+36.2 | 58 | R+47.1 | 51 | R+17.9 | 67 |
| 0202 | R+100.0 | 3 | R+60.0 | 5 | R+30.1 | 183 |
| 0203 | R+62.2 | 1,612 | R+63.9 | 1,267 | R+56.8 | 1,436 |
| 0205 | R+50.1 | 1,968 | R+54.8 | 1,523 | R+47.0 | 1,928 |
| 0208 | R+69.5 | 1,277 | R+74.2 | 976 | R+73.2 | 1,158 |
| 0307 | R+49.4 | 1,665 | R+51.4 | 1,069 | R+43.1 | 1,175 |
| 0311 | R+67.4 | 996 | R+70.8 | 759 | R+61.3 | 942 |
| 0312 | R+72.3 | 1,014 | R+76.4 | 792 | R+68.2 | 958 |
| 0316 | - | - | - | - | R+56.3 | 183 |
| 0320 | R+72.4 | 1,519 | R+75.5 | 1,249 | R+72.1 | 1,526 |
| 0406 | R+44.2 | 1,271 | R+48.5 | 943 | R+43.1 | 1,139 |
| 0410 | R+65.9 | 988 | R+70.8 | 807 | R+66.1 | 958 |
| 0413 | R+71.0 | 1,445 | R+74.4 | 1,143 | R+71.8 | 712 |
| 0414 | - | - | - | - | R+73.5 | 648 |
| 0418 | R+42.9 | 392 | R+43.5 | 313 | R+35.8 | 450 |
| 0419 | R+50.6 | 391 | R+46.4 | 295 | R+43.4 | 401 |
Wharton: 12 precincts
| Precinct | 2024 President | 2022 Governor | 2020 President | |||
|---|---|---|---|---|---|---|
| Margin | Votes | Margin | Votes | Margin | Votes | |
| 0101 | R+43.3 | 808 | R+44.5 | 742 | - | - |
| 0102 | R+48.9 | 2,006 | R+54.7 | 1,504 | R+49.9 | 1,765 |
| 0103 | R+52.5 | 1,592 | R+51.4 | 1,142 | R+57.5 | 1,360 |
| 0201 | R+77.1 | 2,157 | R+79.9 | 1,624 | R+74.4 | 2,043 |
| 0202 | D+16.4 | 531 | D+14.6 | 384 | D+31.0 | 555 |
| 0203 | R+7.6 | 1,808 | R+10.0 | 1,239 | D+13.6 | 1,849 |
| 0301 | R+73.8 | 1,791 | R+76.3 | 1,397 | R+71.3 | 1,778 |
| 0302 | R+59.9 | 1,454 | R+60.9 | 1,022 | R+52.1 | 1,494 |
| 0303 | R+80.4 | 1,522 | R+84.5 | 1,193 | R+78.1 | 1,524 |
| 0401 | R+34.9 | 1,409 | R+33.8 | 949 | R+19.7 | 1,527 |
| 0402 | R+61.3 | 977 | R+63.4 | 666 | R+48.2 | 902 |
| 0403 | R+33.9 | 416 | R+38.0 | 295 | R+31.5 | 447 |
Nueces: 35 precincts
| Precinct | 2024 President | 2022 Governor | 2020 President | |||
|---|---|---|---|---|---|---|
| Margin | Votes | Margin | Votes | Margin | Votes | |
| 0001 | R+3.9 | 696 | R+2.9 | 483 | D+4.4 | 792 |
| 0007 (part) | D+23.0 | 278 | D+48.4 | 184 | D+45.5 | 345 |
| 0019 | R+43.3 | 2,315 | R+43.7 | 1,916 | R+40.1 | 2,387 |
| 0021 | R+37.3 | 260 | R+42.3 | 213 | R+33.6 | 259 |
| 0030 | D+39.6 | 48 | D+56.5 | 23 | D+69.4 | 62 |
| 0031 | D+23.1 | 182 | D+29.8 | 124 | D+41.8 | 225 |
| 0033 | D+19.3 | 197 | D+29.5 | 129 | D+27.3 | 242 |
| 0038 | D+67.2 | 58 | D+38.9 | 36 | D+57.3 | 124 |
| 0041 | D+21.8 | 147 | D+30.6 | 85 | D+19.0 | 158 |
| 0043 | D+31.7 | 202 | D+40.3 | 149 | D+39.8 | 274 |
| 0044 | D+21.3 | 296 | D+32.4 | 182 | D+37.8 | 362 |
| 0045 | D+35.3 | 139 | D+56.4 | 78 | D+54.7 | 190 |
| 0046 | D+36.5 | 85 | D+48.0 | 50 | D+40.7 | 118 |
| 0047 | D+19.8 | 106 | D+27.6 | 76 | D+41.1 | 146 |
| 0052 | D+39.9 | 383 | D+51.1 | 274 | D+55.6 | 437 |
| 0056 | D+23.4 | 363 | D+37.3 | 236 | D+35.6 | 419 |
| 0060 | D+42.6 | 324 | D+54.7 | 212 | D+57.1 | 443 |
| 0061 | D+47.0 | 268 | D+73.3 | 161 | D+59.9 | 319 |
| 0062 (part) | D+24.1 | 303 | D+47.1 | 208 | D+34.7 | 377 |
| 0071 | D+28.6 | 654 | D+33.7 | 463 | D+38.9 | 750 |
| 0073 | D+29.7 | 599 | D+47.7 | 426 | D+38.6 | 707 |
| 0074 | D+34.0 | 632 | D+41.5 | 441 | D+48.9 | 749 |
| 0075 | D+36.3 | 744 | D+53.2 | 509 | D+48.1 | 918 |
| 0076 | D+19.6 | 225 | D+43.8 | 144 | D+45.0 | 282 |
| 0077 | D+54.6 | 97 | D+66.1 | 62 | D+62.3 | 114 |
| 0078 | D+32.1 | 680 | D+53.4 | 442 | D+49.4 | 771 |
| 0079 | D+29.6 | 479 | D+37.6 | 306 | D+39.8 | 485 |
| 0080 | D+35.7 | 572 | D+54.4 | 373 | D+55.9 | 694 |
| 0083 | D+32.2 | 397 | D+50.4 | 258 | D+44.9 | 470 |
| 0085 | D+40.4 | 183 | D+56.3 | 126 | D+68.4 | 206 |
| 0097 | D+38.7 | 429 | D+48.6 | 292 | D+46.2 | 548 |
| 0098 | D+41.9 | 694 | D+52.1 | 539 | D+54.2 | 840 |
| 0099 (part) | D+22.5 | 191 | D+34.8 | 141 | D+34.4 | 244 |
| 0103 (part) | R+34.4 | 1,852 | R+28.9 | 1,336 | R+25.4 | 1,721 |
| 0113 | D+34.9 | 175 | D+60.6 | 127 | D+57.9 | 216 |
Caldwell: 42 precincts
| Precinct | 2024 President | 2022 Governor | 2020 President | |||
|---|---|---|---|---|---|---|
| Margin | Votes | Margin | Votes | Margin | Votes | |
| 0100 | D+24.7 | 364 | D+25.3 | 328 | D+21.0 | 319 |
| 0101 | D+15.0 | 480 | D+8.7 | 381 | D+19.8 | 499 |
| 0102 | R+42.6 | 526 | R+37.2 | 411 | R+37.7 | 522 |
| 0103 | R+0.1 | 2,170 | D+3.8 | 1,491 | R+1.9 | 1,520 |
| 0104 | R+35.2 | 566 | R+42.8 | 355 | R+39.0 | 359 |
| 0105 | - | - | - | - | D+31.1 | 74 |
| 0107 | - | - | - | - | - | 0 |
| 0108 | R+5.5 | 586 | D+4.4 | 365 | D+4.8 | 62 |
| 0109 | - | - | - | - | R+80.0 | 30 |
| 0110 | - | - | - | - | R+5.2 | 97 |
| 0111 | D+0.3 | 915 | D+1.7 | 582 | D+0.4 | 689 |
| 0112 | - | - | - | - | - | 0 |
| 0113 | - | - | - | - | - | 0 |
| 0114 | - | - | - | - | - | 0 |
| 0115 | - | - | - | - | - | 0 |
| 0116 | - | - | - | - | - | 0 |
| 0117 | - | - | - | - | - | 0 |
| 0118 | - | - | - | - | R+6.9 | 87 |
| 0201 | R+22.6 | 636 | R+22.1 | 456 | R+23.2 | 647 |
| 0202 | R+42.4 | 794 | R+45.8 | 587 | R+37.4 | 779 |
| 0203 | R+55.8 | 937 | R+59.2 | 665 | R+48.3 | 764 |
| 0204 | R+43.5 | 1,069 | R+52.4 | 787 | R+46.5 | 968 |
| 0205 | R+67.2 | 241 | R+70.8 | 219 | R+63.6 | 228 |
| 0206 | R+26.2 | 645 | R+35.8 | 461 | R+14.4 | 633 |
| 0300 | D+17.7 | 293 | D+3.5 | 170 | - | - |
| 0301 | R+5.9 | 778 | D+0.8 | 635 | D+0.9 | 762 |
| 0302 | R+7.3 | 616 | R+8.1 | 468 | D+0.8 | 1,037 |
| 0303 | R+24.9 | 522 | R+26.7 | 363 | R+19.5 | 528 |
| 0305 | R+24.6 | 427 | R+26.5 | 291 | R+20.9 | 359 |
| 0306 | R+4.4 | 435 | D+6.1 | 310 | R+1.7 | 239 |
| 0307 | - | - | - | - | - | 0 |
| 0400 | R+9.1 | 541 | D+1.6 | 374 | R+6.7 | 45 |
| 0401 | D+27.8 | 489 | D+42.5 | 351 | D+41.9 | 492 |
| 0402 | D+23.8 | 672 | D+32.6 | 491 | D+26.0 | 1,188 |
| 0404 | D+0.2 | 659 | D+4.8 | 484 | D+9.5 | 1,058 |
| 0405 | R+33.0 | 376 | R+33.5 | 340 | R+18.8 | 776 |
| 0407 | - | - | - | - | D+25.0 | 8 |
| 0408 | - | - | - | - | D+38.5 | 13 |
| 0409 | - | - | - | - | R+23.1 | 26 |
| 0410 | - | - | - | - | - | 0 |
| 0411 | - | - | - | - | - | 0 |
| 0412 | - | - | - | - | D+25.5 | 165 |
Austin: 24 precincts
| Precinct | 2024 President | 2022 Governor | 2020 President | |||
|---|---|---|---|---|---|---|
| Margin | Votes | Margin | Votes | Margin | Votes | |
| 0101 | R+63.3 | 996 | R+68.1 | 715 | R+59.6 | 947 |
| 0102 | R+62.3 | 1,090 | R+61.8 | 814 | R+57.0 | 1,036 |
| 0103 | R+68.2 | 1,173 | R+75.3 | 933 | R+70.5 | 1,153 |
| 0104 | R+69.1 | 664 | R+73.7 | 472 | R+67.6 | 614 |
| 0205 | R+66.0 | 2,133 | R+66.7 | 1,589 | - | - |
| 0206 | R+73.8 | 1,110 | R+74.4 | 894 | - | - |
| 0207 | R+74.7 | 600 | R+69.9 | 482 | - | - |
| 0208 | R+62.2 | 555 | R+60.7 | 450 | R+69.8 | 587 |
| 0209 | - | - | - | - | R+58.5 | 494 |
| 0210 | - | - | - | - | R+69.0 | 565 |
| 0211 | - | - | - | - | R+73.8 | 298 |
| 0309 | R+79.4 | 562 | R+83.7 | 436 | - | - |
| 0310 | R+60.6 | 2,091 | R+64.6 | 1,439 | - | - |
| 0311 | R+23.1 | 605 | R+17.3 | 392 | - | - |
| 0312 | - | - | - | - | R+82.9 | 496 |
| 0313 | - | - | - | - | R+7.2 | 676 |
| 0314 | - | - | - | - | R+54.2 | 1,975 |
| 0412 | R+47.1 | 467 | R+50.4 | 345 | - | - |
| 0413 | R+67.3 | 1,054 | R+74.3 | 841 | - | - |
| 0414 | R+54.9 | 1,265 | R+57.5 | 689 | - | - |
| 0415 | R+55.0 | 1,050 | R+55.6 | 725 | R+49.0 | 1,019 |
| 0416 | - | - | - | - | R+52.4 | 922 |
| 0417 | - | - | - | - | R+38.8 | 449 |
| 0418 | - | - | - | - | R+68.1 | 1,083 |
Fayette: 41 precincts
| Precinct | 2024 President | 2022 Governor | 2020 President | |||
|---|---|---|---|---|---|---|
| Margin | Votes | Margin | Votes | Margin | Votes | |
| 0002 | - | - | - | - | R+65.3 | 173 |
| 0003 | - | - | - | - | R+64.0 | 325 |
| 0004 | - | - | - | - | R+61.6 | 615 |
| 0005 | - | - | - | - | R+83.5 | 182 |
| 0006 | - | - | - | - | R+59.4 | 382 |
| 0007 | - | - | - | - | R+65.1 | 487 |
| 0008 | - | - | - | - | R+71.9 | 327 |
| 0009 | - | - | - | - | R+57.3 | 227 |
| 0010 | - | - | - | - | R+70.5 | 505 |
| 0011 | - | - | - | - | R+65.7 | 367 |
| 0012 | - | - | - | - | R+53.3 | 334 |
| 0013 | - | - | - | - | R+57.9 | 541 |
| 0014 | - | - | - | - | R+68.8 | 218 |
| 0015 | - | - | - | - | R+65.5 | 325 |
| 0016 | - | - | - | - | R+49.8 | 1,132 |
| 0017 | - | - | - | - | R+75.8 | 359 |
| 001E | - | - | - | - | R+62.2 | 678 |
| 001N | - | - | - | - | R+41.0 | 1,613 |
| 001W | - | - | - | - | R+49.1 | 582 |
| 0020 | - | - | - | - | R+65.9 | 590 |
| 0021 | - | - | - | - | R+71.3 | 209 |
| 0022 | - | - | - | - | R+57.3 | 150 |
| 0023 | - | - | - | - | R+68.5 | 197 |
| 0024 | - | - | - | - | R+68.7 | 201 |
| 0025 | - | - | - | - | R+53.2 | 1,780 |
| 0026 | - | - | - | - | R+54.2 | 461 |
| 0110 | R+63.3 | 804 | R+71.0 | 670 | - | - |
| 0112 | R+68.5 | 880 | R+69.5 | 681 | - | - |
| 0204 | R+70.8 | 1,178 | R+71.9 | 963 | - | - |
| 0207 | R+63.6 | 1,570 | R+66.3 | 1,254 | - | - |
| 0315 | R+65.3 | 603 | R+71.4 | 458 | - | - |
| 0316 | R+58.9 | 1,589 | R+64.3 | 1,196 | - | - |
| 0422 | R+68.1 | 602 | R+73.5 | 472 | - | - |
| 0423 | R+64.0 | 689 | R+70.7 | 564 | - | - |
| 0425 | R+57.4 | 1,821 | R+64.6 | 1,411 | - | - |
| 101N | R+50.0 | 1,380 | - | - | - | - |
| 101n | - | - | R+51.7 | 1,046 | - | - |
| 201E | R+61.9 | 958 | - | - | - | - |
| 201e | - | - | R+67.2 | 756 | - | - |
| 301W | R+56.7 | 1,285 | - | - | - | - |
| 301w | - | - | R+60.6 | 1,034 | - | - |
Matagorda: 26 precincts
| Precinct | 2024 President | 2022 Governor | 2020 President | |||
|---|---|---|---|---|---|---|
| Margin | Votes | Margin | Votes | Margin | Votes | |
| 0002 | R+65.0 | 565 | R+70.0 | 446 | R+62.6 | 554 |
| 0004 | R+77.4 | 955 | R+76.5 | 719 | R+73.4 | 950 |
| 0005 | R+59.2 | 1,400 | R+57.9 | 1,021 | R+52.4 | 1,417 |
| 0006 | R+63.4 | 1,142 | R+67.3 | 829 | R+56.0 | 971 |
| 0007 | R+83.8 | 160 | R+90.6 | 128 | R+92.1 | 151 |
| 0008 | R+63.8 | 536 | R+66.8 | 413 | R+60.7 | 601 |
| 0009 | R+28.6 | 126 | R+33.3 | 93 | R+11.7 | 128 |
| 0010 | R+70.6 | 269 | R+72.2 | 209 | R+68.6 | 271 |
| 0012 | R+70.4 | 179 | R+57.5 | 120 | R+69.8 | 189 |
| 0013 | R+45.2 | 261 | R+42.4 | 203 | R+31.7 | 278 |
| 001A | R+62.1 | 1,671 | - | - | R+56.7 | 1,785 |
| 001B | R+45.4 | 1,898 | - | - | R+41.1 | 2,016 |
| 001C | D+35.0 | 505 | - | - | D+40.9 | 563 |
| 001D | R+28.4 | 613 | - | - | R+19.6 | 700 |
| 001E | R+22.6 | 844 | - | - | R+18.3 | 893 |
| 001F | R+38.8 | 430 | - | - | R+31.1 | 456 |
| 001a | - | - | R+62.5 | 1,276 | - | - |
| 001b | - | - | R+49.1 | 1,398 | - | - |
| 001c | - | - | D+32.5 | 372 | - | - |
| 001d | - | - | R+21.3 | 389 | - | - |
| 001e | - | - | R+23.0 | 553 | - | - |
| 001f | - | - | R+41.3 | 305 | - | - |
| 003A | R+42.0 | 1,173 | - | - | R+35.2 | 1,205 |
| 003B | R+64.1 | 585 | - | - | R+63.4 | 599 |
| 003a | - | - | R+42.0 | 807 | - | - |
| 003b | - | - | R+67.3 | 443 | - | - |
San Patricio: 8 precincts
| Precinct | 2024 President | 2022 Governor | 2020 President | |||
|---|---|---|---|---|---|---|
| Margin | Votes | Margin | Votes | Margin | Votes | |
| 0109 | R+49.8 | 1,819 | R+50.0 | 1,219 | R+46.4 | 1,852 |
| 0113 (part) | R+27.3 | 1,515 | R+20.9 | 898 | D+26.3 | 662 |
| 0114 | R+52.8 | 1,378 | R+51.2 | 968 | R+50.1 | 1,334 |
| 0115 (part) | R+50.9 | 2,956 | R+50.1 | 2,113 | R+48.9 | 2,474 |
| 0116 (part) | R+53.2 | 2,239 | R+54.8 | 1,749 | R+52.4 | 3,064 |
| 0119 | R+36.7 | 806 | R+40.2 | 644 | R+39.3 | 855 |
| 0120 | R+51.4 | 496 | R+55.4 | 399 | R+51.6 | 504 |
| 0121 (part) | R+36.5 | 1,252 | R+35.8 | 868 | R+36.1 | 1,301 |
Colorado: 11 precincts
| Precinct | 2024 President | 2022 Governor | 2020 President | |||
|---|---|---|---|---|---|---|
| Margin | Votes | Margin | Votes | Margin | Votes | |
| 0101 | R+50.6 | 1,479 | R+55.7 | 1,083 | R+45.3 | 1,581 |
| 0102 | R+61.8 | 233 | R+64.3 | 154 | R+59.3 | 216 |
| 0103 | R+80.0 | 436 | R+83.8 | 351 | R+73.4 | 466 |
| 0201 | R+60.2 | 2,353 | R+67.3 | 1,791 | R+57.3 | 2,275 |
| 0202 | R+77.9 | 447 | R+82.2 | 349 | R+72.8 | 437 |
| 0302 | R+74.7 | 992 | R+77.9 | 759 | R+71.9 | 924 |
| 0303 | R+66.7 | 507 | R+72.8 | 405 | R+71.2 | 462 |
| 0304 | R+80.1 | 457 | R+78.4 | 356 | R+71.6 | 419 |
| 0305 | R+59.8 | 1,296 | R+62.5 | 1,017 | R+56.1 | 1,289 |
| 0401 | R+45.9 | 344 | R+49.6 | 250 | R+21.9 | 292 |
| 0402 | R+22.5 | 1,468 | R+26.7 | 1,035 | R+10.2 | 1,614 |
Calhoun: 25 precincts
| Precinct | 2024 President | 2022 Governor | 2020 President | |||
|---|---|---|---|---|---|---|
| Margin | Votes | Margin | Votes | Margin | Votes | |
| 0001 | R+10.4 | 608 | D+8.5 | 386 | D+22.5 | 209 |
| 0002 | R+38.4 | 471 | R+31.9 | 329 | R+8.2 | 414 |
| 0003 | R+56.6 | 410 | R+59.7 | 318 | D+11.5 | 52 |
| 0004 | R+18.4 | 631 | R+11.0 | 383 | R+25.9 | 282 |
| 0005 | R+55.7 | 1,232 | R+59.2 | 914 | R+52.1 | 190 |
| 0006 | R+27.1 | 181 | R+31.2 | 141 | R+61.1 | 365 |
| 0007 | R+45.4 | 1,328 | R+50.2 | 903 | R+8.8 | 331 |
| 0008 | R+73.4 | 448 | R+74.6 | 354 | D+6.9 | 233 |
| 0009 | R+56.4 | 619 | R+56.8 | 428 | R+6.3 | 32 |
| 0010 | R+77.2 | 1,081 | R+73.9 | 788 | R+21.3 | 94 |
| 0011 | R+77.4 | 832 | R+77.8 | 649 | R+38.2 | 280 |
| 0012 | - | - | - | - | R+53.9 | 938 |
| 0013 | - | - | - | - | R+20.0 | 10 |
| 0014 | - | - | - | - | R+18.0 | 100 |
| 0015 | - | - | - | - | R+14.8 | 122 |
| 0016 | - | - | - | - | R+31.4 | 714 |
| 0017 | - | - | - | - | R+37.2 | 473 |
| 0018 | - | - | - | - | R+57.8 | 237 |
| 0019 | - | - | - | - | R+72.4 | 416 |
| 0020 | - | - | - | - | R+10.2 | 49 |
| 0021 | - | - | - | - | R+43.0 | 107 |
| 0022 | - | - | - | - | R+50.5 | 281 |
| 0023 | - | - | - | - | R+70.7 | 167 |
| 0024 | - | - | - | - | R+70.3 | 1,031 |
| 0025 | - | - | - | - | R+75.2 | 741 |
Aransas: 6 precincts
| Precinct | 2024 President | 2022 Governor | 2020 President | |||
|---|---|---|---|---|---|---|
| Margin | Votes | Margin | Votes | Margin | Votes | |
| 0001 (part) | R+65.4 | 1,824 | R+67.0 | 1,318 | R+60.4 | 1,653 |
| 0003 | R+51.2 | 3,755 | R+55.1 | 2,791 | R+47.5 | 3,290 |
| 001A (part) | R+64.5 | 1,054 | - | - | R+60.7 | 1,108 |
| 001a (part) | - | - | R+65.4 | 723 | - | - |
| 004A (part) | R+60.7 | 1,028 | - | - | R+56.0 | 885 |
| 004a (part) | - | - | R+63.7 | 788 | - | - |
Jackson: 9 precincts
| Precinct | 2024 President | 2022 Governor | 2020 President | |||
|---|---|---|---|---|---|---|
| Margin | Votes | Margin | Votes | Margin | Votes | |
| 0001 | R+60.0 | 1,291 | R+66.4 | 923 | R+51.4 | 1,321 |
| 0002 | R+74.6 | 1,479 | R+78.2 | 1,088 | R+74.3 | 1,500 |
| 0003 | R+74.4 | 1,394 | R+76.0 | 1,072 | R+66.8 | 1,466 |
| 0004 | R+73.7 | 247 | R+75.0 | 172 | R+69.9 | 246 |
| 0005 | R+76.1 | 447 | R+81.7 | 323 | R+74.2 | 442 |
| 0006 | R+57.0 | 363 | R+71.2 | 233 | R+55.2 | 397 |
| 0007 | R+74.2 | 93 | R+71.4 | 77 | R+65.3 | 98 |
| 0008 | R+74.2 | 368 | R+80.5 | 251 | R+74.7 | 376 |
| 0009 | R+76.1 | 618 | R+80.2 | 459 | R+71.5 | 505 |
Refugio: 4 precincts
| Precinct | 2024 President | 2022 Governor | 2020 President | |||
|---|---|---|---|---|---|---|
| Margin | Votes | Margin | Votes | Margin | Votes | |
| 004A (part) | R+23.7 | 257 | - | - | R+21.3 | 272 |
| 004B (part) | R+38.3 | 128 | - | - | R+18.3 | 131 |
| 004a (part) | - | - | R+31.2 | 215 | - | - |
| 004b (part) | - | - | R+26.2 | 122 | - | - |
2024 President (Harris vs. Trump). Source: Texas Legislative Council, Capitol Data Portal, Comprehensive Election Datasets (from SOS official canvass). Official canvass returns (Texas Secretary of State), compiled by the Texas Legislative Council and reported by 2024 primary/general election VTDs.
2022 Governor (O'Rourke vs. Abbott). Source: Texas Legislative Council, Capitol Data Portal, Comprehensive Election Datasets (from SOS official canvass). Official canvass returns (Texas Secretary of State), compiled by the Texas Legislative Council and reported by 2022 general election VTDs.
2020 President (Biden vs. Trump). Source: Texas Legislative Council, Capitol Data Portal, Comprehensive Election Datasets (from SOS official canvass). Official canvass returns (Texas Secretary of State), compiled by the Texas Legislative Council and reported by 2020 general election VTDs.
Precinct demographics
Demographics are Census American Community Survey (ACS) 2020-2024 5-year estimates for block groups, assigned to precincts by area share. They describe the resident population, not registered or likely voters, and include non-citizens. ACS margins of error are not shown; small precincts carry large error. Area weighting assumes people are spread evenly within each block group, so large rural precincts are the least reliable. Median income is a household-weighted average of block-group medians, an approximation.
| Area | Population | Voting-age pop. | % White non-Hisp. | % Hispanic | % Black | % Asian | Median income* | % Bachelor's+ | % 18-29 (of adults) | % 65+ | % Homeowners | % Below poverty | % Spanish at home (adults) |
|---|---|---|---|---|---|---|---|---|---|---|---|---|---|
| District | 833,847 | 628,127 | 43.5% | 44.9% | 6.3% | 1.8% | $89k | 28.4% | 19.6% | 15.6% | 71.9% | 12.8% | 27.0% |
| Hays (in district) | 163,546 | 120,455 | 44.8% | 45.7% | 4.1% | 1.8% | $112k | 39.6% | 23.0% | 8.9% | 72.6% | 8.7% | 26.5% |
| Travis (in district) | 105,769 | 79,030 | 36.9% | 45.2% | 7.0% | 6.2% | $123k | 46.2% | 17.4% | 10.1% | 77.0% | 9.6% | 30.6% |
| Bastrop (in district) | 103,981 | 77,098 | 45.1% | 44.3% | 5.7% | 0.8% | $89k | 25.3% | 19.9% | 15.4% | 76.8% | 10.2% | 29.2% |
| Victoria (in district) | 92,031 | 68,936 | 42.3% | 48.2% | 5.5% | 1.2% | $76k | 19.9% | 20.9% | 17.1% | 65.1% | 16.3% | 23.8% |
| Nueces (in district) | 60,173 | 45,968 | 15.7% | 76.7% | 6.0% | 0.3% | $49k | 10.9% | 17.2% | 19.2% | 56.0% | 28.3% | 49.6% |
| Caldwell (in district) | 49,246 | 37,784 | 34.2% | 57.0% | 4.6% | 0.8% | $74k | 19.3% | 21.8% | 15.2% | 75.4% | 13.1% | 35.5% |
| Wharton (in district) | 42,024 | 31,353 | 43.2% | 42.0% | 10.9% | 0.5% | $74k | 20.7% | 20.3% | 18.2% | 72.1% | 13.6% | 24.9% |
| Washington (in district) | 37,470 | 29,556 | 61.4% | 18.5% | 14.2% | 1.4% | $83k | 30.9% | 21.1% | 23.1% | 69.5% | 13.4% | 10.8% |
| Matagorda (in district) | 36,264 | 26,989 | 41.5% | 43.7% | 9.6% | 1.6% | $61k | 22.1% | 18.1% | 18.2% | 68.3% | 20.6% | 25.0% |
| Austin (in district) | 31,417 | 24,054 | 60.4% | 27.7% | 7.9% | 0.8% | $82k | 25.1% | 17.2% | 21.1% | 76.5% | 12.0% | 19.9% |
| Fayette (in district) | 25,298 | 20,187 | 69.4% | 22.1% | 5.7% | 0.3% | $78k | 27.5% | 14.3% | 26.8% | 79.3% | 8.6% | 15.2% |
| Colorado (in district) | 21,008 | 16,103 | 53.2% | 30.6% | 9.7% | 0.7% | $76k | 23.0% | 16.5% | 23.4% | 79.5% | 10.8% | 16.5% |
| Calhoun (in district) | 20,073 | 15,518 | 40.8% | 49.3% | 2.7% | 4.2% | $97k | 20.0% | 18.2% | 19.2% | 77.5% | 7.7% | 24.9% |
| San Patricio (in district) | 19,795 | 14,650 | 50.3% | 43.4% | 1.3% | 1.4% | $82k | 23.9% | 17.7% | 15.3% | 68.2% | 11.0% | 21.2% |
| Jackson (in district) | 15,245 | 11,496 | 56.8% | 33.4% | 6.6% | 1.4% | $74k | 16.6% | 17.2% | 19.7% | 70.8% | 14.1% | 20.2% |
| Aransas (in district) | 10,327 | 8,806 | 71.3% | 21.8% | 2.3% | 2.0% | $82k | 37.2% | 15.1% | 29.5% | 73.4% | 12.6% | 8.3% |
| Refugio (in district) | 177 | 146 | 53.1% | 45.6% | 0.0% | 0.0% | $69k | 16.9% | 12.4% | 33.0% | 89.8% | 6.5% | 37.8% |
Hays: 57 precincts
| Precinct | Population | Voting-age pop. | % White non-Hisp. | % Hispanic | % Black | % Asian | Median income* | % Bachelor's+ | % 18-29 (of adults) | % 65+ | % Homeowners | % Below poverty | % Spanish at home (adults) |
|---|---|---|---|---|---|---|---|---|---|---|---|---|---|
| Precinct 0110 (part) | 811 | 639 | 22.3% | 69.1% | 1.5% | 2.3% | $68k | 27.3% | 33.0% | 10.9% | 54.0% | 14.8% | 47.3% |
| Precinct 0113 (part) | 282 | 250 | 28.2% | 40.9% | 3.1% | 0.5% | $48k | 46.2% | 36.1% | 30.2% | 32.8% | 35.3% | 27.3% |
| Precinct 0120 (part) | 7,461 | 6,390 | 32.5% | 59.1% | 3.7% | 0.8% | $50k | 26.6% | 61.8% | 5.0% | 26.3% | 30.8% | 36.0% |
| Precinct 0121 (part) | 332 | 292 | 46.0% | 42.5% | 4.1% | 1.2% | $50k | 33.1% | 66.1% | 4.0% | 6.8% | 33.2% | 22.9% |
| Precinct 0125 | 3,478 | 2,784 | 20.3% | 67.9% | 7.1% | 0.9% | $113k | 39.2% | 32.0% | 4.7% | 76.6% | 10.9% | 57.1% |
| Precinct 0128 | 4,360 | 3,234 | 30.6% | 60.2% | 3.8% | 1.1% | $109k | 22.8% | 19.1% | 6.4% | 84.6% | 5.2% | 39.8% |
| Precinct 0134 | 4,230 | 3,062 | 19.9% | 69.9% | 8.1% | 0.7% | $84k | 22.9% | 30.5% | 5.9% | 72.4% | 12.0% | 58.6% |
| Precinct 0136 | 7,658 | 4,934 | 11.9% | 77.8% | 5.7% | 1.1% | $87k | 18.6% | 22.1% | 5.1% | 90.6% | 20.3% | 57.3% |
| Precinct 0146 | 77 | 57 | 26.3% | 58.0% | 6.9% | 4.7% | $137k | 24.7% | 10.9% | 13.7% | 83.2% | 4.3% | 42.9% |
| Precinct 0200 | 24 | 19 | 62.0% | 31.6% | 0.8% | 3.7% | $119k | 37.3% | 14.5% | 21.9% | 94.7% | 2.1% | 21.1% |
| Precinct 0203 | 5,649 | 4,074 | 37.7% | 54.6% | 4.9% | 0.8% | $94k | 32.5% | 22.0% | 8.4% | 72.9% | 10.2% | 22.2% |
| Precinct 0204 | 3,916 | 2,732 | 30.8% | 59.7% | 4.6% | 1.3% | $108k | 29.9% | 14.3% | 8.4% | 79.2% | 2.7% | 20.0% |
| Precinct 0205 | 5,620 | 4,264 | 34.8% | 52.3% | 5.3% | 4.1% | $94k | 27.3% | 20.5% | 11.6% | 82.2% | 3.6% | 26.3% |
| Precinct 0206 | 5,333 | 4,104 | 35.0% | 57.7% | 2.7% | 1.8% | $94k | 23.3% | 24.0% | 7.2% | 83.3% | 10.9% | 32.2% |
| Precinct 0216 | 200 | 152 | 47.8% | 41.6% | 3.6% | 1.5% | $116k | 42.6% | 16.8% | 11.9% | 87.4% | 9.2% | 25.2% |
| Precinct 0219 | 635 | 528 | 35.8% | 61.9% | 1.5% | 0.0% | $89k | 25.1% | 21.8% | 10.6% | 71.3% | 1.7% | 35.7% |
| Precinct 0220 | 5,363 | 4,059 | 54.4% | 37.8% | 2.4% | 0.1% | $90k | 35.8% | 27.6% | 11.5% | 61.6% | 8.6% | 19.5% |
| Precinct 0221 | 8,367 | 6,131 | 45.8% | 46.4% | 3.7% | 0.4% | $81k | 36.9% | 36.0% | 5.9% | 41.9% | 14.2% | 24.4% |
| Precinct 0223 | 5,845 | 4,647 | 36.2% | 59.7% | 2.3% | 0.1% | $81k | 23.8% | 19.2% | 9.0% | 68.9% | 8.2% | 34.7% |
| Precinct 0225 | 703 | 560 | 61.5% | 31.9% | 1.0% | 3.5% | $118k | 37.3% | 16.0% | 20.7% | 91.7% | 3.1% | 20.9% |
| Precinct 0227 | 4,208 | 3,199 | 30.1% | 62.5% | 3.2% | 2.2% | $110k | 31.2% | 22.4% | 7.4% | 90.8% | 10.6% | 39.5% |
| Precinct 0228 | 7,639 | 5,726 | 36.3% | 50.3% | 8.0% | 1.6% | $114k | 37.1% | 19.5% | 5.7% | 73.5% | 4.5% | 27.6% |
| Precinct 0231 | 8,491 | 5,678 | 30.5% | 54.9% | 4.2% | 8.7% | $123k | 39.0% | 14.5% | 5.6% | 73.1% | 1.3% | 23.5% |
| Precinct 0252 | 4,439 | 3,438 | 26.3% | 55.2% | 12.1% | 0.8% | $99k | 32.1% | 18.6% | 6.3% | 65.0% | 5.6% | 34.3% |
| Precinct 0253 | 6,953 | 5,197 | 37.4% | 53.5% | 6.8% | 0.4% | $82k | 32.2% | 30.2% | 6.9% | 47.4% | 10.8% | 43.1% |
| Precinct 0254 | 3,031 | 2,376 | 46.2% | 42.4% | 4.4% | 2.0% | $121k | 42.4% | 16.5% | 7.0% | 76.3% | 3.9% | 17.1% |
| Precinct 0319 | 2,617 | 1,797 | 66.8% | 28.3% | 0.0% | 0.0% | $119k | 51.8% | 16.6% | 6.5% | 89.5% | 3.7% | 11.8% |
| Precinct 0320 (part) | 833 | 732 | 87.3% | 10.1% | 0.1% | 1.1% | $131k | 53.3% | 6.3% | 43.0% | 97.7% | 0.5% | 7.7% |
| Precinct 0325 | 123 | 99 | 62.0% | 30.9% | 0.9% | 3.5% | $117k | 36.6% | 14.0% | 22.4% | 94.9% | 2.1% | 20.9% |
| Precinct 0332 (part) | 112 | 99 | 53.6% | 39.0% | 0.7% | 2.9% | $44k | 57.2% | 53.9% | 6.8% | 25.1% | 31.7% | 17.2% |
| Precinct 0342 | 2,665 | 1,999 | 50.7% | 37.7% | 3.9% | 1.6% | $119k | 45.6% | 15.9% | 12.1% | 90.6% | 9.6% | 23.2% |
| Precinct 0347 | 3,352 | 2,916 | 57.8% | 32.6% | 5.6% | 0.7% | $75k | 43.3% | 45.9% | 13.0% | 55.5% | 26.5% | 12.8% |
| Precinct 0351 (part) | 217 | 177 | 33.1% | 52.4% | 7.6% | 1.9% | $44k | 26.8% | 63.5% | 3.5% | 7.6% | 40.4% | 20.4% |
| Precinct 0371 | 381 | 288 | 49.9% | 38.1% | 4.2% | 1.6% | $117k | 45.2% | 17.5% | 12.1% | 89.2% | 10.7% | 23.2% |
| Precinct 0372 | 724 | 436 | 16.1% | 82.2% | 0.1% | 0.0% | $61k | 4.7% | 69.6% | 2.0% | 1.9% | 52.9% | 21.1% |
| Precinct 0373 (part) | 296 | 267 | 88.0% | 9.5% | 0.0% | 1.2% | $128k | 52.2% | 6.4% | 46.0% | 99.9% | 0.0% | 7.5% |
| Precinct 0375 | 2,794 | 2,099 | 50.1% | 38.0% | 4.0% | 1.7% | $119k | 45.5% | 15.3% | 12.3% | 91.1% | 9.5% | 23.6% |
| Precinct 0376 | 357 | 269 | 49.5% | 39.0% | 3.9% | 1.6% | $118k | 44.7% | 15.6% | 12.2% | 90.3% | 9.3% | 24.2% |
| Precinct 0400 | 38 | 30 | 44.0% | 51.5% | 2.3% | 0.6% | $79k | 40.5% | 21.5% | 12.8% | 59.2% | 6.4% | 29.0% |
| Precinct 0422 | 2,114 | 1,736 | 63.1% | 34.7% | 1.7% | 0.0% | $119k | 39.2% | 24.5% | 9.8% | 45.7% | 6.0% | 18.5% |
| Precinct 0423 | 1,827 | 1,471 | 52.4% | 43.9% | 2.1% | 0.2% | $98k | 39.6% | 23.2% | 10.7% | 51.1% | 6.4% | 24.4% |
| Precinct 0424 | 2,952 | 2,232 | 70.0% | 20.0% | 5.0% | 1.2% | $118k | 66.4% | 16.6% | 7.0% | 89.9% | 4.1% | 9.7% |
| Precinct 0425 | 1,271 | 1,011 | 63.7% | 29.8% | 1.2% | 3.4% | $133k | 38.8% | 14.6% | 19.9% | 96.4% | 3.0% | 20.9% |
| Precinct 0426 | 4,687 | 3,619 | 58.3% | 28.3% | 4.9% | 1.3% | $116k | 55.4% | 10.6% | 19.9% | 82.2% | 1.9% | 16.3% |
| Precinct 0430 | 4,936 | 3,653 | 73.3% | 19.3% | 3.4% | 3.3% | $163k | 63.7% | 13.4% | 15.9% | 94.4% | 6.0% | 7.9% |
| Precinct 0432 | 5,618 | 3,749 | 71.1% | 21.6% | 0.6% | 1.6% | $150k | 46.4% | 11.8% | 6.8% | 85.7% | 3.3% | 13.1% |
| Precinct 0435 | 2,044 | 1,344 | 70.2% | 22.2% | 1.2% | 0.6% | $130k | 51.3% | 10.5% | 6.4% | 83.1% | 1.9% | 13.1% |
| Precinct 0436 | 2,225 | 1,552 | 76.9% | 16.4% | 4.0% | 1.7% | $201k | 67.0% | 10.4% | 15.7% | 94.6% | 2.6% | 12.1% |
| Precinct 0438 | 318 | 222 | 73.8% | 17.3% | 5.6% | 2.7% | $204k | 73.7% | 9.5% | 16.4% | 95.1% | 2.3% | 11.1% |
| Precinct 0442 (part) | 2,689 | 1,973 | 82.7% | 11.7% | 3.0% | 1.9% | $168k | 65.3% | 10.3% | 16.0% | 97.1% | 2.1% | 7.4% |
| Precinct 0443 (part) | 3,930 | 2,365 | 72.3% | 14.8% | 1.4% | 4.8% | $186k | 69.9% | 8.2% | 6.1% | 74.2% | 0.7% | 7.3% |
| Precinct 0446 | 7,256 | 4,299 | 61.3% | 29.5% | 1.1% | 3.5% | $232k | 66.9% | 10.3% | 9.2% | 97.5% | 1.5% | 4.7% |
| Precinct 0450 (part) | 183 | 124 | 87.6% | 7.6% | 0.0% | 2.5% | $160k | 61.2% | 7.0% | 22.0% | 86.0% | 1.5% | 5.5% |
| Precinct 0451 (part) | 1,078 | 746 | 88.1% | 7.1% | 0.0% | 2.2% | $210k | 74.4% | 8.7% | 11.1% | 98.8% | 0.0% | 2.3% |
| Precinct 0453 | 772 | 596 | 46.8% | 48.3% | 2.1% | 0.3% | $83k | 41.5% | 20.4% | 11.0% | 59.2% | 6.0% | 27.7% |
| Precinct 0455 | 23 | 19 | 51.7% | 48.3% | 0.0% | 0.0% | $102k | 57.6% | 3.7% | 19.6% | 68.6% | 2.3% | 19.6% |
| Precinct 0456 | 11 | 9 | 51.7% | 48.3% | 0.0% | 0.0% | $102k | 57.6% | 3.7% | 19.6% | 68.5% | 2.2% | 19.6% |
Travis: 28 precincts
| Precinct | Population | Voting-age pop. | % White non-Hisp. | % Hispanic | % Black | % Asian | Median income* | % Bachelor's+ | % 18-29 (of adults) | % 65+ | % Homeowners | % Below poverty | % Spanish at home (adults) |
|---|---|---|---|---|---|---|---|---|---|---|---|---|---|
| Precinct 0127 (part) | 3,229 | 2,364 | 17.2% | 55.7% | 23.5% | 0.9% | $91k | 19.7% | 28.6% | 4.2% | 78.6% | 10.5% | 39.1% |
| Precinct 0143 | 5,150 | 3,852 | 22.5% | 54.8% | 11.4% | 6.1% | $113k | 27.2% | 21.7% | 6.3% | 98.4% | 2.1% | 42.8% |
| Precinct 0144 | 2,091 | 1,300 | 16.5% | 52.1% | 15.4% | 6.8% | $97k | 40.3% | 17.9% | 3.1% | 90.3% | 10.0% | 37.4% |
| Precinct 0145 (part) | 8,585 | 5,329 | 17.9% | 53.6% | 15.1% | 5.7% | $97k | 37.8% | 17.6% | 3.3% | 88.4% | 13.0% | 39.6% |
| Precinct 0335 (part) | 2,624 | 1,905 | 68.1% | 17.9% | 0.8% | 4.5% | $167k | 60.3% | 7.7% | 13.5% | 90.1% | 3.3% | 9.1% |
| Precinct 0336 | 5,894 | 4,566 | 44.7% | 36.2% | 3.3% | 6.0% | $120k | 56.1% | 15.5% | 11.9% | 71.0% | 3.4% | 22.0% |
| Precinct 0337 | 7,071 | 5,969 | 46.1% | 32.2% | 9.0% | 7.2% | $98k | 57.3% | 22.3% | 15.5% | 43.0% | 7.9% | 22.4% |
| Precinct 0343A (part) | 2,288 | 1,680 | 65.0% | 16.2% | 0.8% | 11.4% | $156k | 87.9% | 5.9% | 12.4% | 70.6% | 3.2% | 6.1% |
| Precinct 0343B | 29 | 19 | 68.3% | 15.6% | 0.0% | 12.2% | $250k | 86.4% | 4.4% | 11.5% | 100.0% | 1.6% | 1.8% |
| Precinct 0346 (part) | 4,437 | 2,963 | 59.9% | 17.7% | 2.7% | 17.5% | $240k | 89.5% | 7.0% | 9.0% | 93.8% | 1.3% | 4.6% |
| Precinct 0347 (part) | 1,846 | 1,285 | 72.2% | 9.7% | 6.7% | 8.3% | $232k | 78.5% | 13.5% | 9.2% | 95.1% | 2.5% | 2.4% |
| Precinct 0348A | 4,981 | 3,514 | 63.4% | 12.8% | 1.9% | 15.1% | $237k | 79.7% | 7.8% | 8.3% | 88.9% | 3.9% | 7.5% |
| Precinct 0348B | 86 | 64 | 49.3% | 14.5% | 6.5% | 19.1% | $240k | 72.8% | 5.7% | 14.1% | 94.7% | 11.6% | 9.9% |
| Precinct 0349 | 5,371 | 4,007 | 64.2% | 13.2% | 7.2% | 9.5% | $223k | 68.5% | 6.1% | 18.1% | 94.0% | 7.3% | 7.7% |
| Precinct 0360 | 5,550 | 4,098 | 63.6% | 23.2% | 2.2% | 6.8% | $147k | 67.4% | 9.3% | 16.4% | 87.8% | 15.3% | 9.3% |
| Precinct 0453 (part) | 64 | 54 | 43.9% | 29.5% | 3.6% | 13.6% | $108k | 51.1% | 14.5% | 9.9% | 58.6% | 6.5% | 12.0% |
| Precinct 0456 (part) | 1,971 | 1,726 | 39.6% | 32.1% | 5.6% | 13.8% | $95k | 58.9% | 27.4% | 15.9% | 30.0% | 5.8% | 23.7% |
| Precinct 0465 (part) | 446 | 373 | 31.2% | 46.1% | 14.1% | 4.3% | $80k | 51.8% | 41.0% | 3.8% | 15.1% | 5.7% | 32.0% |
| Precinct 0470 (part) | 93 | 80 | 34.7% | 42.0% | 8.8% | 8.5% | $77k | 62.0% | 36.7% | 9.4% | 34.1% | 11.8% | 28.1% |
| Precinct 0472 | 7,152 | 6,236 | 43.3% | 43.1% | 3.2% | 7.6% | $90k | 44.7% | 23.3% | 16.4% | 52.9% | 21.1% | 29.7% |
| Precinct 0474 (part) | 2,893 | 2,239 | 34.5% | 56.2% | 0.8% | 6.7% | $135k | 47.1% | 16.9% | 7.8% | 75.9% | 14.6% | 31.9% |
| Precinct 0475 | 2,238 | 1,741 | 29.9% | 66.2% | 1.3% | 0.1% | $68k | 20.1% | 16.5% | 14.8% | 91.2% | 11.1% | 41.4% |
| Precinct 0481 (part) | 5,439 | 3,969 | 24.8% | 54.4% | 12.7% | 1.0% | $85k | 25.8% | 22.3% | 9.4% | 88.5% | 6.9% | 39.2% |
| Precinct 0482 (part) | 4,688 | 3,979 | 19.2% | 65.4% | 11.3% | 1.2% | $81k | 16.9% | 22.7% | 8.2% | 82.3% | 19.7% | 46.0% |
| Precinct 0483 | 10,524 | 7,458 | 12.2% | 77.4% | 5.3% | 4.1% | $84k | 23.7% | 18.3% | 8.0% | 79.9% | 12.2% | 51.8% |
| Precinct 0490 | 8,339 | 6,146 | 23.0% | 71.2% | 3.3% | 1.0% | $97k | 24.8% | 19.2% | 7.4% | 88.5% | 9.3% | 55.5% |
| Precinct 0491A (part) | 2,681 | 2,111 | 34.1% | 51.1% | 8.1% | 3.8% | $102k | 37.0% | 19.5% | 5.5% | 76.2% | 11.8% | 34.9% |
| Precinct 0491B | 5 | 4 | 37.6% | 45.9% | 8.9% | 4.4% | $102k | 39.1% | 19.4% | 5.8% | 77.3% | 10.2% | 30.6% |
Bastrop: 26 precincts
| Precinct | Population | Voting-age pop. | % White non-Hisp. | % Hispanic | % Black | % Asian | Median income* | % Bachelor's+ | % 18-29 (of adults) | % 65+ | % Homeowners | % Below poverty | % Spanish at home (adults) |
|---|---|---|---|---|---|---|---|---|---|---|---|---|---|
| Precinct 1001 | 416 | 357 | 61.4% | 32.4% | 1.3% | 0.0% | $91k | 41.2% | 13.3% | 23.5% | 71.4% | 10.2% | 10.9% |
| Precinct 1002 | 958 | 757 | 65.2% | 31.6% | 0.7% | 0.0% | $111k | 42.6% | 10.9% | 18.5% | 75.5% | 9.0% | 13.1% |
| Precinct 1003 | 3,986 | 3,117 | 51.0% | 39.7% | 1.7% | 0.6% | $100k | 34.9% | 19.1% | 14.4% | 78.9% | 8.4% | 23.7% |
| Precinct 1004 | 2,214 | 1,865 | 59.6% | 25.6% | 6.8% | 5.4% | $74k | 38.7% | 18.5% | 23.5% | 70.4% | 5.4% | 10.6% |
| Precinct 1005 | 1,133 | 840 | 72.2% | 21.4% | 2.0% | 1.8% | $63k | 32.9% | 11.5% | 26.7% | 64.3% | 10.2% | 18.0% |
| Precinct 1006 | 7,030 | 5,321 | 32.0% | 57.4% | 7.0% | 0.3% | $70k | 13.6% | 27.7% | 11.7% | 73.4% | 15.6% | 40.2% |
| Precinct 1007 | 3,346 | 2,516 | 70.2% | 25.7% | 1.1% | 0.7% | $113k | 44.9% | 14.0% | 21.9% | 83.6% | 6.8% | 19.0% |
| Precinct 1008 | 2,854 | 2,406 | 58.6% | 31.1% | 0.4% | 5.8% | $161k | 52.1% | 16.6% | 18.3% | 83.6% | 16.8% | 12.0% |
| Precinct 1009 | 5,182 | 3,616 | 35.1% | 61.9% | 0.2% | 0.0% | $98k | 18.1% | 19.7% | 11.2% | 78.5% | 4.0% | 49.6% |
| Precinct 2010 | 1,246 | 942 | 42.4% | 44.8% | 2.7% | 0.8% | $82k | 26.7% | 24.8% | 10.8% | 36.7% | 16.5% | 23.8% |
| Precinct 2011 | 2,169 | 1,744 | 61.4% | 19.6% | 10.2% | 4.1% | $100k | 34.1% | 22.0% | 5.6% | 59.8% | 6.0% | 16.8% |
| Precinct 2012 | 3,869 | 2,806 | 53.2% | 35.6% | 3.7% | 0.4% | $101k | 29.4% | 16.4% | 18.1% | 77.8% | 6.3% | 26.9% |
| Precinct 2013 | 4,087 | 3,344 | 64.8% | 28.9% | 0.7% | 0.6% | $89k | 23.8% | 17.8% | 14.5% | 75.4% | 12.0% | 14.4% |
| Precinct 2014 | 5,434 | 4,166 | 64.8% | 26.8% | 2.6% | 0.9% | $83k | 29.6% | 17.2% | 16.7% | 91.6% | 6.6% | 11.8% |
| Precinct 2015 | 3,956 | 3,331 | 64.5% | 15.0% | 11.7% | 1.6% | $72k | 21.0% | 15.4% | 23.8% | 57.3% | 13.0% | 13.1% |
| Precinct 2016 | 4,092 | 3,082 | 67.5% | 24.7% | 2.3% | 0.0% | $84k | 20.8% | 14.0% | 21.4% | 77.8% | 15.5% | 10.7% |
| Precinct 3017 | 5,562 | 4,461 | 56.9% | 38.3% | 2.9% | 0.0% | $117k | 30.5% | 23.8% | 14.3% | 67.5% | 6.7% | 20.3% |
| Precinct 3018 | 3,789 | 2,881 | 56.2% | 31.7% | 8.4% | 0.0% | $64k | 17.0% | 10.2% | 27.3% | 91.2% | 10.8% | 25.8% |
| Precinct 3019 | 8,585 | 5,348 | 19.4% | 71.2% | 7.2% | 0.0% | $73k | 14.0% | 20.0% | 10.3% | 81.5% | 20.2% | 57.6% |
| Precinct 3020 | 8,639 | 5,774 | 13.8% | 82.3% | 1.9% | 0.0% | $62k | 8.7% | 19.7% | 12.8% | 84.2% | 13.3% | 64.6% |
| Precinct 4021 | 8,859 | 6,068 | 45.7% | 39.7% | 6.1% | 1.1% | $88k | 29.0% | 20.2% | 13.3% | 77.7% | 6.2% | 21.9% |
| Precinct 4022 | 5,154 | 3,918 | 35.7% | 46.9% | 13.2% | 0.1% | $100k | 32.6% | 16.3% | 18.0% | 84.5% | 6.6% | 33.7% |
| Precinct 4023 | 3,106 | 2,551 | 49.8% | 33.5% | 11.6% | 1.9% | $84k | 20.8% | 40.9% | 14.6% | 94.6% | 10.9% | 14.9% |
| Precinct 4024 (part) | 2,921 | 2,088 | 29.7% | 59.7% | 7.9% | 0.7% | $88k | 20.5% | 24.3% | 14.7% | 67.1% | 9.6% | 38.8% |
| Precinct 4025 | 1,795 | 1,467 | 23.6% | 52.9% | 20.7% | 0.1% | $112k | 29.5% | 17.9% | 21.0% | 71.9% | 6.4% | 37.0% |
| Precinct 4026 | 3,599 | 2,331 | 41.5% | 40.4% | 13.9% | 0.4% | $75k | 19.6% | 27.4% | 6.9% | 67.0% | 2.0% | 30.8% |
Victoria: 35 precincts
| Precinct | Population | Voting-age pop. | % White non-Hisp. | % Hispanic | % Black | % Asian | Median income* | % Bachelor's+ | % 18-29 (of adults) | % 65+ | % Homeowners | % Below poverty | % Spanish at home (adults) |
|---|---|---|---|---|---|---|---|---|---|---|---|---|---|
| Precinct 0001 | 681 | 502 | 16.5% | 66.6% | 12.0% | 1.9% | $36k | 10.5% | 25.8% | 18.5% | 63.0% | 35.5% | 42.6% |
| Precinct 0002 | 1,421 | 1,126 | 29.4% | 56.5% | 4.6% | 1.8% | $65k | 19.1% | 21.2% | 13.9% | 60.4% | 21.9% | 30.9% |
| Precinct 0003 | 1,729 | 1,399 | 41.1% | 51.9% | 3.5% | 0.0% | $73k | 29.9% | 16.6% | 22.3% | 58.7% | 14.1% | 28.0% |
| Precinct 0004 | 3,144 | 2,332 | 7.2% | 78.8% | 12.2% | 0.0% | $40k | 4.2% | 21.9% | 12.2% | 57.9% | 37.7% | 49.1% |
| Precinct 0005 | 5,252 | 3,793 | 19.8% | 67.5% | 10.8% | 0.7% | $40k | 11.4% | 18.5% | 16.5% | 45.4% | 40.4% | 47.3% |
| Precinct 0006 | 302 | 217 | 3.2% | 77.5% | 18.3% | 1.0% | $53k | 1.1% | 28.6% | 15.2% | 54.7% | 20.6% | 29.6% |
| Precinct 0007 | 3,186 | 2,399 | 18.2% | 75.1% | 6.1% | 0.1% | $72k | 16.7% | 17.8% | 18.6% | 63.0% | 9.3% | 40.4% |
| Precinct 0008 | 6,214 | 4,210 | 23.4% | 68.8% | 5.8% | 0.0% | $61k | 10.0% | 34.7% | 9.3% | 42.1% | 16.8% | 28.3% |
| Precinct 0009 | 1,770 | 1,405 | 40.2% | 43.7% | 10.6% | 1.2% | $59k | 13.3% | 29.0% | 11.6% | 37.8% | 10.2% | 16.1% |
| Precinct 0010 | 2,136 | 1,571 | 48.7% | 37.9% | 5.0% | 3.1% | $83k | 21.7% | 12.4% | 15.2% | 56.1% | 14.1% | 19.9% |
| Precinct 0011 | 2,638 | 2,054 | 64.3% | 28.9% | 1.0% | 1.1% | $80k | 26.7% | 22.9% | 21.8% | 49.5% | 4.0% | 11.6% |
| Precinct 0012 | 1,122 | 803 | 35.5% | 47.9% | 10.8% | 0.0% | $85k | 10.4% | 13.7% | 9.1% | 90.4% | 10.3% | 23.0% |
| Precinct 0013 | 2,134 | 1,489 | 10.2% | 82.5% | 7.3% | 0.0% | $70k | 3.7% | 30.3% | 11.0% | 76.2% | 23.9% | 65.7% |
| Precinct 0014 | 3,542 | 2,654 | 42.0% | 48.4% | 8.9% | 0.7% | $70k | 16.1% | 20.8% | 12.6% | 80.8% | 23.7% | 25.6% |
| Precinct 0015 | 1,324 | 952 | 58.0% | 35.3% | 4.7% | 0.0% | $63k | 10.3% | 16.1% | 19.0% | 78.6% | 24.3% | 21.0% |
| Precinct 0016 | 1,191 | 848 | 57.1% | 35.9% | 4.9% | 0.0% | $63k | 11.0% | 16.2% | 19.0% | 78.1% | 26.9% | 20.1% |
| Precinct 0017 | 703 | 504 | 55.8% | 38.5% | 0.2% | 0.0% | $29k | 13.2% | 9.0% | 20.3% | 40.6% | 25.2% | 21.9% |
| Precinct 0018 | 4,574 | 3,469 | 53.7% | 39.3% | 4.0% | 0.2% | $91k | 14.7% | 16.1% | 22.6% | 81.2% | 8.2% | 16.2% |
| Precinct 0019 | 4,704 | 3,567 | 29.9% | 55.4% | 7.5% | 4.5% | $81k | 20.9% | 21.1% | 13.4% | 65.3% | 17.0% | 20.9% |
| Precinct 0020 | 1,929 | 1,561 | 59.0% | 37.2% | 1.7% | 0.6% | $113k | 26.3% | 16.3% | 27.4% | 90.4% | 5.4% | 6.1% |
| Precinct 0021 | 5,439 | 4,140 | 60.5% | 27.8% | 3.9% | 2.7% | $107k | 34.8% | 16.5% | 14.7% | 85.1% | 6.9% | 6.7% |
| Precinct 0022 | 1,951 | 1,578 | 78.3% | 13.3% | 0.0% | 1.1% | $108k | 18.2% | 16.5% | 27.5% | 86.5% | 7.5% | 4.6% |
| Precinct 0023 | 2,710 | 2,219 | 75.4% | 18.8% | 3.9% | 0.0% | $90k | 24.5% | 13.7% | 29.2% | 93.1% | 5.1% | 11.7% |
| Precinct 0024 | 3,262 | 2,544 | 64.0% | 31.1% | 0.5% | 0.1% | $110k | 26.1% | 16.2% | 19.7% | 95.7% | 1.9% | 11.9% |
| Precinct 0025 | 6,532 | 5,008 | 46.4% | 45.4% | 3.4% | 1.3% | $65k | 17.7% | 30.5% | 14.6% | 47.9% | 15.1% | 15.4% |
| Precinct 0026 | 539 | 417 | 53.9% | 32.2% | 8.7% | 1.7% | $61k | 28.9% | 11.3% | 17.3% | 83.7% | 6.4% | 26.5% |
| Precinct 0027 | 1,342 | 1,002 | 85.0% | 10.2% | 0.7% | 1.1% | $86k | 31.1% | 11.0% | 21.0% | 86.5% | 5.7% | 5.1% |
| Precinct 0028 | 1,481 | 1,066 | 51.2% | 40.7% | 7.0% | 0.0% | $97k | 21.2% | 18.8% | 10.4% | 84.7% | 15.4% | 24.8% |
| Precinct 0029 | 3,342 | 2,656 | 48.7% | 43.7% | 2.5% | 3.2% | $110k | 38.2% | 18.4% | 19.2% | 92.5% | 3.3% | 18.8% |
| Precinct 0030 | 885 | 777 | 27.8% | 61.6% | 8.4% | 0.0% | $67k | 26.2% | 31.2% | 10.9% | 72.5% | 4.0% | 36.6% |
| Precinct 0031 | 2,711 | 2,128 | 37.1% | 46.0% | 11.7% | 0.4% | $61k | 13.7% | 36.8% | 18.7% | 25.9% | 12.0% | 35.2% |
| Precinct 0032 | 3,389 | 2,374 | 39.0% | 58.2% | 2.3% | 0.0% | $63k | 13.5% | 13.5% | 18.9% | 53.0% | 35.4% | 25.9% |
| Precinct 0033 | 6,309 | 4,548 | 53.5% | 36.7% | 2.8% | 3.8% | $79k | 34.2% | 16.7% | 22.1% | 61.2% | 8.8% | 18.1% |
| Precinct 0034 | 2,049 | 1,334 | 10.0% | 79.5% | 10.2% | 0.3% | $28k | 4.3% | 24.5% | 13.7% | 68.8% | 46.1% | 43.6% |
| Precinct 0035 | 398 | 291 | 17.9% | 67.5% | 7.5% | 2.9% | $51k | 16.2% | 26.8% | 13.7% | 63.0% | 33.1% | 42.6% |
Nueces: 36 precincts
| Precinct | Population | Voting-age pop. | % White non-Hisp. | % Hispanic | % Black | % Asian | Median income* | % Bachelor's+ | % 18-29 (of adults) | % 65+ | % Homeowners | % Below poverty | % Spanish at home (adults) |
|---|---|---|---|---|---|---|---|---|---|---|---|---|---|
| Precinct 0001 | 2,215 | 2,064 | 39.4% | 49.6% | 7.4% | 1.0% | $41k | 25.3% | 20.9% | 18.8% | 12.8% | 17.9% | 31.6% |
| Precinct 0007 | 967 | 765 | 9.1% | 77.2% | 12.3% | 1.4% | $45k | 11.9% | 13.3% | 14.9% | 61.9% | 13.1% | 59.0% |
| Precinct 0019 | 4,634 | 3,872 | 82.4% | 9.6% | 0.9% | 0.2% | $83k | 38.0% | 7.7% | 32.1% | 67.3% | 11.5% | 5.8% |
| Precinct 0021 | 25 | 21 | 63.2% | 17.0% | 12.5% | 0.0% | $56k | 45.2% | 9.0% | 20.7% | 74.0% | 30.9% | 13.3% |
| Precinct 0030 | 216 | 196 | 31.6% | 50.4% | 17.1% | 0.0% | $14k | 4.7% | 3.9% | 33.0% | 21.8% | 58.6% | 33.5% |
| Precinct 0031 | 864 | 546 | 12.0% | 62.1% | 23.7% | 0.8% | $27k | 6.7% | 11.3% | 16.5% | 46.1% | 49.5% | 59.5% |
| Precinct 0033 | 2,699 | 2,250 | 24.7% | 58.8% | 13.9% | 0.6% | $34k | 8.9% | 15.5% | 18.2% | 22.2% | 46.4% | 38.9% |
| Precinct 0038 | 510 | 384 | 15.2% | 56.7% | 25.2% | 0.0% | $28k | 6.5% | 9.9% | 10.8% | 41.3% | 54.7% | 30.2% |
| Precinct 0039 (part) | 59 | 53 | 31.3% | 61.4% | 2.0% | 2.5% | $51k | 22.8% | 3.4% | 39.6% | 40.0% | 14.0% | 37.3% |
| Precinct 0041 | 983 | 697 | 8.9% | 82.1% | 8.9% | 0.1% | $40k | 11.4% | 39.1% | 6.9% | 30.1% | 76.2% | 42.8% |
| Precinct 0043 | 2,292 | 1,393 | 12.6% | 86.0% | 1.0% | 0.0% | $10k | 2.7% | 12.7% | 11.4% | 39.9% | 49.8% | 59.4% |
| Precinct 0044 | 1,618 | 1,237 | 6.2% | 89.1% | 4.1% | 0.0% | $46k | 2.5% | 21.6% | 12.5% | 65.4% | 25.3% | 57.0% |
| Precinct 0045 | 1,279 | 928 | 7.8% | 89.1% | 2.9% | 0.2% | $32k | 4.2% | 27.9% | 13.1% | 37.3% | 36.0% | 65.1% |
| Precinct 0046 | 1,102 | 787 | 3.7% | 94.9% | 1.2% | 0.3% | $33k | 6.9% | 24.8% | 10.5% | 44.3% | 43.1% | 60.0% |
| Precinct 0047 | 616 | 408 | 8.0% | 80.6% | 11.3% | 0.0% | $27k | 3.3% | 24.8% | 12.8% | 17.4% | 51.9% | 43.9% |
| Precinct 0052 | 1,364 | 956 | 5.4% | 93.3% | 0.3% | 0.1% | $46k | 5.6% | 13.9% | 17.6% | 67.9% | 8.1% | 46.8% |
| Precinct 0056 | 3,037 | 1,629 | 8.8% | 89.9% | 0.6% | 0.0% | $14k | 2.3% | 25.7% | 7.8% | 25.8% | 64.0% | 54.5% |
| Precinct 0060 | 1,825 | 1,546 | 4.5% | 94.4% | 1.1% | 0.0% | $47k | 1.4% | 20.1% | 13.3% | 54.4% | 34.9% | 61.2% |
| Precinct 0061 | 1,866 | 1,147 | 1.8% | 89.3% | 8.9% | 0.0% | $42k | 8.7% | 14.7% | 16.5% | 61.5% | 23.9% | 52.1% |
| Precinct 0062 (part) | 614 | 536 | 6.1% | 90.7% | 2.5% | 0.5% | $51k | 9.4% | 26.1% | 21.9% | 52.2% | 17.0% | 67.0% |
| Precinct 0071 | 2,588 | 1,968 | 7.9% | 89.4% | 1.1% | 0.0% | $57k | 6.4% | 15.0% | 35.8% | 68.6% | 31.2% | 71.1% |
| Precinct 0073 | 2,767 | 2,067 | 9.0% | 89.0% | 0.9% | 0.5% | $66k | 4.9% | 23.8% | 22.4% | 76.1% | 24.7% | 60.9% |
| Precinct 0074 | 2,694 | 2,057 | 2.6% | 95.3% | 1.7% | 0.0% | $37k | 9.1% | 12.6% | 17.8% | 58.9% | 30.8% | 61.1% |
| Precinct 0075 | 3,484 | 2,644 | 2.9% | 93.9% | 0.1% | 0.0% | $45k | 8.4% | 17.4% | 21.4% | 66.8% | 26.6% | 56.3% |
| Precinct 0076 | 1,202 | 997 | 6.0% | 92.2% | 1.8% | 0.0% | $37k | 1.2% | 19.7% | 17.5% | 46.3% | 21.6% | 45.7% |
| Precinct 0077 | 804 | 592 | 3.2% | 87.5% | 9.3% | 0.0% | $43k | 2.9% | 12.3% | 17.4% | 70.0% | 32.1% | 57.3% |
| Precinct 0078 | 1,845 | 1,524 | 3.2% | 80.3% | 16.1% | 0.0% | $54k | 3.9% | 20.8% | 22.2% | 75.7% | 18.2% | 50.0% |
| Precinct 0079 | 1,568 | 1,236 | 11.8% | 75.5% | 12.4% | 0.0% | $42k | 7.3% | 11.9% | 23.9% | 43.5% | 25.3% | 56.7% |
| Precinct 0080 | 2,074 | 1,700 | 4.5% | 80.3% | 14.6% | 0.0% | $49k | 2.9% | 16.2% | 23.0% | 67.2% | 23.8% | 62.4% |
| Precinct 0083 | 1,638 | 1,333 | 3.0% | 96.4% | 0.4% | 0.0% | $44k | 6.1% | 17.0% | 18.6% | 64.1% | 30.6% | 52.1% |
| Precinct 0085 | 687 | 599 | 1.8% | 94.4% | 3.5% | 0.3% | $39k | 4.7% | 19.1% | 21.5% | 45.4% | 30.0% | 69.7% |
| Precinct 0097 | 2,068 | 1,715 | 5.1% | 92.3% | 0.7% | 0.6% | $53k | 8.2% | 9.9% | 31.4% | 81.1% | 18.7% | 65.7% |
| Precinct 0098 | 2,601 | 2,045 | 5.7% | 68.3% | 25.5% | 0.0% | $56k | 13.9% | 17.0% | 17.1% | 57.6% | 10.9% | 49.8% |
| Precinct 0099 (part) | 1,137 | 876 | 5.1% | 91.7% | 2.2% | 0.7% | $48k | 7.1% | 17.9% | 15.6% | 70.9% | 8.8% | 58.5% |
| Precinct 0103 (part) | 3,337 | 2,587 | 28.8% | 62.8% | 6.2% | 1.0% | $78k | 23.2% | 20.2% | 13.9% | 79.2% | 10.4% | 39.8% |
| Precinct 0113 | 893 | 611 | 15.2% | 73.6% | 11.2% | 0.0% | $39k | 1.6% | 21.5% | 12.8% | 36.0% | 36.7% | 39.6% |
Caldwell: 37 precincts
| Precinct | Population | Voting-age pop. | % White non-Hisp. | % Hispanic | % Black | % Asian | Median income* | % Bachelor's+ | % 18-29 (of adults) | % 65+ | % Homeowners | % Below poverty | % Spanish at home (adults) |
|---|---|---|---|---|---|---|---|---|---|---|---|---|---|
| 000100 | 494 | 434 | 49.1% | 49.1% | 0.2% | 0.1% | $77k | 35.5% | 34.4% | 14.4% | 72.1% | 25.5% | 16.3% |
| 000101 | 1,530 | 1,146 | 41.4% | 53.8% | 2.3% | 1.2% | $91k | 30.0% | 21.9% | 18.7% | 80.5% | 5.2% | 29.8% |
| 000102 | 3,198 | 2,836 | 58.8% | 28.1% | 8.5% | 0.9% | $66k | 19.0% | 18.6% | 20.8% | 74.3% | 6.3% | 21.5% |
| 000103 | 3,255 | 2,397 | 48.9% | 48.5% | 0.2% | 0.7% | $84k | 48.7% | 15.3% | 22.7% | 81.4% | 15.8% | 23.3% |
| 000104 | 792 | 667 | 62.3% | 32.3% | 1.4% | 0.5% | $77k | 32.2% | 15.3% | 22.7% | 88.7% | 5.0% | 22.9% |
| 000105 | 133 | 119 | 49.8% | 48.6% | 0.0% | 0.0% | $75k | 35.9% | 35.3% | 14.0% | 70.8% | 27.5% | 15.2% |
| 000107 | 7 | 7 | 48.4% | 49.8% | 0.1% | 0.0% | $75k | 34.9% | 35.0% | 13.7% | 71.5% | 26.6% | 15.9% |
| 000108 | 743 | 549 | 18.4% | 80.2% | 1.1% | 0.0% | $71k | 10.3% | 26.6% | 4.0% | 72.0% | 3.1% | 35.8% |
| 000109 | 116 | 108 | 56.7% | 23.6% | 14.7% | 1.5% | $36k | 9.8% | 20.7% | 19.0% | 39.7% | 10.0% | 19.8% |
| 000110 | 529 | 464 | 50.8% | 24.5% | 20.4% | 1.2% | $36k | 10.9% | 22.2% | 17.6% | 38.5% | 22.1% | 19.3% |
| 000111 | 1,400 | 1,154 | 52.7% | 40.1% | 1.4% | 0.0% | $69k | 13.6% | 18.3% | 18.7% | 76.6% | 8.9% | 23.2% |
| 000112 | 35 | 25 | 49.5% | 48.0% | 0.0% | 0.7% | $84k | 50.5% | 13.8% | 23.4% | 82.2% | 16.0% | 23.2% |
| 000113 | 53 | 39 | 50.3% | 47.2% | 0.1% | 0.7% | $84k | 50.4% | 13.7% | 23.5% | 82.9% | 15.6% | 23.1% |
| 000114 | 8 | 6 | 49.6% | 48.0% | 0.0% | 0.7% | $84k | 50.5% | 13.7% | 23.5% | 82.2% | 16.0% | 23.2% |
| 000115 | 220 | 181 | 31.2% | 61.5% | 2.9% | 0.2% | $78k | 21.3% | 25.4% | 17.2% | 65.1% | 6.6% | 26.6% |
| 000118 | 1,216 | 888 | 19.7% | 77.3% | 0.8% | 1.3% | $79k | 12.1% | 25.9% | 5.1% | 77.5% | 3.5% | 46.2% |
| 000201 | 1,461 | 1,169 | 38.9% | 59.3% | 0.3% | 0.2% | $65k | 20.2% | 12.0% | 23.7% | 78.6% | 5.3% | 40.7% |
| 000202 | 1,983 | 1,735 | 40.5% | 45.9% | 12.1% | 0.0% | $71k | 15.4% | 8.9% | 40.9% | 58.2% | 18.2% | 27.3% |
| 000203 | 2,560 | 1,811 | 33.9% | 50.0% | 11.4% | 0.0% | $74k | 11.9% | 20.0% | 14.6% | 73.4% | 11.4% | 26.7% |
| 000204 | 1,792 | 1,448 | 50.7% | 39.0% | 2.9% | 0.0% | $69k | 22.8% | 25.5% | 25.3% | 97.1% | 10.6% | 33.4% |
| 000205 | 990 | 727 | 70.0% | 11.2% | 0.7% | 0.0% | $68k | 25.8% | 15.2% | 20.6% | 95.6% | 7.0% | 12.0% |
| 000206 | 2,449 | 1,963 | 31.2% | 58.5% | 8.3% | 0.4% | $69k | 11.9% | 21.5% | 16.6% | 74.8% | 11.1% | 39.0% |
| 000301 | 3,209 | 2,591 | 30.9% | 54.8% | 10.8% | 1.3% | $65k | 24.5% | 37.0% | 10.4% | 50.6% | 36.5% | 29.1% |
| 000302 | 3,804 | 2,831 | 20.1% | 71.3% | 1.7% | 4.1% | $89k | 21.5% | 22.1% | 7.0% | 78.6% | 16.2% | 49.0% |
| 000303 | 2,210 | 1,565 | 20.7% | 74.6% | 0.7% | 2.6% | $89k | 13.8% | 25.2% | 6.3% | 86.0% | 4.3% | 61.0% |
| 000305 | 1,131 | 951 | 48.1% | 45.5% | 4.6% | 0.1% | $85k | 24.1% | 21.1% | 16.0% | 96.6% | 12.2% | 26.9% |
| 000306 | 866 | 724 | 25.3% | 73.0% | 0.5% | 0.2% | $64k | 18.3% | 21.5% | 11.0% | 86.8% | 7.4% | 56.0% |
| 000307 | 1 | 1 | 18.7% | 77.6% | 0.0% | 1.9% | $86k | 11.9% | 25.0% | 5.6% | 82.8% | 5.6% | 59.7% |
| 000400 | 23 | 19 | 30.9% | 61.7% | 3.0% | 0.3% | $78k | 20.9% | 25.6% | 17.2% | 64.7% | 6.5% | 26.6% |
| 000401 | 1,081 | 805 | 24.6% | 41.1% | 29.6% | 0.1% | $32k | 15.2% | 24.0% | 12.2% | 47.1% | 34.6% | 23.9% |
| 000402 | 2,639 | 2,123 | 30.3% | 63.1% | 2.9% | 0.2% | $71k | 18.0% | 23.8% | 14.9% | 58.2% | 8.3% | 27.8% |
| 000404 | 5,167 | 3,338 | 10.5% | 86.1% | 0.7% | 0.0% | $78k | 10.1% | 24.8% | 6.7% | 86.7% | 14.7% | 66.3% |
| 000405 | 3,378 | 2,352 | 28.7% | 63.4% | 1.2% | 0.0% | $89k | 8.4% | 21.6% | 13.1% | 79.7% | 8.4% | 37.3% |
| 000407 | 24 | 18 | 48.7% | 46.7% | 4.6% | 0.0% | $49k | 5.0% | 11.7% | 15.3% | 9.2% | 26.8% | 21.9% |
| 000408 | 22 | 17 | 49.2% | 46.6% | 4.0% | 0.0% | $52k | 8.4% | 15.0% | 15.3% | 14.8% | 27.1% | 20.8% |
| 000409 | 562 | 450 | 17.6% | 71.8% | 3.3% | 0.0% | $48k | 10.5% | 17.2% | 9.1% | 78.9% | 9.5% | 35.8% |
| 000412 | 166 | 129 | 44.6% | 50.4% | 3.7% | 0.1% | $56k | 12.2% | 17.8% | 15.9% | 23.1% | 21.9% | 22.4% |
Wharton: 12 precincts
| Precinct | Population | Voting-age pop. | % White non-Hisp. | % Hispanic | % Black | % Asian | Median income* | % Bachelor's+ | % 18-29 (of adults) | % 65+ | % Homeowners | % Below poverty | % Spanish at home (adults) |
|---|---|---|---|---|---|---|---|---|---|---|---|---|---|
| Precinct 0101 | 1,436 | 1,088 | 34.4% | 31.2% | 28.0% | 1.8% | $62k | 15.3% | 17.1% | 20.9% | 70.5% | 5.5% | 20.7% |
| Precinct 0102 | 4,218 | 3,288 | 37.6% | 43.4% | 10.9% | 1.0% | $66k | 23.6% | 22.8% | 18.5% | 63.7% | 9.2% | 30.1% |
| Precinct 0103 | 5,326 | 3,705 | 43.7% | 41.6% | 8.0% | 0.0% | $72k | 20.2% | 15.0% | 17.4% | 81.9% | 11.7% | 26.0% |
| Precinct 0201 | 3,391 | 2,535 | 57.8% | 35.3% | 4.1% | 0.0% | $87k | 28.0% | 17.1% | 15.7% | 87.8% | 5.9% | 19.0% |
| Precinct 0202 | 640 | 593 | 39.6% | 11.1% | 44.4% | 0.0% | $79k | 29.2% | 8.2% | 19.9% | 99.9% | 7.0% | 4.7% |
| Precinct 0203 | 5,045 | 3,935 | 34.0% | 36.9% | 23.9% | 0.9% | $61k | 21.6% | 22.5% | 18.8% | 60.9% | 14.7% | 23.0% |
| Precinct 0301 | 3,649 | 2,685 | 78.1% | 17.4% | 3.0% | 0.0% | $110k | 28.7% | 13.9% | 20.3% | 80.4% | 4.7% | 12.7% |
| Precinct 0302 | 2,387 | 1,855 | 53.7% | 31.6% | 12.3% | 0.0% | $72k | 18.4% | 18.3% | 21.9% | 67.3% | 19.1% | 14.7% |
| Precinct 0303 | 3,858 | 2,985 | 57.0% | 36.5% | 3.6% | 0.3% | $80k | 19.1% | 23.8% | 23.4% | 75.8% | 16.4% | 24.8% |
| Precinct 0401 | 4,808 | 3,542 | 25.0% | 64.5% | 9.6% | 0.4% | $62k | 10.1% | 27.3% | 15.9% | 70.5% | 24.5% | 36.1% |
| Precinct 0402 | 2,920 | 1,918 | 38.5% | 56.2% | 4.2% | 0.0% | $97k | 19.0% | 26.1% | 12.2% | 63.2% | 22.3% | 28.5% |
| Precinct 0403 | 4,346 | 3,224 | 27.1% | 57.5% | 12.6% | 1.5% | $61k | 19.1% | 18.7% | 16.7% | 64.6% | 12.2% | 32.1% |
Washington: 21 precincts
| Precinct | Population | Voting-age pop. | % White non-Hisp. | % Hispanic | % Black | % Asian | Median income* | % Bachelor's+ | % 18-29 (of adults) | % 65+ | % Homeowners | % Below poverty | % Spanish at home (adults) |
|---|---|---|---|---|---|---|---|---|---|---|---|---|---|
| 000101 | 2,562 | 2,001 | 62.0% | 18.8% | 18.5% | 0.6% | $92k | 29.2% | 9.9% | 21.8% | 86.2% | 8.6% | 5.7% |
| 000104 | 3,622 | 2,557 | 27.5% | 33.0% | 32.1% | 0.8% | $54k | 16.8% | 20.1% | 19.0% | 44.7% | 19.7% | 20.3% |
| 000109 | 1,556 | 1,293 | 65.2% | 12.7% | 19.0% | 0.0% | $92k | 27.9% | 15.5% | 23.5% | 87.5% | 6.0% | 5.8% |
| 000115 | 1,469 | 1,205 | 72.1% | 13.9% | 10.6% | 0.2% | $90k | 33.3% | 19.7% | 22.6% | 80.4% | 11.4% | 10.2% |
| 000117 | 42 | 40 | 55.0% | 26.9% | 12.6% | 4.5% | $61k | 25.2% | 68.8% | 20.2% | 84.7% | 18.0% | 15.3% |
| 000121 | 256 | 173 | 36.6% | 24.0% | 35.9% | 0.0% | $35k | 16.1% | 19.2% | 22.2% | 37.1% | 26.4% | 15.8% |
| 000202 | 190 | 150 | 49.6% | 32.4% | 12.6% | 1.2% | $57k | 21.0% | 32.0% | 20.4% | 64.6% | 19.6% | 23.0% |
| 000203 | 1,933 | 1,599 | 81.7% | 4.6% | 1.9% | 0.0% | $101k | 32.3% | 18.8% | 25.9% | 81.1% | 12.7% | 4.1% |
| 000205 | 3,725 | 3,090 | 65.9% | 13.0% | 15.5% | 3.9% | $71k | 52.1% | 27.9% | 27.1% | 49.5% | 7.9% | 5.0% |
| 000208 | 4,303 | 3,342 | 54.2% | 28.4% | 11.0% | 0.5% | $65k | 21.4% | 23.7% | 21.0% | 67.7% | 17.9% | 20.8% |
| 000307 | 2,551 | 1,935 | 41.5% | 19.6% | 26.8% | 2.6% | $96k | 34.6% | 31.7% | 18.6% | 42.3% | 32.5% | 12.3% |
| 000311 | 2,351 | 1,783 | 79.7% | 8.0% | 3.0% | 3.3% | $97k | 29.0% | 9.0% | 27.7% | 94.1% | 9.5% | 4.7% |
| 000312 | 1,695 | 1,366 | 81.1% | 12.6% | 1.4% | 2.0% | $106k | 35.3% | 7.9% | 28.4% | 91.6% | 9.1% | 6.0% |
| 000316 | 498 | 359 | 45.3% | 18.0% | 31.3% | 1.5% | $69k | 17.9% | 21.0% | 24.7% | 34.6% | 45.2% | 9.8% |
| 000320 | 2,650 | 2,002 | 75.3% | 14.8% | 4.6% | 1.4% | $112k | 41.5% | 12.9% | 21.9% | 86.3% | 13.2% | 5.8% |
| 000406 | 2,914 | 2,627 | 63.2% | 21.1% | 9.9% | 2.7% | $56k | 38.1% | 47.7% | 22.9% | 64.6% | 8.7% | 11.5% |
| 000410 | 1,535 | 1,158 | 61.7% | 10.6% | 22.2% | 0.0% | $95k | 19.8% | 8.2% | 24.3% | 92.6% | 3.1% | 6.0% |
| 000413 | 1,115 | 992 | 79.9% | 18.5% | 0.2% | 0.0% | $117k | 16.7% | 5.8% | 22.8% | 93.6% | 4.1% | 17.9% |
| 000414 | 1,057 | 784 | 63.2% | 26.6% | 8.2% | 0.0% | $65k | 24.4% | 14.1% | 27.0% | 77.8% | 14.8% | 18.6% |
| 000418 | 759 | 594 | 53.4% | 22.1% | 18.8% | 1.8% | $73k | 34.4% | 26.3% | 22.9% | 43.8% | 10.3% | 14.5% |
| 000419 | 684 | 504 | 68.6% | 16.2% | 14.1% | 0.5% | $81k | 39.6% | 27.7% | 20.2% | 59.2% | 7.6% | 5.3% |
Matagorda: 18 precincts
| Precinct | Population | Voting-age pop. | % White non-Hisp. | % Hispanic | % Black | % Asian | Median income* | % Bachelor's+ | % 18-29 (of adults) | % 65+ | % Homeowners | % Below poverty | % Spanish at home (adults) |
|---|---|---|---|---|---|---|---|---|---|---|---|---|---|
| Precinct 0002 | 1,016 | 869 | 90.4% | 3.8% | 0.0% | 0.0% | $49k | 24.9% | 9.7% | 25.7% | 88.7% | 18.7% | 4.4% |
| Precinct 0004 | 789 | 622 | 63.0% | 27.8% | 0.0% | 0.0% | $77k | 15.4% | 24.2% | 26.0% | 96.3% | 14.7% | 18.5% |
| Precinct 0005 | 2,750 | 1,828 | 42.9% | 37.0% | 15.3% | 2.4% | $58k | 20.8% | 8.1% | 21.6% | 88.4% | 15.1% | 18.4% |
| Precinct 0006 | 2,450 | 2,070 | 72.6% | 16.0% | 6.3% | 0.9% | $70k | 31.2% | 0.8% | 38.7% | 86.3% | 19.5% | 9.0% |
| Precinct 0007 | 1,951 | 1,475 | 55.9% | 27.9% | 0.0% | 7.8% | $102k | 17.7% | 9.3% | 15.2% | 85.4% | 4.9% | 12.6% |
| Precinct 0008 | 1,645 | 1,102 | 69.2% | 24.6% | 0.2% | 0.0% | $76k | 16.8% | 28.0% | 15.9% | 96.0% | 27.3% | 6.2% |
| Precinct 0009 | 407 | 289 | 60.3% | 6.8% | 27.4% | 1.3% | $46k | 33.4% | 15.8% | 27.0% | 99.9% | 23.7% | 0.2% |
| Precinct 0010 | 303 | 257 | 85.0% | 0.2% | 0.2% | 0.0% | $58k | 29.9% | 11.2% | 19.3% | 82.8% | 5.5% | 0.1% |
| Precinct 0012 | 308 | 225 | 58.0% | 28.8% | 0.0% | 0.0% | $53k | 8.0% | 37.3% | 26.1% | 96.6% | 20.0% | 24.1% |
| Precinct 0013 | 515 | 446 | 59.6% | 17.2% | 19.6% | 1.9% | $60k | 27.1% | 9.0% | 32.9% | 84.8% | 12.2% | 5.4% |
| Precinct 001A | 4,545 | 3,110 | 36.6% | 54.5% | 3.7% | 0.2% | $75k | 20.2% | 22.9% | 11.9% | 78.7% | 13.9% | 35.1% |
| Precinct 001B | 7,096 | 5,462 | 36.2% | 47.9% | 11.6% | 2.6% | $50k | 29.5% | 27.5% | 12.6% | 36.9% | 18.0% | 27.2% |
| Precinct 001C | 979 | 738 | 14.4% | 42.9% | 36.7% | 0.0% | $32k | 17.8% | 12.8% | 15.9% | 67.3% | 28.8% | 18.9% |
| Precinct 001D | 2,936 | 1,771 | 16.2% | 59.7% | 22.2% | 0.4% | $39k | 10.3% | 19.2% | 13.6% | 44.9% | 49.2% | 44.2% |
| Precinct 001E | 2,816 | 1,996 | 28.4% | 43.5% | 23.1% | 1.2% | $49k | 14.1% | 18.5% | 12.5% | 41.5% | 34.8% | 20.8% |
| Precinct 001F | 1,199 | 983 | 31.2% | 65.1% | 0.4% | 0.1% | $85k | 16.9% | 39.6% | 17.7% | 76.9% | 5.7% | 32.3% |
| Precinct 003A | 3,059 | 2,502 | 28.6% | 69.2% | 1.1% | 1.0% | $54k | 27.6% | 11.1% | 22.8% | 86.3% | 15.7% | 41.0% |
| Precinct 003B | 1,500 | 1,245 | 36.5% | 55.8% | 0.6% | 4.2% | $61k | 15.2% | 12.1% | 23.8% | 78.1% | 25.0% | 39.0% |
Austin: 15 precincts
| Precinct | Population | Voting-age pop. | % White non-Hisp. | % Hispanic | % Black | % Asian | Median income* | % Bachelor's+ | % 18-29 (of adults) | % 65+ | % Homeowners | % Below poverty | % Spanish at home (adults) |
|---|---|---|---|---|---|---|---|---|---|---|---|---|---|
| Precinct 0101 | 1,928 | 1,472 | 90.7% | 0.9% | 7.9% | 0.4% | $86k | 43.3% | 11.0% | 27.5% | 67.8% | 8.8% | 3.7% |
| Precinct 0102 | 2,296 | 1,658 | 63.8% | 28.3% | 5.6% | 0.0% | $85k | 25.3% | 20.2% | 16.9% | 55.3% | 5.1% | 23.4% |
| Precinct 0103 | 1,731 | 1,382 | 74.3% | 16.3% | 6.1% | 0.0% | $91k | 28.6% | 18.1% | 23.5% | 78.2% | 6.9% | 11.5% |
| Precinct 0104 | 2,270 | 1,853 | 61.5% | 26.4% | 10.5% | 0.0% | $76k | 23.5% | 17.2% | 27.4% | 72.2% | 15.0% | 21.4% |
| Precinct 0205 | 4,338 | 3,100 | 65.0% | 26.5% | 5.1% | 0.0% | $84k | 35.8% | 16.9% | 18.3% | 75.9% | 9.6% | 13.4% |
| Precinct 0206 | 1,814 | 1,485 | 78.4% | 14.9% | 4.1% | 0.0% | $115k | 37.4% | 11.0% | 28.5% | 87.4% | 6.9% | 10.2% |
| Precinct 0207 | 758 | 621 | 74.7% | 15.6% | 6.8% | 0.0% | $123k | 36.3% | 8.8% | 31.1% | 89.8% | 7.0% | 7.9% |
| Precinct 0208 | 1,004 | 716 | 73.8% | 13.6% | 9.6% | 0.2% | $103k | 41.0% | 9.2% | 19.1% | 84.0% | 7.5% | 7.0% |
| Precinct 0309 | 2,069 | 1,572 | 54.7% | 37.1% | 7.9% | 0.0% | $103k | 20.7% | 20.8% | 25.6% | 66.8% | 20.3% | 27.3% |
| Precinct 0310 | 2,524 | 1,911 | 52.2% | 30.5% | 8.0% | 0.1% | $76k | 19.4% | 22.5% | 21.0% | 68.3% | 12.9% | 25.6% |
| Precinct 0311 | 1,609 | 1,215 | 38.3% | 48.1% | 3.9% | 6.2% | $56k | 14.8% | 17.1% | 18.5% | 78.7% | 19.0% | 32.0% |
| Precinct 0412 | 1,496 | 1,063 | 45.5% | 22.8% | 30.6% | 0.3% | $56k | 13.3% | 13.1% | 24.7% | 88.7% | 25.9% | 18.7% |
| Precinct 0413 | 1,927 | 1,599 | 75.3% | 19.2% | 2.2% | 0.3% | $86k | 20.9% | 20.4% | 19.1% | 90.6% | 8.1% | 12.4% |
| Precinct 0414 | 3,546 | 2,804 | 38.5% | 50.5% | 5.3% | 3.8% | $84k | 14.5% | 21.7% | 13.7% | 86.6% | 7.9% | 39.5% |
| Precinct 0415 | 2,108 | 1,603 | 45.5% | 32.1% | 14.3% | 0.1% | $52k | 10.2% | 13.4% | 16.7% | 75.0% | 21.8% | 18.9% |
Fayette: 26 precincts
| Precinct | Population | Voting-age pop. | % White non-Hisp. | % Hispanic | % Black | % Asian | Median income* | % Bachelor's+ | % 18-29 (of adults) | % 65+ | % Homeowners | % Below poverty | % Spanish at home (adults) |
|---|---|---|---|---|---|---|---|---|---|---|---|---|---|
| 0002 | 437 | 409 | 83.0% | 16.8% | 0.0% | 0.0% | $111k | 39.3% | 7.1% | 33.5% | 99.7% | 8.6% | 19.3% |
| 0003 | 537 | 438 | 82.0% | 14.7% | 1.8% | 0.0% | $67k | 29.9% | 8.3% | 33.4% | 88.1% | 4.6% | 8.4% |
| 0004 | 782 | 657 | 89.2% | 8.1% | 0.6% | 0.3% | $79k | 32.8% | 7.2% | 35.2% | 91.6% | 3.1% | 5.5% |
| 0005 | 593 | 483 | 92.0% | 4.8% | 0.0% | 0.5% | $87k | 35.0% | 8.2% | 36.0% | 95.3% | 2.6% | 4.2% |
| 0006 | 539 | 475 | 87.4% | 9.5% | 0.6% | 0.6% | $90k | 40.1% | 7.2% | 44.8% | 91.3% | 10.9% | 5.1% |
| 0007 | 729 | 621 | 82.5% | 13.7% | 1.2% | 0.6% | $91k | 38.0% | 5.5% | 36.7% | 93.0% | 8.3% | 8.9% |
| 0008 | 454 | 380 | 73.1% | 23.6% | 2.3% | 0.0% | $89k | 26.5% | 3.1% | 32.5% | 92.2% | 1.8% | 14.8% |
| 0009 | 259 | 228 | 87.3% | 11.1% | 0.7% | 0.1% | $89k | 29.7% | 9.8% | 46.3% | 88.7% | 7.0% | 4.5% |
| 0010 | 1,066 | 869 | 92.7% | 4.0% | 0.4% | 0.3% | $94k | 31.1% | 16.1% | 28.3% | 90.5% | 7.7% | 3.1% |
| 0011 | 557 | 462 | 95.7% | 0.1% | 0.1% | 0.1% | $83k | 29.4% | 16.5% | 29.2% | 91.0% | 9.8% | 0.4% |
| 0012 | 816 | 675 | 84.6% | 10.0% | 2.9% | 0.2% | $96k | 35.3% | 14.1% | 27.5% | 91.8% | 5.8% | 9.6% |
| 0013 | 960 | 840 | 82.4% | 13.7% | 1.8% | 0.1% | $77k | 29.2% | 8.9% | 43.7% | 97.4% | 2.8% | 8.6% |
| 0014 | 533 | 485 | 83.0% | 12.2% | 0.4% | 0.8% | $64k | 23.7% | 28.7% | 30.9% | 86.1% | 6.6% | 8.0% |
| 0015 | 400 | 359 | 70.0% | 13.5% | 9.4% | 2.6% | $81k | 20.8% | 31.8% | 23.4% | 82.5% | 9.7% | 8.6% |
| 0016 | 2,769 | 2,051 | 42.8% | 51.5% | 3.8% | 0.7% | $69k | 16.5% | 18.0% | 19.3% | 79.8% | 10.5% | 34.1% |
| 0017 | 774 | 580 | 58.7% | 37.0% | 0.0% | 0.0% | $88k | 29.5% | 20.4% | 22.8% | 77.8% | 5.2% | 15.3% |
| 001E | 2,137 | 1,735 | 64.4% | 14.4% | 15.4% | 0.1% | $71k | 27.8% | 20.6% | 21.0% | 59.2% | 11.4% | 12.6% |
| 001N | 2,679 | 2,058 | 61.6% | 28.8% | 6.9% | 0.1% | $52k | 28.6% | 16.2% | 20.5% | 62.1% | 10.0% | 24.1% |
| 001W | 932 | 669 | 60.6% | 30.4% | 6.7% | 0.1% | $84k | 36.3% | 20.9% | 19.3% | 73.3% | 9.1% | 25.9% |
| 0020 | 1,106 | 889 | 81.1% | 10.0% | 6.7% | 0.3% | $87k | 34.7% | 10.6% | 32.4% | 93.3% | 6.7% | 6.0% |
| 0021 | 518 | 405 | 77.3% | 13.3% | 7.0% | 0.2% | $99k | 27.4% | 8.1% | 26.8% | 90.1% | 6.4% | 6.0% |
| 0022 | 238 | 182 | 77.8% | 18.9% | 0.9% | 0.3% | $119k | 35.2% | 1.5% | 24.4% | 86.0% | 1.8% | 14.4% |
| 0023 | 415 | 318 | 74.4% | 19.9% | 3.3% | 0.3% | $112k | 32.9% | 3.3% | 24.0% | 83.2% | 2.1% | 15.4% |
| 0024 | 313 | 237 | 78.1% | 15.7% | 3.3% | 0.3% | $106k | 28.0% | 2.6% | 25.1% | 84.4% | 3.7% | 12.5% |
| 0025 | 3,926 | 2,999 | 57.3% | 30.2% | 9.5% | 0.0% | $62k | 15.7% | 15.6% | 24.8% | 65.9% | 13.5% | 21.8% |
| 0026 | 830 | 684 | 78.3% | 7.0% | 13.9% | 0.3% | $103k | 30.4% | 9.8% | 28.4% | 98.0% | 8.0% | 0.8% |
Colorado: 11 precincts
| Precinct | Population | Voting-age pop. | % White non-Hisp. | % Hispanic | % Black | % Asian | Median income* | % Bachelor's+ | % 18-29 (of adults) | % 65+ | % Homeowners | % Below poverty | % Spanish at home (adults) |
|---|---|---|---|---|---|---|---|---|---|---|---|---|---|
| Precinct 0101 | 2,845 | 1,902 | 41.7% | 38.8% | 9.3% | 1.6% | $54k | 26.6% | 21.5% | 15.7% | 67.1% | 24.9% | 24.6% |
| Precinct 0102 | 469 | 332 | 67.2% | 27.4% | 2.8% | 2.1% | $45k | 13.8% | 20.1% | 16.2% | 75.8% | 14.1% | 8.8% |
| Precinct 0103 | 1,038 | 790 | 81.1% | 15.3% | 2.5% | 0.8% | $58k | 19.6% | 14.1% | 27.0% | 80.9% | 11.7% | 6.2% |
| Precinct 0201 | 5,132 | 4,170 | 57.5% | 23.8% | 12.0% | 0.2% | $62k | 19.2% | 13.1% | 25.3% | 75.5% | 5.0% | 16.0% |
| Precinct 0202 | 260 | 182 | 64.1% | 23.0% | 1.7% | 1.3% | $55k | 17.4% | 14.5% | 24.1% | 84.2% | 9.3% | 7.0% |
| Precinct 0302 | 1,693 | 1,369 | 76.5% | 5.9% | 13.7% | 0.3% | $102k | 31.8% | 3.6% | 29.6% | 92.3% | 0.0% | 3.0% |
| Precinct 0303 | 616 | 505 | 77.3% | 9.3% | 1.9% | 2.4% | $66k | 25.4% | 8.8% | 44.5% | 94.5% | 0.1% | 11.0% |
| Precinct 0304 | 554 | 457 | 73.4% | 13.4% | 2.8% | 2.2% | $70k | 25.6% | 9.2% | 44.7% | 93.1% | 1.3% | 12.4% |
| Precinct 0305 | 2,265 | 1,831 | 67.8% | 25.7% | 5.5% | 0.2% | $118k | 29.3% | 16.2% | 26.3% | 88.6% | 15.9% | 13.1% |
| Precinct 0401 | 1,755 | 1,267 | 43.2% | 28.7% | 4.3% | 1.5% | $74k | 15.7% | 20.8% | 15.9% | 77.1% | 11.9% | 15.7% |
| Precinct 0402 | 4,381 | 3,298 | 28.2% | 55.5% | 14.7% | 0.0% | $82k | 22.0% | 24.1% | 19.3% | 77.7% | 12.3% | 25.3% |
Calhoun: 25 precincts
| Precinct | Population | Voting-age pop. | % White non-Hisp. | % Hispanic | % Black | % Asian | Median income* | % Bachelor's+ | % 18-29 (of adults) | % 65+ | % Homeowners | % Below poverty | % Spanish at home (adults) |
|---|---|---|---|---|---|---|---|---|---|---|---|---|---|
| 000001 | 772 | 569 | 20.4% | 78.3% | 0.7% | 0.0% | $113k | 6.1% | 7.6% | 29.4% | 49.9% | 32.2% | 61.6% |
| 000002 | 2,183 | 1,533 | 3.8% | 92.2% | 1.2% | 1.4% | $90k | 6.7% | 38.9% | 5.7% | 81.8% | 8.6% | 51.6% |
| 000003 | 6 | 4 | 39.3% | 53.6% | 1.0% | 6.1% | 36.8% | 13.1% | 21.5% | 58.2% | 18.3% | 6.8% | |
| 000004 | 40 | 28 | 27.6% | 61.3% | 0.0% | 10.8% | $79k | 33.3% | 23.0% | 5.8% | 65.9% | 4.2% | 30.2% |
| 000005 | 864 | 607 | 29.5% | 61.1% | 0.3% | 7.3% | $79k | 26.2% | 15.9% | 7.0% | 66.3% | 6.5% | 23.1% |
| 000006 | 2,301 | 1,581 | 29.3% | 56.7% | 5.9% | 5.4% | $84k | 22.8% | 16.1% | 10.5% | 70.9% | 11.8% | 23.8% |
| 000007 | 1,097 | 1,007 | 30.7% | 68.7% | 0.0% | 0.0% | $52k | 1.9% | 34.2% | 23.1% | 56.7% | 0.0% | 23.8% |
| 000008 | 188 | 125 | 27.5% | 54.4% | 9.1% | 7.3% | $83k | 26.6% | 22.4% | 10.9% | 72.3% | 13.0% | 29.8% |
| 000009 | 122 | 85 | 17.8% | 82.2% | 0.0% | 0.0% | $114k | 1.7% | 7.0% | 29.5% | 45.4% | 34.7% | 69.4% |
| 000010 | 363 | 287 | 29.4% | 55.9% | 8.5% | 5.9% | $108k | 10.9% | 19.9% | 24.4% | 71.9% | 12.8% | 35.4% |
| 000011 | 919 | 732 | 34.3% | 48.5% | 9.3% | 7.6% | $108k | 17.9% | 21.5% | 22.5% | 77.9% | 8.1% | 22.9% |
| 000012 | 2,060 | 1,531 | 47.2% | 40.7% | 0.7% | 10.3% | $102k | 36.3% | 12.9% | 18.6% | 72.9% | 9.9% | 12.9% |
| 000013 | 30 | 21 | 29.2% | 60.2% | 0.1% | 10.2% | $79k | 33.8% | 21.6% | 7.9% | 64.8% | 6.1% | 27.1% |
| 000014 | 33 | 23 | 29.5% | 50.5% | 13.1% | 3.9% | $113k | 22.6% | 18.6% | 17.5% | 79.6% | 17.9% | 28.9% |
| 000015 | 172 | 156 | 32.8% | 63.7% | 1.8% | 0.2% | $81k | 27.3% | 30.9% | 30.3% | 93.6% | 7.6% | 47.9% |
| 000016 | 861 | 717 | 35.4% | 47.8% | 5.5% | 10.5% | $102k | 26.0% | 24.7% | 24.4% | 88.8% | 4.5% | 34.1% |
| 000017 | 1,419 | 1,175 | 35.3% | 42.7% | 9.7% | 11.5% | $112k | 19.5% | 20.8% | 22.3% | 86.7% | 4.1% | 25.1% |
| 000018 | 796 | 707 | 35.0% | 56.1% | 4.1% | 0.3% | $93k | 24.9% | 30.9% | 28.3% | 84.8% | 6.3% | 41.7% |
| 000019 | 865 | 747 | 78.5% | 7.8% | 0.2% | 0.0% | $143k | 23.3% | 6.3% | 23.7% | 98.3% | 0.1% | 3.4% |
| 000020 | 84 | 59 | 20.9% | 69.8% | 0.3% | 8.3% | $82k | 26.7% | 27.5% | 5.4% | 69.9% | 5.2% | 36.2% |
| 000021 | 212 | 149 | 29.8% | 61.1% | 0.3% | 6.5% | $79k | 24.6% | 14.5% | 7.2% | 66.3% | 7.0% | 21.7% |
| 000022 | 299 | 228 | 71.2% | 26.3% | 0.1% | 0.1% | $87k | 26.1% | 11.8% | 16.1% | 82.5% | 8.4% | 10.2% |
| 000023 | 974 | 787 | 72.6% | 17.6% | 0.0% | 0.0% | $113k | 20.9% | 6.3% | 20.6% | 91.7% | 7.1% | 11.7% |
| 000024 | 2,243 | 1,780 | 60.1% | 31.2% | 0.1% | 1.1% | $89k | 13.2% | 8.0% | 23.3% | 80.3% | 4.4% | 9.3% |
| 000025 | 1,170 | 880 | 86.0% | 13.9% | 0.1% | 0.0% | $132k | 31.1% | 3.9% | 34.6% | 99.9% | 0.1% | 13.3% |
San Patricio: 10 precincts
| Precinct | Population | Voting-age pop. | % White non-Hisp. | % Hispanic | % Black | % Asian | Median income* | % Bachelor's+ | % 18-29 (of adults) | % 65+ | % Homeowners | % Below poverty | % Spanish at home (adults) |
|---|---|---|---|---|---|---|---|---|---|---|---|---|---|
| Precinct 0106 (part) | 48 | 39 | 38.2% | 42.0% | 7.0% | 0.9% | $50k | 18.2% | 22.7% | 24.4% | 75.1% | 17.2% | 33.2% |
| Precinct 0108 (part) | 258 | 185 | 38.3% | 51.9% | 1.1% | 2.5% | $72k | 16.3% | 25.3% | 10.1% | 55.5% | 12.2% | 23.7% |
| Precinct 0109 | 4,564 | 3,432 | 41.6% | 51.1% | 0.9% | 0.3% | $87k | 23.7% | 16.0% | 9.9% | 72.5% | 10.3% | 23.3% |
| Precinct 0113 (part) | 848 | 563 | 12.8% | 83.6% | 1.1% | 0.9% | $52k | 9.6% | 20.7% | 17.1% | 66.2% | 38.8% | 55.2% |
| Precinct 0114 | 2,140 | 1,613 | 66.5% | 30.9% | 0.3% | 0.3% | $54k | 21.4% | 10.0% | 19.2% | 80.0% | 4.7% | 17.9% |
| Precinct 0115 (part) | 5,473 | 3,922 | 48.5% | 47.5% | 0.9% | 1.6% | $77k | 14.2% | 19.8% | 14.0% | 54.3% | 13.9% | 20.6% |
| Precinct 0116 (part) | 3,103 | 2,248 | 60.0% | 29.7% | 3.5% | 1.9% | $100k | 38.0% | 19.2% | 16.5% | 64.5% | 4.7% | 18.4% |
| Precinct 0119 | 1,464 | 1,081 | 46.9% | 44.2% | 0.7% | 4.6% | $86k | 33.6% | 24.7% | 18.7% | 86.3% | 18.8% | 12.2% |
| Precinct 0120 | 1,302 | 1,061 | 71.4% | 21.2% | 1.4% | 0.9% | $99k | 37.0% | 11.7% | 24.9% | 86.2% | 2.4% | 14.7% |
| Precinct 0121 (part) | 596 | 505 | 45.9% | 48.0% | 2.2% | 2.5% | $89k | 19.7% | 22.4% | 18.3% | 59.0% | 4.7% | 29.2% |
Jackson: 9 precincts
| Precinct | Population | Voting-age pop. | % White non-Hisp. | % Hispanic | % Black | % Asian | Median income* | % Bachelor's+ | % 18-29 (of adults) | % 65+ | % Homeowners | % Below poverty | % Spanish at home (adults) |
|---|---|---|---|---|---|---|---|---|---|---|---|---|---|
| Precinct 0001 | 3,680 | 2,826 | 54.8% | 41.2% | 1.5% | 0.0% | $68k | 16.3% | 22.2% | 19.5% | 72.0% | 16.4% | 27.1% |
| Precinct 0002 | 4,302 | 3,208 | 43.7% | 42.6% | 11.5% | 0.6% | $68k | 9.4% | 14.9% | 17.4% | 67.1% | 17.9% | 23.9% |
| Precinct 0003 | 2,858 | 2,076 | 77.4% | 16.8% | 2.4% | 0.0% | $88k | 29.9% | 13.8% | 22.3% | 65.1% | 6.4% | 8.1% |
| Precinct 0004 | 1,056 | 842 | 70.3% | 21.5% | 0.1% | 7.4% | $87k | 12.0% | 16.8% | 29.2% | 84.5% | 5.2% | 16.4% |
| Precinct 0005 | 607 | 423 | 51.8% | 48.0% | 0.1% | 0.0% | $74k | 47.6% | 8.8% | 20.5% | 92.3% | 0.2% | 20.1% |
| Precinct 0006 | 1,439 | 1,086 | 39.8% | 33.4% | 26.3% | 0.0% | $52k | 6.9% | 21.5% | 7.2% | 58.9% | 33.2% | 20.7% |
| Precinct 0007 | 360 | 280 | 73.2% | 12.2% | 0.0% | 13.5% | $108k | 20.7% | 16.7% | 24.2% | 85.3% | 2.4% | 18.5% |
| Precinct 0008 | 490 | 404 | 67.3% | 32.2% | 0.0% | 0.0% | $53k | 1.0% | 16.8% | 35.8% | 83.8% | 8.4% | 13.6% |
| Precinct 0009 | 451 | 350 | 73.2% | 12.2% | 0.0% | 13.5% | $108k | 20.7% | 16.7% | 24.2% | 85.3% | 2.4% | 18.5% |
Aransas: 5 precincts
| Precinct | Population | Voting-age pop. | % White non-Hisp. | % Hispanic | % Black | % Asian | Median income* | % Bachelor's+ | % 18-29 (of adults) | % 65+ | % Homeowners | % Below poverty | % Spanish at home (adults) |
|---|---|---|---|---|---|---|---|---|---|---|---|---|---|
| Precinct 0001 (part) | 1,887 | 1,427 | 70.9% | 25.1% | 0.2% | 0.7% | $90k | 20.9% | 24.1% | 18.3% | 85.7% | 11.7% | 5.0% |
| Precinct 0003 | 6,392 | 5,646 | 71.8% | 20.0% | 3.7% | 2.4% | $84k | 43.5% | 14.5% | 32.2% | 67.5% | 10.4% | 7.5% |
| Precinct 0004 (part) | 146 | 136 | 86.0% | 8.2% | 1.2% | 0.4% | $88k | 39.0% | 2.2% | 45.0% | 78.5% | 7.6% | 5.4% |
| Precinct 001A (part) | 792 | 637 | 56.9% | 39.5% | 0.0% | 3.0% | $46k | 12.4% | 2.7% | 23.9% | 77.6% | 29.2% | 25.5% |
| Precinct 004A (part) | 1,111 | 960 | 77.6% | 16.2% | 0.0% | 0.8% | $76k | 39.3% | 14.8% | 35.0% | 87.0% | 15.3% | 6.5% |
Refugio: 2 precincts
| Precinct | Population | Voting-age pop. | % White non-Hisp. | % Hispanic | % Black | % Asian | Median income* | % Bachelor's+ | % 18-29 (of adults) | % 65+ | % Homeowners | % Below poverty | % Spanish at home (adults) |
|---|---|---|---|---|---|---|---|---|---|---|---|---|---|
| Precinct 004A (part) | 88 | 72 | 53.1% | 45.5% | 0.1% | 0.0% | $69k | 16.8% | 12.4% | 32.9% | 89.8% | 6.7% | 37.7% |
| Precinct 004B (part) | 89 | 73 | 53.1% | 45.6% | 0.0% | 0.0% | $69k | 16.9% | 12.4% | 33.1% | 89.8% | 6.4% | 37.9% |
*Median income is approximate (see note above). ACS 2020-2024 5-year.
Nonpartisan voter information. GOTV Polling does not endorse any candidate.