
Virginia's 2nd Congressional District
U.S. House · Virginia · District 2 · General election: Tuesday, November 3, 2026
Candidates on the November 3 ballot
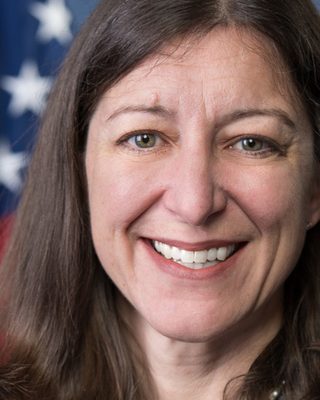 Elaine G. LuriaDemocraticPhoto: U.S. Congress
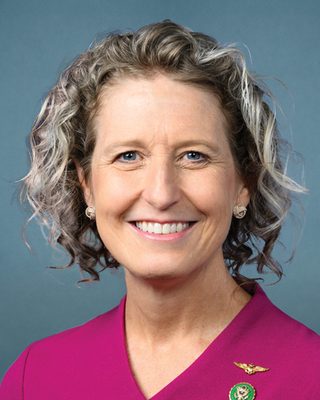 Jen A. KiggansRepublicanIncumbentPhoto: U.S. Congress
- Geral D. "Bishop" StatenIndependent
- J. Matt BakerIndependent
Source: Virginia Department of Elections, candidate list, November 3, 2026 General Election, federal offices, certified list (list retrieved 2026-10-30; retrieved 2026-10-30). Order of names does not reflect ballot order. Incumbent tags appear only where the official list marks incumbents. Photos come from the Candidate Alerts database where one is on file; otherwise initials are shown.
Federal campaign finance filings for this seat: FEC election page (FEC registration is not the same as ballot qualification).
Certified candidates
- Jennifer A. Kiggans RepublicanIncumbent @RepJenKiggans Website
- Elaine G. Luria Democratic @ElaineLuria Website
- Geral Defrance Staten Independent
- Matthew Baker Independent Website
Certified candidate list from Candidate Alerts, as of 2026-09-24, based on Virginia Department of Elections. Includes candidates the database marks as on the November 3 ballot. Incumbent tags here follow the database.
Past election results
| Candidate | Party | Votes | Share |
|---|---|---|---|
| Jen A. Kiggans | Republican | 207,368 | 50.7% |
| Missy Cotter Smasal | Democratic | 191,666 | 46.9% |
| Robert E. Reid, Jr. | Independent | 9,197 | 2.3% |
| Write-In | 471 | 0.1% | |
| Total | 408,702 |
Source: Virginia Department of Elections, official election results (Enhanced Voting media export, by locality and precinct). Status: Official, Virginia Department of Elections ENR media export (created 2025-03-05, after State Board certification Dec 2 2024)
| Candidate | Party | Votes | Share |
|---|---|---|---|
| Jen A. Kiggans | Republican | 153,328 | 51.6% |
| Elaine G. Luria | Democratic | 143,219 | 48.2% |
| Write In | Wri | 449 | 0.2% |
| Total | 296,996 |
Source: Virginia Department of Elections, official results site (results.elections.virginia.gov), results by precinct JSON. Status: Official results (all reporting stages 'Certified'), Virginia Department of Elections official results site
Held under the district lines in effect at the time. Those boundaries differ from the 2026 district.
| Candidate | Party | Votes | Share |
|---|---|---|---|
| Elaine Goodman Luria | Democratic | 185,733 | 51.6% |
| Scott William Taylor | Republican | 165,031 | 45.8% |
| David Bruce Foster | Independent | 9,170 | 2.5% |
| Write-Ins | 343 | 0.1% | |
| Total | 360,277 |
Source: Virginia Department of Elections, Historical Elections Database (historical.elections.virginia.gov). Status: Certified, Virginia Department of Elections Historical Elections Database (official certified results by locality and precinct; State Board of Elections certification)
Certified results from state or county election authorities, as compiled in the Candidate Alerts precinct results database (public API candidatealerts.com/api/district-results). Totals are sums of certified precinct and county-level rows.
Demographics
2020 Census demographics by district are not yet published in this data set.
0 of 231 precincts are above 50%, and 0 are above 25%. Source: Census American Community Survey 2020-2024 5-year block groups, allocated to current precinct shapes by area.
Poll status
Map
Share of adults (18+) who speak Spanish at home, by precinct. Census ACS 2020-2024 5-year estimates on the current precinct layer. Hover a precinct for its value.
District shown in red: U.S. Census Bureau cartographic boundary file for the 119th Congress (cb_2024_us_cd119_500k). These are the lines in effect for 2026 in this state per the Candidate Alerts district registry.
Precinct map: past elections and demographics
Choose a layer above. Hover a precinct for its values.
Precinct results
Certified precinct results on current precinct shapes, grouped by county. 430 precincts. "(part)" marks a precinct only partly inside this district; its full vote is shown, so district sums are approximate and are not the official district total. Elections were held under older lines and are shown on the 2026 district.
| County | 2024 President | 2020 President | ||
|---|---|---|---|---|
| Margin | Votes | Margin | Votes | |
| Virginia Beach city | D+2.8 | 223,817 | R+22.9 | 95,734 |
| Chesapeake city | R+9.5 | 73,412 | R+46.0 | 20,588 |
| Suffolk city | D+15.9 | 52,327 | R+16.0 | 18,555 |
| Isle of Wight County | R+19.8 | 24,311 | R+48.9 | 9,558 |
| Accomack County | R+13.2 | 16,917 | R+48.4 | 8,284 |
| Southampton County | R+32.2 | 5,948 | R+45.6 | 3,389 |
| Northampton County | D+6.3 | 6,767 | R+21.8 | 2,228 |
| Franklin city | D+22.8 | 3,806 | D+8.7 | 1,662 |
| All counties (approx.) | R+0.0 | 407,305 | R+28.1 | 159,998 |
Virginia Beach city: 208 precincts
| Precinct | 2024 President | 2020 President | ||
|---|---|---|---|---|
| Margin | Votes | Margin | Votes | |
| 001 - PRECINCT 1 | R+12.3 | 3,308 | - | - |
| 002 - PRECINCT 2 | D+2.5 | 2,783 | - | - |
| 003 - PRECINCT 3 | R+8.0 | 1,844 | - | - |
| 004 - PRECINCT 4 | R+14.5 | 2,597 | - | - |
| 005 - PRECINCT 5 | D+9.4 | 2,184 | - | - |
| 006 - PRECINCT 6 | R+5.9 | 2,709 | - | - |
| 007 - PRECINCT 7 | R+1.5 | 1,647 | - | - |
| 008 - PRECINCT 8 | D+3.9 | 2,341 | - | - |
| 009 - PRECINCT 9 | R+15.6 | 2,394 | - | - |
| 010 - PRECINCT 10 | R+20.8 | 2,939 | - | - |
| 011 - PRECINCT 11 | D+8.2 | 3,082 | - | - |
| 012 - PRECINCT 12 | D+9.0 | 2,332 | - | - |
| 013 - PRECINCT 13 | R+3.4 | 2,857 | - | - |
| 014 - PRECINCT 14 | D+0.6 | 2,470 | - | - |
| 015 - PRECINCT 15 | R+3.4 | 1,801 | - | - |
| 016 - PRECINCT 16 | R+5.0 | 2,338 | - | - |
| 017 - PRECINCT 17 | R+4.6 | 1,963 | - | - |
| 018 - PRECINCT 18 | R+0.9 | 2,868 | - | - |
| 019 - PRECINCT 19 | R+10.2 | 1,386 | - | - |
| 020 - PRECINCT 20 | R+7.3 | 1,487 | - | - |
| 021 - PRECINCT 21 | D+42.9 | 2,279 | - | - |
| 022 - PRECINCT 22 | R+8.4 | 1,828 | - | - |
| 023 - PRECINCT 23 | R+6.8 | 2,284 | - | - |
| 024 - PRECINCT 24 | R+10.1 | 1,018 | - | - |
| 025 - PRECINCT 25 | R+7.6 | 2,751 | - | - |
| 026 - PRECINCT 26 | R+6.6 | 1,539 | - | - |
| 027 - PRECINCT 27 | R+5.5 | 1,300 | - | - |
| 028 - PRECINCT 28 | R+8.1 | 1,748 | - | - |
| 029 - PRECINCT 29 | D+17.9 | 2,288 | - | - |
| 030 - PRECINCT 30 | R+10.3 | 2,456 | - | - |
| 031 - PRECINCT 31 | R+24.0 | 3,285 | - | - |
| 032 - PRECINCT 32 | R+51.8 | 1,256 | - | - |
| 033 - PRECINCT 33 | R+51.4 | 1,365 | - | - |
| 034 - PRECINCT 34 | R+50.7 | 860 | - | - |
| 035 - PRECINCT 35 | R+14.0 | 2,817 | - | - |
| 036 - PRECINCT 36 | D+17.3 | 2,833 | - | - |
| 037 - PRECINCT 37 | R+2.1 | 1,915 | - | - |
| 038 - PRECINCT 38 | R+5.2 | 2,413 | - | - |
| 039 - PRECINCT 39 | D+1.8 | 1,678 | - | - |
| 040 - PRECINCT 40 | D+14.1 | 2,032 | - | - |
| 041 - PRECINCT 41 | D+43.3 | 1,262 | - | - |
| 042 - PRECINCT 42 | D+8.9 | 2,296 | - | - |
| 043 - PRECINCT 43 | D+24.4 | 2,071 | - | - |
| 044 - PRECINCT 44 | R+6.6 | 2,518 | - | - |
| 045 - PRECINCT 45 | D+28.6 | 2,084 | - | - |
| 046 - PRECINCT 46 | D+22.9 | 2,173 | - | - |
| 047 - PRECINCT 47 | R+9.4 | 2,993 | - | - |
| 048 - PRECINCT 48 | R+1.2 | 1,555 | - | - |
| 049 - PRECINCT 49 | R+6.0 | 2,162 | - | - |
| 050 - PRECINCT 50 | D+18.3 | 1,520 | - | - |
| 051 - PRECINCT 51 | R+2.9 | 2,136 | - | - |
| 052 - PRECINCT 52 | D+3.0 | 3,020 | - | - |
| 053 - PRECINCT 53 | R+1.5 | 2,413 | - | - |
| 054 - PRECINCT 54 | D+5.0 | 1,704 | - | - |
| 055 - PRECINCT 55 | D+23.2 | 2,331 | - | - |
| 056 - PRECINCT 56 | R+4.5 | 1,186 | - | - |
| 057 - PRECINCT 57 | R+6.2 | 1,637 | - | - |
| 058 - PRECINCT 58 | D+5.7 | 1,734 | - | - |
| 059 - PRECINCT 59 | D+6.3 | 1,703 | - | - |
| 060 - PRECINCT 60 | R+20.3 | 3,210 | - | - |
| 061 - PRECINCT 61 | D+61.2 | 2,076 | - | - |
| 062 - PRECINCT 62 | R+1.3 | 2,774 | - | - |
| 063 - PRECINCT 63 | R+6.0 | 3,333 | - | - |
| 064 - PRECINCT 64 | D+10.8 | 2,860 | - | - |
| 065 - PRECINCT 65 | D+10.0 | 2,600 | - | - |
| 066 - PRECINCT 66 | R+13.1 | 2,248 | - | - |
| 067 - PRECINCT 67 | D+12.7 | 1,183 | - | - |
| 068 - PRECINCT 68 | R+4.2 | 2,156 | - | - |
| 069 - PRECINCT 69 (0001,0000) | D+42.2 | 2,105 | - | - |
| 070 - PRECINCT 70 | R+3.6 | 2,632 | - | - |
| 071 - PRECINCT 71 | D+11.2 | 2,131 | - | - |
| 072 - PRECINCT 72 | R+19.1 | 2,510 | - | - |
| 073 - PRECINCT 73 | D+31.4 | 1,987 | - | - |
| 074 - PRECINCT 74 | D+23.5 | 1,920 | - | - |
| 075 - PRECINCT 75 | R+16.8 | 2,906 | - | - |
| 076 - PRECINCT 76 | D+33.1 | 2,024 | - | - |
| 077 - PRECINCT 77 | D+4.7 | 2,085 | - | - |
| 078 - PRECINCT 78 | D+14.7 | 2,039 | - | - |
| 079 - PRECINCT 79 | D+33.2 | 2,225 | - | - |
| 080 - PRECINCT 80 | D+28.1 | 1,889 | - | - |
| 081 - PRECINCT 81 | D+15.7 | 2,439 | - | - |
| 082 - PRECINCT 82 | R+7.2 | 2,036 | - | - |
| 083 - PRECINCT 83 | R+13.9 | 2,719 | - | - |
| 084 - PRECINCT 84 | D+17.8 | 2,178 | - | - |
| 085 - PRECINCT 85 | R+17.7 | 3,024 | - | - |
| 086 - PRECINCT 86 | D+7.2 | 2,625 | - | - |
| 087 - PRECINCT 87 | D+0.7 | 2,188 | - | - |
| 088 - PRECINCT 88 | R+10.3 | 2,333 | - | - |
| 089 - PRECINCT 89 | D+1.0 | 2,231 | - | - |
| 090 - PRECINCT 90 | R+7.8 | 1,644 | - | - |
| 091 - PRECINCT 91 | D+19.1 | 3,027 | - | - |
| 092 - PRECINCT 92 | R+10.7 | 1,697 | - | - |
| 093 - PRECINCT 93 | D+59.5 | 2,148 | - | - |
| 094 - PRECINCT 94 | R+7.5 | 1,610 | - | - |
| 095 - PRECINCT 95 | R+12.0 | 1,718 | - | - |
| 096 - PRECINCT 96 | D+16.3 | 1,606 | - | - |
| 097 - PRECINCT 97 | D+23.2 | 2,068 | - | - |
| 098 - PRECINCT 98 | D+29.4 | 1,489 | - | - |
| 099 - PRECINCT 99 | D+22.7 | 1,316 | - | - |
| 1 - North Beach | - | - | R+47.7 | 1,270 |
| 10 - Great Neck | - | - | R+58.8 | 775 |
| 100 - PRECINCT 100 | R+26.4 | 1,247 | - | - |
| 100 - Sandbridge | - | - | R+59.5 | 607 |
| 101 - PRECINCT 101 | R+5.3 | 588 | - | - |
| 102 - PRECINCT 102 | D+14.4 | 367 | - | - |
| 103 - PRECINCT 103 | D+31.7 | 957 | - | - |
| 104 - PRECINCT 104 | D+46.3 | 1,891 | - | - |
| 105 - PRECINCT 105 | R+16.5 | 757 | - | - |
| 106 - PRECINCT 106 | D+27.5 | 1,429 | - | - |
| 107 - PRECINCT 107 | R+8.0 | 1,132 | - | - |
| 108 - PRECINCT 108 | R+4.7 | 687 | - | - |
| 11 - Cape Henry | - | - | R+35.5 | 1,020 |
| 12 - Plaza | - | - | R+4.3 | 1,166 |
| 13 - Mt Trashmore | - | - | R+25.9 | 1,318 |
| 14 - Malibu | - | - | R+30.5 | 1,335 |
| 15 - Old Donation | - | - | R+22.9 | 895 |
| 16 - Aragona | - | - | R+24.3 | 1,438 |
| 17 - Ocean Park | - | - | R+44.7 | 562 |
| 18 - Thoroughgood | - | - | R+39.7 | 914 |
| 19 - Lake Smith | - | - | R+37.7 | 685 |
| 2 - South Beach | - | - | R+20.2 | 1,169 |
| 20 - Bayside | - | - | R+33.8 | 852 |
| 21 - Davis Corner | - | - | D+32.8 | 891 |
| 22 - Point O View | - | - | R+31.1 | 1,009 |
| 23 - Arrowhead | - | - | R+31.1 | 1,285 |
| 24 - Larkspur | - | - | R+14.1 | 818 |
| 25 - Avalon | - | - | R+25.0 | 1,470 |
| 26 - Fairfield | - | - | R+38.2 | 923 |
| 27 - Edwin | - | - | R+37.3 | 1,034 |
| 28 - Thalia | - | - | R+31.2 | 891 |
| 29 - Holland | - | - | D+1.1 | 1,048 |
| 3 - Ocean Lakes | - | - | R+32.3 | 851 |
| 30 - Red Wing | - | - | R+39.9 | 745 |
| 31 - Sigma | - | - | R+55.9 | 1,267 |
| 32 - Creeds | - | - | R+63.5 | 945 |
| 33 - Capps Shop | - | - | R+71.5 | 941 |
| 34 - Blackwater | - | - | R+65.7 | 626 |
| 35 - Courthouse | - | - | R+56.0 | 686 |
| 36 - Windsor Oaks | - | - | R+5.2 | 1,214 |
| 37 - Chesapeake Beach | - | - | R+20.9 | 892 |
| 38 - Witchduck | - | - | R+48.8 | 853 |
| 39 - Pembroke | - | - | R+14.7 | 1,229 |
| 4 - Linkhorn | - | - | R+40.5 | 929 |
| 40 - Bonney | - | - | R+15.1 | 1,078 |
| 41 - College Park | - | - | D+33.0 | 1,122 |
| 42 - Brandon | - | - | R+14.9 | 1,113 |
| 43 - Bellamy | - | - | D+7.7 | 996 |
| 44 - Centerville | - | - | R+28.6 | 1,196 |
| 45 - Timberlake | - | - | D+16.4 | 960 |
| 46 - Green Run | - | - | D+5.1 | 905 |
| 47 - Kings Grant | - | - | R+47.4 | 1,219 |
| 48 - Wolfsnare | - | - | R+32.9 | 987 |
| 49 - Lynnhaven | - | - | R+42.6 | 810 |
| 5 - Seatack | - | - | R+3.9 | 1,059 |
| 50 - Oceana | - | - | D+12.9 | 824 |
| 51 - Stratford Chase | - | - | R+29.2 | 918 |
| 52 - Homestead | - | - | R+23.8 | 1,123 |
| 53 - Shannon | - | - | R+30.3 | 806 |
| 54 - Cromwell | - | - | R+15.8 | 723 |
| 55 - Magic Hollow | - | - | D+8.9 | 1,151 |
| 56 - Edinburgh | - | - | R+31.0 | 670 |
| 57 - Sherry Park | - | - | R+34.1 | 701 |
| 58 - Glenwood | - | - | R+23.3 | 1,102 |
| 59 - Shelton Park | - | - | R+19.2 | 806 |
| 6 - Alanton | - | - | R+45.8 | 840 |
| 60 - Foxfire | - | - | R+53.9 | 1,281 |
| 61 - Baker | - | - | D+59.5 | 1,064 |
| 62 - Landstown | - | - | R+33.3 | 1,239 |
| 63 - Culver | - | - | R+37.3 | 1,332 |
| 64 - Rosemont Forest | - | - | R+22.4 | 907 |
| 65 - Colonial | - | - | R+19.5 | 1,132 |
| 66 - Hunt | - | - | R+47.2 | 997 |
| 67 - Eastern Shore | - | - | D+0.0 | 630 |
| 68 - Manor | - | - | R+31.1 | 1,024 |
| 69 - Shell | - | - | D+19.9 | 648 |
| 7 - Kingston | - | - | R+37.6 | 777 |
| 70 - Corporate Landing | - | - | R+25.3 | 1,235 |
| 71 - Round Hill | - | - | R+20.0 | 530 |
| 72 - Rudee | - | - | R+48.9 | 1,007 |
| 73 - Dahlia | - | - | D+6.3 | 895 |
| 74 - Buckner | - | - | D+3.9 | 845 |
| 75 - Colony | - | - | R+51.9 | 1,016 |
| 76 - Village | - | - | D+16.7 | 915 |
| 77 - Brookwood | - | - | R+17.3 | 1,125 |
| 78 - Indian Lakes | - | - | R+17.4 | 832 |
| 79 - Pleasant Hall | - | - | D+15.7 | 898 |
| 8 - London Bridge | - | - | R+23.4 | 1,271 |
| 80 - Chimney Hill | - | - | D+12.2 | 919 |
| 81 - Rock Lake | - | - | R+12.9 | 1,040 |
| 82 - Shelburne | - | - | R+40.9 | 937 |
| 83 - Strawbridge | - | - | R+40.7 | 1,277 |
| 84 - Tallwood | - | - | R+0.9 | 963 |
| 85 - Upton | - | - | R+46.5 | 1,227 |
| 86 - Haygood | - | - | R+37.4 | 811 |
| 87 - Hillcrest | - | - | R+38.5 | 827 |
| 88 - North Landing | - | - | R+35.0 | 909 |
| 89 - Lake Christopher | - | - | R+37.2 | 909 |
| 9 - Trantwood | - | - | R+48.4 | 830 |
| 90 - Lake Joyce | - | - | R+36.8 | 731 |
| 91 - Lexington | - | - | D+0.0 | 917 |
| 92 - Little Neck | - | - | R+37.3 | 951 |
| 93 - Newtown | - | - | D+59.8 | 975 |
| 94 - Pinewood | - | - | R+23.4 | 623 |
| 95 - Dam Neck | - | - | R+37.9 | 771 |
| 96 - Hilltop | - | - | D+8.1 | 803 |
| 97 - Indian River | - | - | R+2.4 | 885 |
| 98 - Independence | - | - | D+9.3 | 550 |
| 99 - Salem Woods | - | - | R+6.8 | 617 |
Chesapeake city: 66 precincts
| Precinct | 2024 President | 2020 President | ||
|---|---|---|---|---|
| Margin | Votes | Margin | Votes | |
| 001 - GREAT BRIDGE | R+21.3 | 2,200 | - | - |
| 002 - BETHEL | R+50.0 | 2,247 | - | - |
| 006 - DEEP CREEK | D+8.3 | 1,898 | - | - |
| 007 - GREENBRIER | R+8.3 | 2,050 | - | - |
| 009 - BELLS MILL | R+26.6 | 3,175 | - | - |
| 014 - GRASSFIELD | R+5.8 | 3,409 | - | - |
| 016 - HICKORY GROVE | R+40.5 | 2,413 | - | - |
| 017 - INDIAN CREEK | R+46.9 | 1,766 | - | - |
| 023 - OAK GROVE | D+14.1 | 2,355 | - | - |
| 028 - SUNRAY I | R+18.4 | 412 | - | - |
| 034 - HICKORY MIDDLE SCHOOL | R+33.6 | 3,044 | - | - |
| 036 - GREAT BRIDGE BAPTIST CHURCH | R+22.4 | 2,145 | - | - |
| 037 - BRIDGETOWN | R+12.4 | 2,577 | - | - |
| 039 - LAKE DRUMMOND | R+6.0 | 1,676 | - | - |
| 041 - JOHN T WEST | D+7.6 | 3,479 | - | - |
| 042 - PARKWAYS | D+27.2 | 1,905 | - | - |
| 043 - PLEASANT CROSSING | R+34.5 | 2,066 | - | - |
| 045 - SUNRAY II | D+0.5 | 553 | - | - |
| 046 - BELLS MILL II | R+5.4 | 2,029 | - | - |
| 049 - WATERWAY | D+9.1 | 2,323 | - | - |
| 050 - RIVER WALK | D+16.9 | 2,146 | - | - |
| 051 - COOPERS WAY | R+22.4 | 3,536 | - | - |
| 052 - SHIPYARD ROAD | D+13.7 | 2,040 | - | - |
| 053 - FAIRWAYS | D+7.6 | 2,180 | - | - |
| 054 - PUGHSVILLE (0001,0000) (part) | D+38.4 | 1,881 | - | - |
| 056 - GREEN TREE | D+14.4 | 1,844 | - | - |
| 059 - CLEARFIELD | D+4.5 | 2,052 | - | - |
| 060 - PARKER ROAD | R+21.1 | 2,355 | - | - |
| 061 - CENTERVILLE | R+29.1 | 2,828 | - | - |
| 062 - FENTRESS | R+25.5 | 2,204 | - | - |
| 063 - POPLAR BRANCH | R+37.0 | 1,566 | - | - |
| 064 - DEEP CREEK II | D+12.7 | 2,574 | - | - |
| 065 - WATERWAY II | R+0.6 | 2,484 | - | - |
| 1 - Great Bridge | - | - | R+53.6 | 576 |
| 14 - Grassfield | - | - | R+46.7 | 557 |
| 16 - Hickory Grove | - | - | R+66.7 | 931 |
| 17 - Indian Creek | - | - | R+70.3 | 811 |
| 2 - Bethel | - | - | R+76.0 | 1,050 |
| 23 - Oak Grove | - | - | R+20.3 | 553 |
| 28 - Sunray I | - | - | R+57.2 | 229 |
| 34 - Hickory Middle School | - | - | R+66.1 | 850 |
| 36 - Great Bridge Baptist Church | - | - | R+47.5 | 743 |
| 37 - Bridgetown | - | - | R+45.6 | 542 |
| 39 - Lake Drummond | - | - | R+45.7 | 562 |
| 41 - John T West | - | - | R+27.6 | 924 |
| 42 - Parkways | - | - | D+1.6 | 497 |
| 43 - Pleasant Crossing | - | - | R+66.8 | 599 |
| 45 - Sunray II | - | - | R+31.4 | 236 |
| 46 - Bells Mill II | - | - | R+45.7 | 588 |
| 49 - Waterway | - | - | R+44.0 | 523 |
| 50 - River Walk | - | - | R+14.2 | 626 |
| 51 - Coopers Way | - | - | R+63.4 | 964 |
| 52 - Shipyard Road | - | - | R+29.6 | 385 |
| 53 - Fairways | - | - | R+17.4 | 800 |
| 54 - Pughsville (part) | - | - | D+25.3 | 486 |
| 56 - Green Tree | - | - | R+17.1 | 439 |
| 59 - Clearfield | - | - | R+35.4 | 577 |
| 6 - Deep Creek | - | - | R+38.2 | 529 |
| 60 - Parker Road | - | - | R+56.8 | 505 |
| 61 - Centerville | - | - | R+66.9 | 905 |
| 62 - Fentress | - | - | R+56.1 | 895 |
| 63 - Poplar Branch | - | - | R+69.2 | 429 |
| 64 - Deep Creek Ii | - | - | R+25.6 | 497 |
| 65 - Waterway Ii | - | - | R+33.2 | 488 |
| 7 - Greenbrier | - | - | R+41.0 | 402 |
| 9 - Bells Mill | - | - | R+64.2 | 890 |
Suffolk city: 57 precincts
| Precinct | 2024 President | 2020 President | ||
|---|---|---|---|---|
| Margin | Votes | Margin | Votes | |
| 101 - BELLEHARBOUR | D+35.5 | 1,098 | - | - |
| 101 - Belleharbour | - | - | D+15.6 | 584 |
| 102 - DRIVER | R+15.8 | 3,716 | - | - |
| 102 - Driver | - | - | R+52.9 | 1,441 |
| 104 - BENNETTS CREEK | D+8.5 | 1,322 | - | - |
| 104 - Bennetts Creek | - | - | R+25.6 | 927 |
| 105 - HARBOURVIEW | D+21.3 | 3,263 | - | - |
| 201 - EBENEZER | R+22.7 | 1,735 | - | - |
| 201 - Ebenezer | - | - | R+54.5 | 951 |
| 202 - CHUCKATUCK | R+13.2 | 1,783 | - | - |
| 202 - Chuckatuck | - | - | R+48.2 | 822 |
| 203 - KINGS FORK | D+39.0 | 2,597 | - | - |
| 203 - Kings Fork | - | - | R+0.4 | 691 |
| 204 - HILLPOINT | D+33.5 | 2,555 | - | - |
| 204 - Hillpoint | - | - | R+6.9 | 698 |
| 301 - WHITE MARSH | D+32.4 | 553 | - | - |
| 301 - White Marsh | - | - | R+5.4 | 204 |
| 302 - JOHN F KENNEDY (0000,0001) | D+74.9 | 1,887 | - | - |
| 302 - John F Kennedy | - | - | D+48.2 | 747 |
| 304 - NANSEMOND RIVER | D+28.2 | 2,356 | - | - |
| 304 - Nansemond River | - | - | R+7.5 | 734 |
| 305 - SHOULDERS HILL | D+25.4 | 1,010 | - | - |
| 305 - Shoulders Hill | - | - | R+21.3 | 324 |
| 306 - DEERFIELD | D+20.7 | 1,632 | - | - |
| 401 - AIRPORT | R+17.0 | 1,500 | - | - |
| 401 - Airport | - | - | R+54.2 | 469 |
| 402 - WHALEYVILLE | R+42.2 | 1,830 | - | - |
| 402 - Whaleyville | - | - | R+62.4 | 812 |
| 403 - SOUTHSIDE | D+73.9 | 944 | - | - |
| 403 - Southside | - | - | D+72.0 | 371 |
| 404 - BOOKER T WASHINGTON | D+80.6 | 1,435 | - | - |
| 404 - Booker T Washington | - | - | D+83.0 | 529 |
| 405 - HOLLYWOOD (0001,0000) | D+80.1 | 794 | - | - |
| 405 - Pittmantown | - | - | R+44.8 | 286 |
| 501 - KILBYS MILL | R+18.3 | 2,525 | - | - |
| 501 - Kilbys Mill | - | - | R+50.2 | 874 |
| 502 - HOLLAND | R+37.1 | 1,519 | - | - |
| 502 - Holland | - | - | R+54.1 | 1,221 |
| 504 - LAKE COHOON | R+17.4 | 3,471 | - | - |
| 504 - Lake Cohoon | - | - | R+59.2 | 1,018 |
| 505 - PITTMANTOWN | R+23.5 | 1,252 | - | - |
| 601 - LAKESIDE | D+20.6 | 1,920 | - | - |
| 601 - Lakeside | - | - | D+4.0 | 706 |
| 602 - OLDE TOWNE | D+32.5 | 538 | - | - |
| 602 - Olde Towne | - | - | D+27.3 | 260 |
| 603 - ELEPHANTS FORK/WESTHAVEN | D+19.2 | 797 | - | - |
| 603 - Elephants Fork/westhaven | - | - | R+25.6 | 281 |
| 604 - WILROY | D+16.8 | 1,986 | - | - |
| 604 - Wilroy | - | - | R+36.0 | 528 |
| 605 - Hollywood | - | - | D+88.7 | 345 |
| 605 - MACK BENN JR | D+39.0 | 513 | - | - |
| 702 - Harbourview | - | - | R+16.9 | 864 |
| 703 - PUGHSVILLE | D+55.3 | 1,489 | - | - |
| 704 - BURBAGE GRANT | D+37.2 | 2,279 | - | - |
| 704 - Burbage Grant | - | - | D+4.0 | 915 |
| 706 - HUNTERSVILLE | D+56.6 | 2,028 | - | - |
| 706 - Huntersville | - | - | D+55.0 | 953 |
Isle of Wight County: 30 precincts
| Precinct | 2024 President | 2020 President | ||
|---|---|---|---|---|
| Margin | Votes | Margin | Votes | |
| 101 - PAGAN RIVER (0001,0000) | R+24.1 | 2,502 | - | - |
| 101 - Smithfield | - | - | R+54.1 | 1,080 |
| 102 - CYPRESS CREEK A | R+18.0 | 2,605 | - | - |
| 102 - Cypress Creek | - | - | R+54.0 | 879 |
| 103 - CYPRESS CREEK B (0000,0001) | R+12.7 | 150 | - | - |
| 201 - BARTLETT | R+6.4 | 2,513 | - | - |
| 201 - Bartlett | - | - | R+55.1 | 1,133 |
| 202 - Carrollton | - | - | R+42.2 | 1,034 |
| 202 - NIKE PARK A | R+26.6 | 2,261 | - | - |
| 203 - NIKE PARK B | R+10.7 | 225 | - | - |
| 301 - RUSHMERE (0000,0001) | D+19.1 | 1,252 | - | - |
| 301 - Rushmere | - | - | R+25.0 | 840 |
| 302 - PONS (0000,0001) | D+16.8 | 1,837 | - | - |
| 302 - Pons | - | - | R+3.5 | 665 |
| 303 - BENNS CHURCH | D+17.6 | 1,200 | - | - |
| 304 - NEW TOWNE | D+31.3 | 361 | - | - |
| 401 - BOWLING GREEN | R+49.4 | 1,355 | - | - |
| 401 - Courthouse | - | - | R+63.1 | 374 |
| 402 - WINDSOR (0001,0000) | R+34.2 | 1,994 | - | - |
| 402 - Windsor | - | - | R+60.8 | 765 |
| 403 - CEDAR GROVE | R+31.5 | 1,448 | - | - |
| 403 - Longview | - | - | R+39.6 | 674 |
| 501 - WALTERS | R+52.3 | 954 | - | - |
| 501 - Walters | - | - | R+68.2 | 633 |
| 502 - BEAVER DAM | R+21.7 | 1,086 | - | - |
| 503 - Carrsville | - | - | R+45.2 | 456 |
| 503 - FIRE TOWER | R+48.7 | 1,460 | - | - |
| 504 - BETHANY CHURCH | R+50.8 | 1,108 | - | - |
| 504 - Zuni | - | - | R+65.0 | 682 |
| 505 - Raynor | - | - | R+79.0 | 343 |
Accomack County: 32 precincts
| Precinct | 2024 President | 2020 President | ||
|---|---|---|---|---|
| Margin | Votes | Margin | Votes | |
| 101 - CHINCOTEAGUE (0000,0490) | R+28.6 | 2,199 | - | - |
| 101 - Chincoteague | - | - | R+63.8 | 1,321 |
| 201 - ATLANTIC | R+44.9 | 762 | - | - |
| 201 - Atlantic | - | - | R+65.3 | 531 |
| 202 - GREENBACKVILLE | R+40.4 | 1,343 | - | - |
| 202 - Greenbackville | - | - | R+66.4 | 876 |
| 301 - NEW CHURCH | D+8.5 | 1,617 | - | - |
| 301 - New Church | - | - | R+22.6 | 729 |
| 401 - BLOXOM (0000,1162,0198) | R+42.4 | 691 | - | - |
| 401 - Bloxom | - | - | R+56.2 | 395 |
| 402 - PARKSLEY (0000,1860) | R+30.6 | 764 | - | - |
| 402 - Parksley | - | - | R+56.3 | 501 |
| 403 - SAXIS (2209,0000) | R+59.5 | 220 | - | - |
| 403 - Saxis | - | - | R+63.4 | 186 |
| 501 - MAPPSVILLE | D+16.2 | 704 | - | - |
| 501 - Mappsville | - | - | R+5.9 | 286 |
| 502 - RUE | D+48.8 | 592 | - | - |
| 502 - Rue | - | - | D+8.6 | 185 |
| 601 - ACCOMAC (0000,0020) | R+16.9 | 1,485 | - | - |
| 601 - Accomac | - | - | R+52.0 | 494 |
| 602 - TANGIER (0000,2410) | R+77.5 | 227 | - | - |
| 602 - Tangier | - | - | R+79.2 | 236 |
| 701 - NANDUA (1830,0000,1835) | R+6.0 | 2,170 | - | - |
| 701 - Nandua | - | - | R+58.0 | 650 |
| 801 - BOBTOWN (1367,0000) | R+29.8 | 721 | - | - |
| 801 - Bobtown | - | - | R+51.3 | 302 |
| 802 - MELFA (1586,0000) | D+4.6 | 889 | - | - |
| 802 - Melfa | - | - | R+35.1 | 439 |
| 803 - WACHAPREAGUE (2550,0000) | R+37.0 | 594 | - | - |
| 803 - Wachapreague | - | - | R+62.9 | 350 |
| 901 - PAINTER (0140,1851,0000) | D+17.8 | 1,939 | - | - |
| 901 - Painter | - | - | R+12.0 | 803 |
Southampton County: 15 precincts
| Precinct | 2024 President | 2020 President | ||
|---|---|---|---|---|
| Margin | Votes | Margin | Votes | |
| 101 - BERLIN | R+64.9 | 846 | - | - |
| 101 - Berlin | - | - | R+69.0 | 494 |
| 102 - IVOR (0000,1330) | R+28.8 | 1,001 | - | - |
| 102 - Ivor | - | - | R+35.5 | 631 |
| 501 - DARDEN MILL | R+35.7 | 835 | - | - |
| 501 - Hunterdale | - | - | R+61.2 | 484 |
| 502 - FAIRGROUNDS | R+44.8 | 958 | - | - |
| 502 - Forks-of-the-river | - | - | R+34.5 | 264 |
| 601 - COURTLAND (0650C,0650B,0650A,0000) | R+12.5 | 1,087 | - | - |
| 601 - Courtland | - | - | R+38.6 | 438 |
| 602 - SEDLEY | R+68.4 | 253 | - | - |
| 602 - Sedley | - | - | R+73.8 | 309 |
| 701 - BLACKWATER RIVER | R+4.3 | 968 | - | - |
| 701 - Blackwater River | - | - | D+12.0 | 292 |
| 702 - Newsoms (part) | - | - | R+48.6 | 477 |
Northampton County: 10 precincts
| Precinct | 2024 President | 2020 President | ||
|---|---|---|---|---|
| Margin | Votes | Margin | Votes | |
| 101 - PRECINCT 1-1 (0000,0400) | R+1.9 | 1,758 | - | - |
| 101 - Precinct 1-1 | - | - | R+40.8 | 557 |
| 201 - PRECINCT 2-1 (0001,0000) | D+19.0 | 1,264 | - | - |
| 201 - Precinct 2-1 | - | - | D+8.9 | 405 |
| 301 - PRECINCT 3-1 (0000,1691) | D+25.6 | 1,152 | - | - |
| 301 - Precinct 3-1 | - | - | D+2.3 | 385 |
| 401 - PRECINCT 4-1 (0000,0001) | D+1.2 | 1,449 | - | - |
| 401 - Precinct 4-1 | - | - | R+40.4 | 369 |
| 501 - PRECINCT 5-1 (0002,0001,0000) | R+8.1 | 1,144 | - | - |
| 501 - Precinct 5-1 | - | - | R+30.1 | 512 |
Franklin city: 12 precincts
| Precinct | 2024 President | 2020 President | ||
|---|---|---|---|---|
| Margin | Votes | Margin | Votes | |
| 101 - PRECINCT 1-1 | R+25.3 | 893 | - | - |
| 101 - Precinct 1-1 | - | - | R+52.7 | 406 |
| 201 - PRECINCT 2-1 | R+8.1 | 815 | - | - |
| 201 - Precinct 2-1 | - | - | R+18.6 | 366 |
| 301 - PRECINCT 3-1 | D+75.4 | 505 | - | - |
| 301 - Precinct 3-1 | - | - | D+74.3 | 218 |
| 401 - PRECINCT 4-1 | D+56.9 | 497 | - | - |
| 401 - Precinct 4-1 | - | - | D+61.4 | 197 |
| 501 - PRECINCT 5-1 | D+83.3 | 461 | - | - |
| 501 - Precinct 5-1 | - | - | D+92.7 | 177 |
| 601 - PRECINCT 6-1 | D+17.5 | 635 | - | - |
| 601 - Precinct 6-1 | - | - | R+7.0 | 298 |
2024 President (Kamala D. Harris vs. Donald J. Trump). Source: Virginia Department of Elections, official election results (Enhanced Voting media export, by locality and precinct). Official, Virginia Department of Elections ENR media export (created 2025-03-05, after State Board certification Dec 2 2024).
2020 President (Joseph Robinette Biden, Jr vs. Donald J. Trump). Source: Virginia Department of Elections, Historical Elections Database (historical.elections.virginia.gov). Certified, Virginia Department of Elections Historical Elections Database (official certified results by locality and precinct; State Board of Elections certification).
Precinct demographics
Demographics are Census American Community Survey (ACS) 2020-2024 5-year estimates for block groups, assigned to precincts by area share. They describe the resident population, not registered or likely voters, and include non-citizens. ACS margins of error are not shown; small precincts carry large error. Area weighting assumes people are spread evenly within each block group, so large rural precincts are the least reliable. Median income is a household-weighted average of block-group medians, an approximation.
| Area | Population | Voting-age pop. | % White non-Hisp. | % Hispanic | % Black | % Asian | Median income* | % Bachelor's+ | % 18-29 (of adults) | % 65+ | % Homeowners | % Below poverty | % Spanish at home (adults) |
|---|---|---|---|---|---|---|---|---|---|---|---|---|---|
| District | 750,859 | 581,878 | 57.8% | 7.9% | 22.7% | 5.3% | $100k | 37.8% | 18.5% | 16.4% | 70.4% | 8.6% | 4.2% |
| Virginia Beach city (in district) | 419,901 | 326,630 | 57.2% | 9.3% | 19.2% | 7.4% | $98k | 39.7% | 20.3% | 15.6% | 65.7% | 8.7% | 4.7% |
| Chesapeake city (in district) | 130,105 | 99,156 | 66.0% | 6.8% | 16.2% | 4.8% | $125k | 43.8% | 16.2% | 14.5% | 84.1% | 5.4% | 3.1% |
| Suffolk city (in district) | 98,356 | 75,120 | 45.8% | 5.3% | 41.5% | 1.8% | $101k | 33.4% | 18.3% | 15.3% | 70.9% | 9.3% | 3.4% |
| Isle of Wight County (in district) | 39,960 | 31,458 | 68.7% | 4.1% | 21.4% | 1.3% | $99k | 30.8% | 14.8% | 20.1% | 80.2% | 6.8% | 2.5% |
| Accomack County (in district) | 33,297 | 26,474 | 58.1% | 10.9% | 27.1% | 0.7% | $63k | 21.7% | 14.9% | 25.7% | 71.4% | 13.9% | 7.2% |
| Northampton County (in district) | 12,017 | 9,811 | 55.8% | 9.3% | 29.7% | 1.0% | $76k | 31.9% | 12.4% | 29.3% | 66.1% | 17.7% | 6.0% |
| Southampton County (in district) | 9,271 | 7,428 | 65.4% | 0.3% | 27.1% | 1.3% | $75k | 22.8% | 13.7% | 24.2% | 75.9% | 9.5% | 0.6% |
| Franklin city (in district) | 7,951 | 5,801 | 38.1% | 3.1% | 54.5% | 0.0% | $60k | 27.4% | 18.3% | 18.8% | 54.0% | 19.6% | 1.3% |
Virginia Beach city: 115 precincts
| Precinct | Population | Voting-age pop. | % White non-Hisp. | % Hispanic | % Black | % Asian | Median income* | % Bachelor's+ | % 18-29 (of adults) | % 65+ | % Homeowners | % Below poverty | % Spanish at home (adults) |
|---|---|---|---|---|---|---|---|---|---|---|---|---|---|
| Alanton | 4,123 | 3,296 | 79.7% | 8.1% | 3.7% | 4.4% | $121k | 59.1% | 3.6% | 31.7% | 81.6% | 6.2% | 1.8% |
| Aragona | 7,038 | 5,527 | 56.8% | 9.3% | 17.9% | 8.9% | $79k | 23.8% | 18.2% | 13.3% | 61.4% | 7.1% | 5.2% |
| Arrowhead | 3,780 | 3,281 | 74.0% | 10.5% | 4.8% | 4.3% | $81k | 26.1% | 17.8% | 23.4% | 77.3% | 3.7% | 5.8% |
| Avalon | 5,541 | 4,661 | 56.6% | 9.3% | 17.1% | 9.1% | $75k | 33.0% | 17.1% | 23.0% | 60.8% | 10.3% | 5.3% |
| Baker | 8,053 | 5,448 | 19.3% | 14.3% | 57.8% | 3.1% | $50k | 19.1% | 33.8% | 7.9% | 26.3% | 26.8% | 3.8% |
| Bayside | 4,738 | 3,798 | 61.6% | 13.1% | 18.8% | 4.2% | $84k | 31.7% | 16.2% | 17.7% | 60.7% | 5.6% | 6.8% |
| Bellamy | 5,171 | 3,990 | 52.0% | 7.4% | 18.3% | 10.0% | $71k | 26.5% | 27.4% | 8.6% | 57.1% | 12.0% | 5.4% |
| Blackwater | 1,185 | 859 | 81.1% | 5.3% | 7.9% | 0.6% | $135k | 31.3% | 7.9% | 16.2% | 87.2% | 13.6% | 0.0% |
| Bonney | 6,003 | 4,719 | 39.6% | 27.0% | 17.7% | 5.2% | $67k | 25.4% | 23.9% | 12.6% | 41.4% | 19.5% | 13.5% |
| Brandon | 4,974 | 3,709 | 44.6% | 9.8% | 33.0% | 3.4% | $98k | 42.5% | 24.2% | 12.0% | 61.9% | 3.1% | 5.9% |
| Brookwood | 5,539 | 4,204 | 52.8% | 13.0% | 23.5% | 4.9% | $81k | 25.6% | 27.7% | 11.5% | 55.8% | 17.7% | 6.7% |
| Buckner | 6,319 | 4,827 | 38.1% | 13.2% | 21.0% | 15.6% | $73k | 34.3% | 16.0% | 16.4% | 61.3% | 8.8% | 7.3% |
| Cape Henry (part) | 611 | 478 | 85.5% | 5.3% | 1.6% | 1.6% | $141k | 69.5% | 12.4% | 28.2% | 76.0% | 4.1% | 2.6% |
| Capps Shop | 1,938 | 1,380 | 91.1% | 6.7% | 0.0% | 0.4% | $112k | 30.6% | 6.5% | 18.7% | 82.7% | 13.1% | 1.4% |
| Centerville | 4,269 | 3,338 | 60.7% | 4.5% | 14.0% | 11.6% | $119k | 40.8% | 18.4% | 16.7% | 85.7% | 2.9% | 2.5% |
| Chesapeake Beach (part) | 826 | 609 | 74.1% | 6.7% | 12.3% | 0.8% | $76k | 43.5% | 35.9% | 5.4% | 24.4% | 7.7% | 4.0% |
| Chimney Hill | 3,785 | 2,824 | 46.2% | 5.6% | 28.4% | 6.6% | $81k | 24.9% | 26.7% | 9.4% | 58.6% | 10.1% | 7.1% |
| College Park | 5,936 | 4,516 | 38.0% | 10.5% | 41.6% | 7.2% | $79k | 39.9% | 21.4% | 16.4% | 44.2% | 17.8% | 4.9% |
| Colonial | 5,603 | 4,053 | 37.4% | 10.5% | 26.4% | 17.7% | $123k | 43.1% | 17.6% | 10.5% | 65.6% | 2.8% | 1.7% |
| Colony | 4,519 | 3,671 | 85.4% | 3.4% | 5.4% | 1.2% | $137k | 68.0% | 23.2% | 23.8% | 61.0% | 6.9% | 1.7% |
| Corporate Landing | 5,834 | 4,413 | 65.5% | 7.8% | 15.2% | 3.4% | $99k | 34.4% | 27.1% | 10.7% | 60.1% | 6.8% | 5.4% |
| Courthouse | 4,486 | 3,435 | 78.1% | 4.7% | 5.2% | 9.5% | $153k | 55.3% | 10.4% | 21.6% | 94.2% | 5.5% | 2.1% |
| Creeds | 1,863 | 1,337 | 85.6% | 2.6% | 7.1% | 0.4% | $112k | 30.4% | 8.5% | 18.8% | 87.1% | 6.0% | 0.6% |
| Cromwell | 3,872 | 3,163 | 54.3% | 8.6% | 15.9% | 10.0% | $106k | 36.7% | 19.8% | 15.6% | 90.6% | 3.7% | 2.4% |
| Culve (part) | 2,820 | 2,331 | 65.7% | 12.1% | 14.1% | 2.9% | $143k | 45.6% | 24.2% | 12.7% | 89.8% | 4.9% | 7.3% |
| Dahlia | 4,855 | 3,965 | 47.0% | 8.9% | 22.7% | 14.3% | $68k | 32.0% | 26.4% | 11.6% | 58.8% | 6.1% | 7.9% |
| Dam Neck | 3,395 | 2,687 | 64.7% | 11.2% | 11.5% | 4.3% | $126k | 44.0% | 26.4% | 8.6% | 76.3% | 11.1% | 10.3% |
| Davis Corner | 5,413 | 4,210 | 28.4% | 14.9% | 48.4% | 5.5% | $63k | 25.0% | 25.0% | 11.7% | 48.0% | 18.7% | 5.7% |
| Eastern Shore | 3,477 | 2,799 | 63.8% | 7.4% | 20.8% | 3.6% | $81k | 42.0% | 48.4% | 5.8% | 29.3% | 4.9% | 6.2% |
| Edge gap (no precinct polygon) | 292 | 237 | 78.6% | 6.6% | 5.0% | 1.8% | $75k | 23.7% | 13.3% | 25.7% | 72.9% | 2.3% | 4.3% |
| Edge gap (no precinct polygon) | 1,465 | 1,434 | 95.2% | 1.6% | 1.0% | 0.7% | $89k | 70.3% | 5.3% | 71.8% | 38.3% | 4.7% | 0.3% |
| Edinburgh | 1,499 | 1,249 | 80.5% | 1.3% | 9.9% | 4.9% | $113k | 40.1% | 12.8% | 23.6% | 88.8% | 1.3% | 0.1% |
| Edwin | 2,950 | 2,501 | 74.0% | 5.6% | 10.1% | 4.2% | $122k | 43.1% | 11.5% | 26.0% | 87.8% | 4.5% | 4.6% |
| Fairfield | 3,734 | 3,078 | 58.6% | 7.9% | 17.0% | 11.4% | $107k | 44.6% | 19.3% | 21.9% | 73.4% | 4.4% | 3.3% |
| Foxfire | 5,347 | 3,944 | 71.3% | 14.2% | 1.8% | 5.9% | $138k | 48.8% | 10.7% | 21.4% | 87.0% | 5.7% | 4.5% |
| Glenwood | 5,208 | 3,827 | 38.3% | 11.2% | 16.6% | 27.1% | $119k | 49.2% | 13.4% | 15.2% | 90.2% | 4.9% | 4.0% |
| Great Neck | 4,525 | 3,313 | 85.4% | 0.4% | 0.3% | 7.5% | $180k | 65.8% | 7.4% | 21.0% | 93.4% | 2.4% | 1.1% |
| Green Run | 4,156 | 2,976 | 41.4% | 12.3% | 20.9% | 15.6% | $113k | 37.6% | 16.0% | 9.5% | 77.2% | 3.3% | 7.3% |
| Haygood | 5,094 | 4,282 | 62.2% | 4.7% | 19.0% | 11.7% | $101k | 54.4% | 12.1% | 27.6% | 83.9% | 9.2% | 5.3% |
| Hillcrest | 3,577 | 2,753 | 58.6% | 4.0% | 13.4% | 19.9% | $162k | 58.8% | 17.9% | 13.4% | 98.8% | 1.1% | 0.8% |
| Hilltop | 3,838 | 3,015 | 54.5% | 5.2% | 21.0% | 4.0% | $70k | 27.7% | 16.9% | 17.3% | 45.7% | 11.3% | 1.9% |
| Holland | 5,897 | 4,318 | 40.8% | 10.9% | 39.9% | 3.7% | $98k | 16.1% | 23.9% | 6.4% | 61.9% | 17.5% | 7.3% |
| Homestead | 5,313 | 4,275 | 52.3% | 7.9% | 18.1% | 12.8% | $98k | 34.9% | 19.4% | 17.4% | 85.0% | 5.4% | 3.1% |
| Hunt | 3,899 | 2,939 | 73.0% | 5.2% | 9.1% | 8.7% | $123k | 48.9% | 11.4% | 15.5% | 96.2% | 0.8% | 4.0% |
| Independence | 4,083 | 3,441 | 56.1% | 7.4% | 26.0% | 2.3% | $67k | 37.2% | 36.6% | 11.9% | 46.6% | 13.3% | 3.8% |
| Indian Lakes | 4,170 | 3,082 | 45.2% | 14.1% | 18.2% | 11.6% | $120k | 44.4% | 14.8% | 18.2% | 87.2% | 3.1% | 2.1% |
| Indian River | 5,030 | 3,819 | 52.7% | 11.2% | 18.0% | 10.1% | $108k | 25.7% | 19.5% | 10.2% | 86.0% | 4.4% | 2.4% |
| Kings Grant | 5,170 | 3,848 | 83.2% | 10.2% | 2.1% | 2.6% | $160k | 59.4% | 8.9% | 23.1% | 83.3% | 3.1% | 8.2% |
| Kingston | 2,696 | 2,047 | 83.2% | 5.3% | 3.0% | 6.5% | $130k | 69.9% | 13.9% | 19.6% | 90.0% | 1.1% | 0.4% |
| Lake Christopher | 4,622 | 3,411 | 49.4% | 8.7% | 19.2% | 17.4% | $116k | 40.5% | 14.0% | 18.9% | 80.7% | 5.1% | 4.5% |
| Lake Joyce (part) | 2,204 | 1,766 | 89.4% | 1.8% | 2.6% | 1.2% | $114k | 51.8% | 15.4% | 19.0% | 60.5% | 7.1% | 1.5% |
| Lake Smith | 2,501 | 1,986 | 84.8% | 3.0% | 8.1% | 3.0% | $116k | 38.5% | 21.7% | 21.6% | 72.5% | 2.9% | 3.7% |
| Landstown | 4,346 | 3,353 | 64.2% | 6.9% | 10.4% | 10.7% | $143k | 54.2% | 17.5% | 11.6% | 91.7% | 2.9% | 3.2% |
| Larkspur | 4,039 | 3,104 | 64.2% | 14.7% | 14.4% | 1.5% | $90k | 37.8% | 21.1% | 16.2% | 68.7% | 4.9% | 8.4% |
| Lexington | 4,726 | 3,780 | 52.3% | 9.0% | 20.3% | 4.8% | $75k | 33.6% | 20.9% | 18.8% | 73.0% | 6.9% | 4.6% |
| Linkhorn | 5,102 | 4,314 | 77.8% | 4.2% | 5.3% | 3.8% | $97k | 47.8% | 28.2% | 15.4% | 49.7% | 8.2% | 3.2% |
| Little Neck | 2,405 | 1,930 | 87.5% | 2.3% | 6.0% | 2.1% | $153k | 62.4% | 14.9% | 24.5% | 79.9% | 1.9% | 0.9% |
| London Bridge | 5,416 | 4,429 | 62.4% | 8.5% | 14.8% | 2.3% | $77k | 32.2% | 21.5% | 14.3% | 60.4% | 15.3% | 5.5% |
| Lynnhaven (part) | 424 | 390 | 89.1% | 4.2% | 3.2% | 1.1% | $114k | 69.4% | 10.6% | 43.3% | 67.0% | 5.4% | 0.7% |
| Magic Hollow | 5,623 | 4,749 | 39.8% | 10.0% | 26.8% | 10.5% | $83k | 31.2% | 26.8% | 11.3% | 55.6% | 13.1% | 5.2% |
| Malibu | 4,187 | 3,195 | 70.1% | 5.1% | 17.0% | 1.6% | $78k | 38.7% | 15.0% | 17.1% | 64.8% | 11.9% | 3.2% |
| Manor | 3,332 | 2,718 | 58.7% | 15.4% | 9.8% | 8.4% | $110k | 39.4% | 16.2% | 19.0% | 92.5% | 2.7% | 10.4% |
| Mt. Trashmore | 6,542 | 5,111 | 63.6% | 7.4% | 19.3% | 3.6% | $96k | 32.6% | 23.8% | 15.3% | 64.9% | 7.0% | 4.2% |
| Newtown | 6,463 | 4,604 | 18.9% | 13.7% | 55.8% | 3.1% | $51k | 26.2% | 26.6% | 7.3% | 39.0% | 25.8% | 8.8% |
| No electorate (water or unpopulated land) | 102 | 76 | 32.9% | 12.6% | 39.2% | 7.5% | $57k | 28.8% | 19.7% | 13.8% | 46.8% | 22.8% | 6.2% |
| No electorate (water or unpopulated land) | 13 | 12 | 62.7% | 8.7% | 10.1% | 12.9% | $92k | 34.4% | 11.6% | 27.3% | 76.8% | 5.7% | 5.1% |
| No electorate (water or unpopulated land) | 8 | 7 | 61.7% | 12.6% | 11.6% | 6.8% | $80k | 34.2% | 9.3% | 34.6% | 71.6% | 6.6% | 9.1% |
| No electorate (water or unpopulated land) | 60 | 42 | 28.2% | 8.4% | 52.1% | 2.9% | $45k | 16.4% | 50.4% | 9.1% | 39.8% | 32.6% | 0.9% |
| No electorate (water or unpopulated land) | 47 | 33 | 28.2% | 8.5% | 52.1% | 2.9% | $45k | 16.4% | 50.3% | 9.1% | 39.8% | 32.6% | 0.9% |
| No electorate (water or unpopulated land) | 14 | 12 | 27.0% | 28.9% | 37.4% | 1.9% | $39k | 12.7% | 11.7% | 24.0% | 37.2% | 30.6% | 8.7% |
| No electorate (water or unpopulated land) | 47 | 34 | 40.8% | 27.2% | 23.2% | 1.4% | $61k | 31.4% | 61.6% | 0.7% | 5.1% | 4.0% | 22.7% |
| No electorate (water or unpopulated land) | 5 | 3 | 40.5% | 27.7% | 22.9% | 1.3% | $60k | 30.6% | 63.0% | 0.0% | 2.1% | 4.1% | 23.4% |
| No electorate (water or unpopulated land) | 19 | 14 | 40.8% | 27.7% | 22.7% | 1.4% | $61k | 31.2% | 62.6% | 0.1% | 2.3% | 4.0% | 23.3% |
| No electorate (water or unpopulated land) | 122 | 92 | 75.1% | 5.2% | 13.3% | 1.6% | $75k | 46.4% | 45.0% | 5.1% | 34.5% | 7.4% | 1.1% |
| No electorate (water or unpopulated land) | 41 | 22 | 62.4% | 20.1% | 7.4% | 3.3% | $59k | 30.1% | 42.9% | 0.0% | 0.0% | 9.9% | 7.7% |
| No electorate (water or unpopulated land) | 17 | 15 | 81.5% | 3.9% | 5.3% | 3.9% | $75k | 62.6% | 14.9% | 28.3% | 38.5% | 8.7% | 1.4% |
| No electorate (water or unpopulated land) | 4 | 3 | 49.7% | 4.2% | 21.2% | 21.2% | $160k | 54.0% | 13.7% | 8.8% | 95.9% | 7.9% | 2.3% |
| North Beach (part) | 1,682 | 1,473 | 86.5% | 3.2% | 4.4% | 1.9% | $133k | 68.3% | 17.2% | 25.4% | 57.0% | 7.8% | 1.7% |
| North Landing | 4,200 | 3,422 | 61.2% | 5.8% | 18.9% | 9.1% | $115k | 38.6% | 24.4% | 10.5% | 78.0% | 3.8% | 3.7% |
| Ocean Lakes | 4,098 | 3,016 | 52.3% | 1.9% | 37.1% | 1.0% | $104k | 52.6% | 24.4% | 6.4% | 79.2% | 1.0% | 0.8% |
| Ocean Park (part) | 445 | 389 | 85.2% | 6.0% | 1.2% | 2.7% | $117k | 57.5% | 13.5% | 19.6% | 67.8% | 4.9% | 3.4% |
| Oceana | 4,060 | 3,479 | 50.3% | 11.1% | 25.6% | 2.4% | $61k | 26.8% | 32.4% | 10.0% | 22.0% | 13.7% | 5.6% |
| Old Donation | 4,398 | 3,209 | 63.2% | 9.5% | 16.2% | 2.8% | $78k | 21.4% | 24.2% | 10.7% | 51.1% | 5.8% | 3.0% |
| Pembroke | 6,251 | 4,969 | 62.6% | 6.6% | 20.8% | 3.8% | $96k | 48.9% | 20.1% | 15.3% | 44.1% | 10.5% | 2.3% |
| Pinewood | 2,254 | 1,889 | 60.1% | 9.1% | 21.5% | 1.6% | $66k | 37.0% | 17.7% | 20.2% | 36.7% | 9.1% | 7.7% |
| Plaza | 5,294 | 4,144 | 50.7% | 10.6% | 24.4% | 2.8% | $73k | 22.0% | 22.2% | 16.8% | 66.8% | 15.5% | 5.6% |
| Pleasant Hall | 4,871 | 3,620 | 33.6% | 6.2% | 44.9% | 12.2% | $69k | 25.5% | 17.1% | 15.1% | 70.8% | 24.0% | 4.3% |
| Point O' View | 3,315 | 2,792 | 66.1% | 4.0% | 17.7% | 6.3% | $80k | 35.1% | 16.4% | 26.5% | 66.4% | 7.2% | 2.8% |
| Red Wing (part) | 3,204 | 2,587 | 64.3% | 15.1% | 13.2% | 2.7% | $106k | 40.8% | 39.4% | 16.9% | 56.2% | 11.4% | 8.4% |
| Rock Lake | 5,662 | 4,239 | 31.5% | 14.9% | 34.3% | 15.5% | $113k | 25.3% | 15.0% | 11.5% | 81.1% | 4.4% | 8.2% |
| Rosemont Forest | 3,277 | 2,555 | 48.2% | 11.8% | 19.0% | 14.4% | $105k | 42.3% | 11.6% | 16.6% | 88.1% | 6.5% | 7.5% |
| Round Hill | 2,833 | 2,090 | 52.4% | 8.5% | 21.5% | 9.6% | $111k | 28.5% | 16.7% | 13.0% | 88.7% | 4.6% | 4.2% |
| Rudee (part) | 633 | 522 | 85.6% | 1.8% | 1.0% | 9.5% | $108k | 52.7% | 10.2% | 22.4% | 80.3% | 6.5% | 0.2% |
| Salem Woods | 5,491 | 4,001 | 35.0% | 8.1% | 19.8% | 25.0% | $117k | 47.7% | 18.2% | 9.9% | 68.6% | 3.4% | 4.3% |
| Sandbridge (part) | 560 | 440 | 91.0% | 7.4% | 0.3% | 0.9% | $127k | 50.4% | 12.7% | 23.1% | 81.1% | 5.9% | 6.0% |
| Seatack | 6,409 | 5,340 | 50.3% | 20.2% | 21.8% | 1.2% | $78k | 48.4% | 32.5% | 10.4% | 36.2% | 11.9% | 6.2% |
| Shannon | 3,381 | 2,608 | 65.0% | 9.4% | 5.6% | 8.7% | $91k | 46.5% | 17.8% | 22.6% | 72.4% | 9.4% | 2.6% |
| Shelburne | 3,702 | 2,749 | 70.5% | 4.0% | 10.0% | 13.0% | $136k | 52.4% | 17.9% | 10.8% | 93.7% | 2.8% | 2.2% |
| Shell | 3,206 | 2,491 | 35.2% | 11.1% | 35.5% | 11.4% | $70k | 25.8% | 30.1% | 12.8% | 54.8% | 5.0% | 5.8% |
| Shelton Park | 3,883 | 3,162 | 58.1% | 12.5% | 20.4% | 5.7% | $77k | 32.5% | 36.1% | 11.4% | 48.1% | 9.0% | 9.2% |
| Sherry Park | 3,254 | 2,800 | 40.4% | 9.3% | 23.6% | 21.6% | $72k | 38.8% | 17.2% | 19.3% | 46.5% | 15.1% | 2.0% |
| Sigma | 6,401 | 4,709 | 79.3% | 5.7% | 3.0% | 5.8% | $159k | 54.8% | 12.7% | 17.3% | 90.5% | 4.4% | 3.2% |
| South Beach (part) | 972 | 818 | 64.8% | 10.8% | 10.9% | 6.2% | $92k | 47.0% | 25.6% | 8.7% | 37.8% | 14.1% | 4.4% |
| Stratford Chase | 4,280 | 3,406 | 63.2% | 10.1% | 12.2% | 7.1% | $118k | 41.3% | 16.4% | 13.4% | 73.3% | 5.1% | 8.0% |
| Strawbridge | 5,256 | 3,881 | 61.6% | 16.4% | 4.3% | 4.7% | $119k | 39.3% | 15.5% | 11.8% | 92.1% | 2.2% | 7.8% |
| Tallwood | 5,942 | 4,865 | 43.7% | 10.2% | 29.6% | 11.7% | $76k | 46.3% | 36.3% | 9.8% | 58.0% | 11.5% | 4.2% |
| Thalia | 3,323 | 2,706 | 75.5% | 7.5% | 7.7% | 5.5% | $91k | 40.1% | 12.2% | 22.9% | 80.3% | 7.6% | 2.9% |
| Thoroughgood | 5,157 | 3,903 | 74.6% | 3.9% | 5.8% | 7.7% | $150k | 63.8% | 9.0% | 19.2% | 89.4% | 2.8% | 1.7% |
| Timberlake | 6,536 | 4,934 | 39.4% | 12.3% | 31.4% | 9.3% | $86k | 24.3% | 26.1% | 9.8% | 57.4% | 14.0% | 5.4% |
| Trantwood | 4,249 | 3,170 | 88.2% | 2.8% | 2.5% | 2.6% | $131k | 60.4% | 13.9% | 21.0% | 85.4% | 3.6% | 5.2% |
| Upton | 5,332 | 4,040 | 70.8% | 4.2% | 12.6% | 5.4% | $116k | 41.3% | 16.7% | 13.2% | 81.7% | 10.4% | 0.5% |
| Village | 4,246 | 2,987 | 41.7% | 14.2% | 28.0% | 3.4% | $59k | 34.4% | 31.7% | 9.7% | 18.6% | 25.8% | 4.0% |
| Windsor Oaks | 6,150 | 4,854 | 46.5% | 14.7% | 25.2% | 4.3% | $83k | 27.4% | 20.4% | 16.1% | 69.7% | 9.3% | 6.3% |
| Witchduck | 4,798 | 3,954 | 79.9% | 4.6% | 5.4% | 6.9% | $120k | 49.1% | 8.8% | 36.0% | 74.1% | 5.8% | 2.6% |
| Wolfsnare | 4,552 | 3,308 | 71.0% | 4.9% | 14.9% | 5.3% | $103k | 48.4% | 9.3% | 21.1% | 64.9% | 6.3% | 2.4% |
Chesapeake city: 33 precincts
| Precinct | Population | Voting-age pop. | % White non-Hisp. | % Hispanic | % Black | % Asian | Median income* | % Bachelor's+ | % 18-29 (of adults) | % 65+ | % Homeowners | % Below poverty | % Spanish at home (adults) |
|---|---|---|---|---|---|---|---|---|---|---|---|---|---|
| Bells Mill | 7,074 | 4,900 | 78.8% | 7.3% | 7.3% | 2.3% | $151k | 51.9% | 17.0% | 9.4% | 83.6% | 4.4% | 5.5% |
| Bells Mill II | 2,838 | 1,967 | 63.3% | 8.9% | 12.9% | 9.3% | $128k | 41.8% | 17.6% | 8.9% | 92.0% | 7.4% | 4.3% |
| Bethel | 4,324 | 3,269 | 83.0% | 9.4% | 3.9% | 0.8% | $115k | 22.4% | 20.3% | 17.2% | 82.5% | 3.2% | 1.6% |
| Bridgetown | 5,273 | 3,969 | 78.9% | 4.4% | 10.8% | 3.7% | $154k | 52.9% | 17.2% | 17.3% | 98.2% | 2.9% | 3.5% |
| Centerville | 4,316 | 3,353 | 75.7% | 8.8% | 7.1% | 4.0% | $169k | 50.2% | 14.2% | 16.9% | 94.7% | 4.2% | 3.1% |
| Clearfield | 2,932 | 2,205 | 56.1% | 7.9% | 17.0% | 14.6% | $111k | 46.0% | 19.5% | 14.0% | 82.0% | 3.8% | 3.3% |
| Cooper's Way | 6,023 | 4,133 | 81.6% | 5.5% | 2.5% | 5.2% | $158k | 52.8% | 12.9% | 10.1% | 90.4% | 6.0% | 2.6% |
| Deep Creek | 1,092 | 824 | 62.1% | 6.9% | 16.4% | 7.2% | $111k | 33.2% | 12.9% | 13.1% | 91.4% | 4.3% | 7.5% |
| Deep Creek II | 7,185 | 4,969 | 57.3% | 14.7% | 20.2% | 1.7% | $113k | 50.4% | 13.7% | 9.9% | 91.7% | 3.9% | 7.6% |
| Fairways | 3,512 | 3,063 | 58.5% | 3.5% | 28.7% | 4.2% | $89k | 46.7% | 11.3% | 27.1% | 82.6% | 5.2% | 0.9% |
| Fentress | 3,786 | 2,949 | 81.8% | 7.5% | 3.8% | 2.6% | $130k | 42.6% | 15.4% | 17.8% | 96.7% | 3.7% | 0.4% |
| Grassfield | 5,313 | 4,158 | 63.8% | 7.3% | 15.6% | 4.7% | $108k | 41.5% | 18.3% | 20.0% | 86.1% | 5.6% | 4.5% |
| Great Bridge | 3,942 | 3,585 | 61.5% | 7.5% | 13.7% | 4.2% | $111k | 28.3% | 16.3% | 13.9% | 90.8% | 10.8% | 2.8% |
| Great Bridge Baptist Church | 3,520 | 2,881 | 65.6% | 5.0% | 17.8% | 4.8% | $106k | 38.0% | 20.6% | 12.3% | 54.3% | 8.5% | 2.3% |
| Green Tree | 3,248 | 2,538 | 36.3% | 12.0% | 30.1% | 11.8% | $73k | 38.9% | 11.1% | 18.0% | 39.3% | 8.4% | 7.9% |
| Greenbrier | 3,734 | 3,228 | 53.1% | 10.9% | 16.3% | 5.8% | $98k | 42.0% | 14.9% | 21.0% | 91.0% | 7.4% | 1.7% |
| Hickory Grove | 3,968 | 2,980 | 83.4% | 3.3% | 7.9% | 2.6% | $132k | 46.1% | 12.3% | 13.1% | 90.2% | 7.1% | 0.8% |
| Hickory Middle School | 7,145 | 5,109 | 84.8% | 3.5% | 4.9% | 2.8% | $170k | 56.0% | 18.1% | 12.7% | 91.4% | 4.8% | 1.8% |
| Indian Creek | 4,472 | 3,892 | 58.2% | 4.1% | 29.0% | 1.3% | $136k | 18.4% | 15.8% | 9.8% | 96.1% | 2.5% | 1.3% |
| John T. West | 6,942 | 5,072 | 60.5% | 6.5% | 19.8% | 3.6% | $148k | 44.2% | 16.7% | 12.8% | 90.1% | 2.1% | 4.8% |
| Lake Drummond | 3,730 | 2,697 | 47.9% | 4.9% | 35.2% | 3.2% | $94k | 41.1% | 17.9% | 13.0% | 80.2% | 6.8% | 0.7% |
| Oak Grove | 4,597 | 4,035 | 44.7% | 8.7% | 36.8% | 1.9% | $90k | 36.7% | 26.5% | 15.8% | 51.5% | 12.7% | 3.1% |
| Parker Rd | 2,844 | 2,069 | 67.4% | 3.7% | 12.7% | 8.1% | $146k | 54.2% | 16.4% | 13.1% | 81.1% | 5.3% | 2.3% |
| Parkways | 1,778 | 1,339 | 53.3% | 15.9% | 21.3% | 5.8% | $91k | 46.3% | 14.1% | 18.4% | 70.4% | 11.9% | 13.5% |
| Pleasant Crossing | 3,116 | 2,523 | 90.0% | 3.9% | 1.9% | 2.6% | $128k | 35.1% | 9.3% | 21.9% | 93.5% | 4.3% | 0.5% |
| Poplar Branch | 2,607 | 1,839 | 87.2% | 3.8% | 3.3% | 1.3% | $143k | 44.1% | 9.8% | 17.4% | 97.2% | 5.1% | 0.9% |
| Pughsville (part) | 183 | 139 | 26.5% | 7.3% | 61.8% | 1.3% | $96k | 31.8% | 12.8% | 13.0% | 66.9% | 7.0% | 0.9% |
| River Walk | 3,589 | 2,968 | 55.1% | 4.1% | 34.1% | 0.8% | $111k | 47.8% | 25.4% | 13.4% | 84.4% | 8.6% | 1.0% |
| Shipyard Road | 4,169 | 2,804 | 51.1% | 6.2% | 30.8% | 4.7% | $135k | 55.1% | 14.7% | 7.0% | 94.1% | 1.8% | 1.2% |
| Sunray I | 1,388 | 911 | 71.7% | 3.1% | 22.3% | 0.0% | $136k | 37.5% | 13.2% | 11.7% | 89.3% | 5.4% | 2.7% |
| Sunray II | 2,190 | 1,589 | 47.3% | 4.4% | 38.9% | 4.3% | $94k | 29.7% | 19.6% | 13.1% | 87.8% | 13.1% | 5.4% |
| Waterway | 5,045 | 3,850 | 51.7% | 6.2% | 19.0% | 18.0% | $148k | 51.5% | 17.2% | 12.4% | 86.0% | 4.6% | 2.4% |
| Waterway II | 4,227 | 3,348 | 69.9% | 6.1% | 3.8% | 13.9% | $122k | 49.1% | 9.7% | 23.5% | 86.7% | 0.6% | 3.1% |
Suffolk city: 30 precincts
| Precinct | Population | Voting-age pop. | % White non-Hisp. | % Hispanic | % Black | % Asian | Median income* | % Bachelor's+ | % 18-29 (of adults) | % 65+ | % Homeowners | % Below poverty | % Spanish at home (adults) |
|---|---|---|---|---|---|---|---|---|---|---|---|---|---|
| AIRPORT | 2,470 | 1,979 | 51.4% | 2.8% | 41.3% | 0.2% | $91k | 18.3% | 18.1% | 20.8% | 65.8% | 14.2% | 1.4% |
| BELLEHARBOUR | 1,802 | 1,460 | 35.1% | 13.7% | 39.1% | 5.2% | $60k | 34.6% | 24.1% | 21.6% | 33.6% | 15.1% | 4.7% |
| BENNETTS CREEK | 3,162 | 2,424 | 51.3% | 7.3% | 32.7% | 3.3% | $121k | 50.5% | 16.0% | 17.1% | 65.5% | 2.4% | 3.6% |
| BOOKER T WASHINGTON | 3,951 | 2,940 | 3.1% | 5.7% | 90.0% | 0.0% | $49k | 12.4% | 19.7% | 13.5% | 59.7% | 13.7% | 1.6% |
| BURBAGE GRANT | 5,697 | 4,182 | 38.5% | 4.6% | 41.2% | 5.2% | $126k | 48.3% | 22.5% | 7.3% | 78.4% | 7.2% | 5.4% |
| CHUCKATUCK | 2,377 | 1,819 | 66.1% | 4.9% | 24.6% | 1.1% | $119k | 39.0% | 5.1% | 22.8% | 88.0% | 13.9% | 0.9% |
| DEERFIELD | 3,139 | 2,486 | 39.5% | 4.5% | 46.7% | 3.6% | $146k | 42.6% | 19.9% | 10.5% | 81.1% | 5.2% | 4.2% |
| DRIVER | 4,991 | 3,744 | 78.0% | 6.6% | 9.7% | 2.9% | $117k | 34.3% | 11.0% | 21.0% | 86.9% | 4.1% | 4.8% |
| EBENEZER | 2,284 | 1,908 | 71.8% | 2.8% | 18.2% | 1.3% | $164k | 48.4% | 9.2% | 29.6% | 95.6% | 1.9% | 1.8% |
| ELEPHANTS FORK | 1,793 | 1,492 | 50.8% | 4.6% | 42.3% | 0.2% | $73k | 25.1% | 19.2% | 16.7% | 33.5% | 3.7% | 2.6% |
| HARBOURVIEW | 3,360 | 2,666 | 58.1% | 4.2% | 23.3% | 3.9% | $149k | 64.6% | 12.8% | 22.4% | 84.5% | 3.4% | 3.4% |
| HILLPOINT | 5,226 | 3,847 | 55.8% | 5.4% | 32.9% | 1.8% | $124k | 31.7% | 19.5% | 9.8% | 81.2% | 4.8% | 2.8% |
| HOLLAND | 2,624 | 2,144 | 69.8% | 4.2% | 23.5% | 0.0% | $83k | 21.9% | 13.7% | 23.1% | 78.1% | 3.7% | 3.0% |
| HOLLYWOOD | 2,179 | 1,574 | 7.7% | 1.5% | 84.5% | 0.0% | $52k | 9.8% | 29.8% | 9.4% | 38.2% | 15.4% | 0.4% |
| HUNTERSVILLE | 3,922 | 2,989 | 25.5% | 11.8% | 50.9% | 2.5% | $83k | 36.9% | 35.2% | 4.5% | 32.2% | 12.9% | 11.9% |
| JOHN F KENNEDY | 4,172 | 3,104 | 13.6% | 1.2% | 76.9% | 0.1% | $68k | 14.9% | 21.9% | 13.3% | 71.4% | 19.9% | 0.3% |
| KILBYS MILL | 5,036 | 3,992 | 56.0% | 8.4% | 26.3% | 1.8% | $101k | 34.7% | 12.9% | 18.4% | 77.9% | 4.3% | 4.5% |
| KINGS FORK | 5,217 | 3,970 | 37.6% | 2.1% | 51.8% | 0.9% | $115k | 30.1% | 23.1% | 14.7% | 76.8% | 5.4% | 0.6% |
| LAKE COHOON | 4,300 | 3,445 | 74.4% | 1.6% | 18.6% | 0.9% | $106k | 32.3% | 13.0% | 22.5% | 85.3% | 7.0% | 1.9% |
| LAKESIDE | 3,839 | 3,045 | 51.9% | 4.3% | 35.3% | 2.9% | $67k | 33.2% | 18.8% | 16.6% | 45.6% | 23.9% | 0.7% |
| MACK BENN JR. | 1,184 | 904 | 27.4% | 30.2% | 30.4% | 7.7% | $56k | 20.2% | 11.3% | 13.3% | 68.2% | 26.7% | 20.5% |
| NANSEMOND RIVER | 4,908 | 3,569 | 45.8% | 5.4% | 42.3% | 1.0% | $125k | 50.5% | 18.6% | 11.7% | 85.0% | 6.8% | 2.9% |
| OLDE TOWNE | 1,188 | 979 | 51.6% | 4.3% | 41.8% | 0.1% | $66k | 13.1% | 15.0% | 15.9% | 50.8% | 15.0% | 0.3% |
| PITTMANTOWN | 2,413 | 1,896 | 68.6% | 1.4% | 26.2% | 0.0% | $83k | 26.0% | 19.6% | 20.8% | 84.9% | 13.9% | 0.5% |
| PUGHSVILLE | 2,878 | 2,224 | 31.5% | 11.0% | 46.9% | 3.1% | $68k | 33.0% | 23.9% | 15.2% | 49.3% | 11.1% | 4.6% |
| SHOULDERS HILL | 3,207 | 2,375 | 39.7% | 4.9% | 48.3% | 0.5% | $123k | 42.0% | 18.6% | 8.2% | 91.3% | 3.0% | 2.4% |
| SOUTHSIDE | 3,411 | 2,325 | 4.6% | 1.1% | 91.2% | 0.2% | $67k | 13.1% | 18.0% | 9.1% | 35.6% | 24.7% | 3.5% |
| WHALEYVILLE | 2,465 | 1,989 | 80.4% | 3.5% | 9.1% | 2.8% | $99k | 22.1% | 20.4% | 21.9% | 95.2% | 5.5% | 7.5% |
| WHITE MARSH | 1,360 | 883 | 55.5% | 1.2% | 35.9% | 0.4% | $101k | 20.2% | 15.6% | 16.4% | 90.2% | 1.6% | 0.8% |
| WILROY | 3,800 | 2,766 | 43.1% | 6.2% | 47.8% | 1.6% | $85k | 41.2% | 14.5% | 11.1% | 87.9% | 6.8% | 2.3% |
Isle of Wight County: 17 precincts
| Precinct | Population | Voting-age pop. | % White non-Hisp. | % Hispanic | % Black | % Asian | Median income* | % Bachelor's+ | % 18-29 (of adults) | % 65+ | % Homeowners | % Below poverty | % Spanish at home (adults) |
|---|---|---|---|---|---|---|---|---|---|---|---|---|---|
| Bartlett | 2,765 | 1,924 | 68.2% | 12.1% | 13.4% | 3.1% | $131k | 41.0% | 11.9% | 16.1% | 91.0% | 3.4% | 7.8% |
| Beaver Dam | 2,201 | 1,820 | 55.8% | 0.1% | 42.9% | 0.0% | $84k | 22.5% | 12.9% | 27.9% | 64.4% | 6.0% | 0.1% |
| Benns Church | 2,419 | 1,831 | 55.6% | 1.0% | 37.8% | 1.2% | $106k | 27.9% | 12.4% | 18.8% | 94.6% | 5.9% | 0.4% |
| Bethany Church | 1,853 | 1,532 | 70.8% | 1.4% | 22.6% | 0.4% | $88k | 28.1% | 11.2% | 22.2% | 82.2% | 4.6% | 1.1% |
| Bowling Green | 2,466 | 2,081 | 78.6% | 1.4% | 14.3% | 1.5% | $93k | 19.6% | 11.8% | 22.2% | 84.9% | 11.0% | 1.0% |
| Cedar Grove | 1,867 | 1,443 | 75.7% | 0.6% | 19.7% | 2.0% | $124k | 37.0% | 13.9% | 16.0% | 92.9% | 5.9% | 1.2% |
| Cypress Creek A | 2,714 | 2,072 | 71.0% | 1.2% | 21.9% | 0.2% | $124k | 38.5% | 10.9% | 16.7% | 91.8% | 4.3% | 0.6% |
| Cypress Creek B | 1,208 | 942 | 76.6% | 2.3% | 15.4% | 0.1% | $153k | 35.4% | 14.4% | 13.0% | 89.9% | 3.2% | 0.8% |
| Fire Tower | 2,887 | 2,062 | 79.0% | 0.5% | 11.5% | 0.9% | $78k | 18.4% | 11.7% | 22.3% | 84.2% | 5.3% | 1.0% |
| New Towne | 486 | 371 | 72.0% | 2.3% | 18.8% | 3.4% | $112k | 39.7% | 16.3% | 15.3% | 76.7% | 5.3% | 0.8% |
| Nike Park A | 4,422 | 3,441 | 58.3% | 14.7% | 18.7% | 3.1% | $103k | 45.8% | 17.8% | 16.5% | 54.1% | 10.7% | 7.5% |
| Nike Park B | 882 | 746 | 75.2% | 4.7% | 14.8% | 2.6% | $139k | 24.7% | 21.3% | 9.3% | 79.5% | 4.1% | 0.1% |
| Pagan River | 4,557 | 3,876 | 74.4% | 1.4% | 17.9% | 0.0% | $106k | 38.8% | 19.7% | 25.2% | 84.8% | 2.9% | 0.3% |
| Pons | 3,663 | 2,855 | 57.8% | 3.2% | 35.5% | 0.4% | $72k | 23.2% | 18.8% | 18.7% | 78.7% | 10.3% | 3.5% |
| Rushmere | 1,349 | 1,129 | 68.0% | 2.1% | 26.9% | 0.0% | $83k | 30.9% | 13.1% | 21.3% | 77.6% | 7.1% | 1.7% |
| Walters | 1,097 | 969 | 83.1% | 0.0% | 11.3% | 0.7% | $81k | 21.2% | 7.9% | 36.4% | 81.6% | 8.2% | 0.0% |
| Windsor | 3,124 | 2,364 | 72.7% | 7.2% | 12.8% | 2.3% | $71k | 20.3% | 16.7% | 19.1% | 79.7% | 10.4% | 5.5% |
Accomack County: 16 precincts
| Precinct | Population | Voting-age pop. | % White non-Hisp. | % Hispanic | % Black | % Asian | Median income* | % Bachelor's+ | % 18-29 (of adults) | % 65+ | % Homeowners | % Below poverty | % Spanish at home (adults) |
|---|---|---|---|---|---|---|---|---|---|---|---|---|---|
| Accomac | 2,954 | 2,144 | 51.5% | 18.7% | 26.8% | 0.4% | $52k | 15.8% | 14.1% | 28.0% | 64.2% | 23.6% | 12.3% |
| Atlantic | 1,254 | 1,005 | 53.7% | 9.7% | 29.6% | 2.5% | $84k | 16.9% | 7.9% | 17.5% | 79.5% | 16.0% | 7.3% |
| Bloxom | 1,453 | 1,148 | 57.9% | 14.2% | 20.9% | 0.5% | $62k | 9.8% | 16.9% | 18.0% | 78.9% | 10.3% | 11.4% |
| Bobtown | 1,219 | 1,060 | 66.6% | 10.6% | 19.4% | 2.3% | $64k | 31.2% | 11.4% | 44.4% | 83.2% | 7.2% | 5.0% |
| Chincoteague | 3,388 | 2,922 | 95.6% | 1.5% | 0.4% | 0.0% | $63k | 37.1% | 11.5% | 37.2% | 78.3% | 10.2% | 0.3% |
| Greenbackville | 2,012 | 1,711 | 95.4% | 1.2% | 1.7% | 0.0% | $94k | 34.3% | 1.3% | 33.3% | 95.8% | 8.0% | 0.3% |
| Mappsville | 1,718 | 1,294 | 54.2% | 4.5% | 27.9% | 2.2% | $79k | 19.7% | 6.3% | 23.8% | 79.6% | 11.8% | 3.8% |
| Melfa | 1,447 | 1,019 | 58.0% | 7.8% | 28.6% | 0.9% | $51k | 22.4% | 21.6% | 18.8% | 56.4% | 13.4% | 5.4% |
| Nandua | 4,343 | 3,384 | 53.3% | 16.3% | 26.8% | 0.5% | $62k | 26.1% | 19.3% | 25.1% | 68.0% | 12.7% | 10.3% |
| New Church | 3,498 | 3,032 | 50.2% | 7.6% | 38.9% | 2.0% | $56k | 8.0% | 20.8% | 20.3% | 58.2% | 27.1% | 5.0% |
| Painter | 3,219 | 2,522 | 48.0% | 10.4% | 39.0% | 0.3% | $62k | 26.5% | 14.7% | 25.8% | 76.7% | 9.1% | 5.3% |
| Parksley | 1,761 | 1,338 | 57.1% | 12.1% | 29.3% | 0.1% | $64k | 21.3% | 25.8% | 16.1% | 62.1% | 12.5% | 4.8% |
| Rue | 2,312 | 1,691 | 30.7% | 26.5% | 40.4% | 0.1% | $52k | 10.3% | 9.9% | 21.5% | 52.1% | 15.8% | 24.8% |
| Saxis | 227 | 209 | 77.5% | 0.8% | 11.5% | 0.0% | $28k | 6.7% | 21.1% | 31.6% | 94.8% | 32.0% | 0.1% |
| Tangier | 247 | 247 | 100.0% | 0.0% | 0.0% | 0.0% | $36k | 2.4% | 9.9% | 52.4% | 95.7% | 2.0% | 0.0% |
| Wachapreague | 2,246 | 1,749 | 35.7% | 10.5% | 50.2% | 0.2% | $56k | 19.4% | 19.7% | 21.7% | 73.8% | 7.4% | 8.3% |
Northampton County: 5 precincts
| Precinct | Population | Voting-age pop. | % White non-Hisp. | % Hispanic | % Black | % Asian | Median income* | % Bachelor's+ | % 18-29 (of adults) | % 65+ | % Homeowners | % Below poverty | % Spanish at home (adults) |
|---|---|---|---|---|---|---|---|---|---|---|---|---|---|
| Precinct 1-1 | 3,231 | 2,895 | 71.9% | 5.1% | 19.8% | 0.2% | $77k | 36.6% | 15.0% | 35.3% | 67.3% | 12.0% | 1.6% |
| Precinct 2-1 | 1,663 | 1,343 | 42.5% | 6.4% | 46.4% | 0.0% | $52k | 14.3% | 15.5% | 24.8% | 57.4% | 23.9% | 4.3% |
| Precinct 3-1 | 2,105 | 1,613 | 44.3% | 15.8% | 31.1% | 5.1% | $65k | 27.4% | 7.4% | 24.2% | 54.0% | 26.6% | 11.6% |
| Precinct 4-1 | 3,152 | 2,492 | 51.3% | 11.9% | 32.7% | 0.1% | $96k | 38.7% | 11.0% | 27.4% | 75.5% | 17.4% | 8.9% |
| Precinct 5-1 | 1,866 | 1,469 | 60.8% | 7.6% | 25.2% | 0.2% | $73k | 32.3% | 12.1% | 32.0% | 70.3% | 13.1% | 4.9% |
Southampton County: 7 precincts
| Precinct | Population | Voting-age pop. | % White non-Hisp. | % Hispanic | % Black | % Asian | Median income* | % Bachelor's+ | % 18-29 (of adults) | % 65+ | % Homeowners | % Below poverty | % Spanish at home (adults) |
|---|---|---|---|---|---|---|---|---|---|---|---|---|---|
| Berlin | 1,419 | 1,175 | 76.2% | 0.7% | 15.8% | 0.9% | $76k | 23.0% | 17.2% | 27.7% | 78.5% | 7.4% | 0.7% |
| Blackwater River | 1,842 | 1,504 | 48.9% | 0.3% | 46.4% | 0.6% | $64k | 15.7% | 7.7% | 23.6% | 68.5% | 12.8% | 0.2% |
| Courtland | 2,615 | 1,966 | 58.8% | 0.2% | 35.5% | 1.7% | $72k | 28.1% | 17.7% | 21.6% | 70.0% | 9.8% | 0.9% |
| Darden Mill | 865 | 688 | 78.8% | 0.3% | 9.5% | 1.6% | $90k | 24.2% | 11.7% | 23.8% | 88.6% | 5.2% | 0.7% |
| Fairgrounds | 1,143 | 916 | 78.5% | 0.3% | 9.3% | 2.6% | $105k | 25.6% | 12.4% | 22.5% | 89.8% | 4.4% | 0.7% |
| Ivor | 1,204 | 1,024 | 68.2% | 0.0% | 24.0% | 1.0% | $64k | 20.4% | 13.1% | 27.7% | 75.7% | 14.5% | 0.1% |
| Sedley | 184 | 154 | 75.8% | 2.2% | 16.3% | 0.0% | $63k | 19.3% | 16.7% | 30.0% | 71.7% | 6.0% | 1.8% |
Franklin city: 6 precincts
| Precinct | Population | Voting-age pop. | % White non-Hisp. | % Hispanic | % Black | % Asian | Median income* | % Bachelor's+ | % 18-29 (of adults) | % 65+ | % Homeowners | % Below poverty | % Spanish at home (adults) |
|---|---|---|---|---|---|---|---|---|---|---|---|---|---|
| Precicnt 3-1 | 1,836 | 1,294 | 9.5% | 4.9% | 84.5% | 0.0% | $52k | 16.2% | 28.9% | 9.5% | 31.5% | 15.6% | 0.7% |
| Precinct 1-1 | 983 | 891 | 78.5% | 0.1% | 11.5% | 0.0% | $89k | 31.0% | 4.0% | 37.9% | 90.7% | 2.3% | 0.1% |
| Precinct 2-1 | 1,389 | 1,086 | 69.0% | 5.3% | 21.2% | 0.0% | $79k | 37.0% | 16.8% | 22.7% | 69.8% | 9.4% | 2.6% |
| Precinct 4-1 | 729 | 492 | 13.6% | 3.5% | 77.5% | 0.0% | $45k | 15.2% | 24.3% | 10.2% | 59.1% | 23.6% | 2.3% |
| Precinct 5-1 | 1,467 | 881 | 1.4% | 0.1% | 96.0% | 0.2% | $24k | 11.8% | 17.9% | 19.0% | 29.3% | 56.3% | 0.2% |
| Precinct 6-1 | 1,547 | 1,157 | 64.9% | 3.7% | 25.9% | 0.0% | $73k | 44.8% | 16.4% | 18.0% | 61.5% | 6.3% | 2.2% |
*Median income is approximate (see note above). ACS 2020-2024 5-year.
Nonpartisan voter information. GOTV Polling does not endorse any candidate.