
Virginia's 3rd Congressional District
U.S. House · Virginia · District 3 · General election: Tuesday, November 3, 2026
Candidates on the November 3 ballot
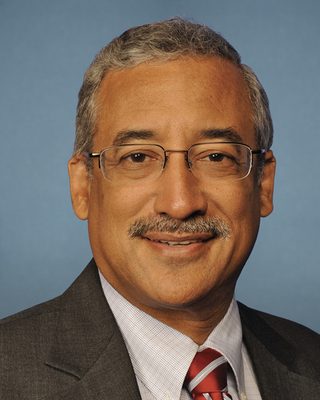 Robert C. "Bobby" ScottDemocraticIncumbentPhoto: U.S. Congress
 Edwin Rivera, Jr.RepublicanPhoto: edwinriveraforcongress.com
- Makiba A. GainesIndependent
- Stephen C. WollIndependent
Source: Virginia Department of Elections, candidate list, November 3, 2026 General Election, federal offices, certified list (list retrieved 2026-10-30; retrieved 2026-10-30). Order of names does not reflect ballot order. Incumbent tags appear only where the official list marks incumbents. Photos come from the Candidate Alerts database where one is on file; otherwise initials are shown.
Federal campaign finance filings for this seat: FEC election page (FEC registration is not the same as ballot qualification).
Certified candidates
- Robert C. "Bobby" Scott DemocraticIncumbent @BobbyScott Website
- Makiba Gaines IDP
- Stephen C. Woll Independent
- Edwin Rivera Jr. Republican Website
Certified candidate list from Candidate Alerts, as of 2026-09-24, based on Virginia Department of Elections. Includes candidates the database marks as on the November 3 ballot. Incumbent tags here follow the database.
Past election results
| Candidate | Party | Votes | Share |
|---|---|---|---|
| Robert C. "Bobby" Scott | Democratic | 219,926 | 70.0% |
| John Sitka, III | Republican | 93,801 | 29.8% |
| Write-In | 670 | 0.2% | |
| Total | 314,397 |
Source: Virginia Department of Elections, official election results (Enhanced Voting media export, by locality and precinct). Status: Official, Virginia Department of Elections ENR media export (created 2025-03-05, after State Board certification Dec 2 2024)
| Candidate | Party | Votes | Share |
|---|---|---|---|
| Robert C. "Bobby" Scott | Democratic | 139,659 | 67.2% |
| Terry T. Namkung | Republican | 67,668 | 32.6% |
| Write In | Wri | 523 | 0.3% |
| Total | 207,850 |
Source: Virginia Department of Elections, official results site (results.elections.virginia.gov), results by precinct JSON. Status: Official results (all reporting stages 'Certified'), Virginia Department of Elections official results site
Held under the district lines in effect at the time. Those boundaries differ from the 2026 district.
| Candidate | Party | Votes | Share |
|---|---|---|---|
| Robert Cortez Scott | Democratic | 230,883 | 68.4% |
| John William Collick, Jr | Republican | 105,831 | 31.4% |
| Write-Ins | 733 | 0.2% | |
| Total | 337,447 |
Source: Virginia Department of Elections, Historical Elections Database (historical.elections.virginia.gov). Status: Certified, Virginia Department of Elections Historical Elections Database (official certified results by locality and precinct; State Board of Elections certification)
Certified results from state or county election authorities, as compiled in the Candidate Alerts precinct results database (public API candidatealerts.com/api/district-results). Totals are sums of certified precinct and county-level rows.
Demographics
2020 Census demographics by district are not yet published in this data set.
0 of 365 precincts are above 50%, and 0 are above 25%. Source: Census American Community Survey 2020-2024 5-year block groups, allocated to current precinct shapes by area. Area coverage is good for 54.5% of precincts; treat the rest as approximate.
Poll status
Map
Share of adults (18+) who speak Spanish at home, by precinct. Census ACS 2020-2024 5-year estimates on the current precinct layer. Hover a precinct for its value.
District shown in red: U.S. Census Bureau cartographic boundary file for the 119th Congress (cb_2024_us_cd119_500k). These are the lines in effect for 2026 in this state per the Candidate Alerts district registry.
Precinct map: past elections and demographics
Choose a layer above. Hover a precinct for its values.
Precinct results
Certified precinct results on current precinct shapes, grouped by county. 368 precincts. "(part)" marks a precinct only partly inside this district; its full vote is shown, so district sums are approximate and are not the official district total. Elections were held under older lines and are shown on the 2026 district.
| County | 2024 President | 2020 President | ||
|---|---|---|---|---|
| Margin | Votes | Margin | Votes | |
| Norfolk city | D+41.3 | 81,932 | D+21.4 | 30,953 |
| Newport News city | D+28.8 | 73,552 | D+5.7 | 32,179 |
| Hampton city | D+39.2 | 60,221 | D+8.5 | 20,185 |
| Chesapeake city | D+23.0 | 53,776 | R+3.7 | 15,735 |
| Portsmouth city | D+38.7 | 40,222 | D+12.9 | 19,912 |
| All counties (approx.) | D+34.4 | 309,703 | D+10.2 | 118,964 |
Norfolk city: 96 precincts
| Precinct | 2024 President | 2020 President | ||
|---|---|---|---|---|
| Margin | Votes | Margin | Votes | |
| 101 - GRANBY | D+40.2 | 2,458 | - | - |
| 101 - Granby | - | - | D+26.0 | 837 |
| 102 - OCEAN VIEW SCHOOL | D+9.0 | 1,087 | - | - |
| 102 - Ocean View School | - | - | R+22.2 | 472 |
| 103 - NORTHSIDE | D+12.5 | 1,635 | - | - |
| 103 - Northside | - | - | R+16.9 | 693 |
| 104 - TITUSTOWN | D+55.4 | 942 | - | - |
| 104 - Titustown | - | - | D+57.2 | 449 |
| 106 - SECOND PRESBYTERIAN | D+30.1 | 2,229 | - | - |
| 106 - Second Presbyterian | - | - | D+15.0 | 749 |
| 107 - WESLEY | D+25.9 | 1,469 | - | - |
| 201 - LARCHMONT SCHOOL | D+40.1 | 1,927 | - | - |
| 201 - Larchmont School | - | - | D+14.8 | 662 |
| 203 - GHENT SQUARE | D+54.4 | 1,135 | - | - |
| 203 - Ghent Square | - | - | D+10.7 | 308 |
| 207 - LAMBERT'S POINT | D+64.2 | 1,722 | - | - |
| 207 - Lambert's Point | - | - | D+60.2 | 694 |
| 208 - LARCHMONT LIBRARY | D+32.7 | 1,499 | - | - |
| 208 - Larchmont Library | - | - | R+19.9 | 341 |
| 210 - MAURY | D+53.0 | 1,889 | - | - |
| 210 - Maury | - | - | D+24.4 | 525 |
| 211 - CHRYSLER MUSEUM | D+47.2 | 2,915 | - | - |
| 211 - Chrysler Museum | - | - | D+15.4 | 662 |
| 212 - PARK PLACE | D+74.1 | 1,207 | - | - |
| 212 - Park Place | - | - | D+72.2 | 593 |
| 213 - TAYLOR ELEMENTARY SCHOOL | D+60.4 | 2,265 | - | - |
| 213 - Taylor Elementary School | - | - | D+35.7 | 709 |
| 214 - Stuart | - | - | D+17.6 | 592 |
| 214 - VIRGINIA ZOO | D+59.1 | 2,218 | - | - |
| 215 - SUBURBAN PARK | D+27.5 | 1,579 | - | - |
| 215 - Suburban Park | - | - | R+11.0 | 628 |
| 217 - Wesley | - | - | D+21.0 | 713 |
| 218 - WILLARD | D+29.7 | 2,822 | - | - |
| 218 - Willard | - | - | R+13.7 | 736 |
| 301 - BALLENTINE | D+67.4 | 1,581 | - | - |
| 301 - Ballentine | - | - | D+52.4 | 574 |
| 302 - TANNERS CREEK | D+54.2 | 1,058 | - | - |
| 302 - Tanners Creek | - | - | D+43.0 | 458 |
| 303 - BROAD CREEK | D+81.5 | 1,835 | - | - |
| 303 - Broad Creek | - | - | D+80.9 | 571 |
| 304 - COLEMAN PLACE SCHOOL | D+62.1 | 919 | - | - |
| 304 - Coleman Place School | - | - | D+50.9 | 426 |
| 305 - LAFAYETTE-WINONA | D+57.1 | 1,365 | - | - |
| 305 - Lafayette-winona | - | - | D+31.6 | 490 |
| 306 - LINDENWOOD | D+73.9 | 1,070 | - | - |
| 306 - Lindenwood | - | - | D+73.3 | 445 |
| 309 - NORVIEW | D+50.8 | 2,742 | - | - |
| 309 - Norview | - | - | D+38.1 | 1,052 |
| 310 - ROSEMONT | D+80.2 | 2,218 | - | - |
| 310 - Rosemont | - | - | D+74.3 | 861 |
| 311 - SHERWOOD | D+34.5 | 2,709 | - | - |
| 311 - Sherwood | - | - | D+13.7 | 1,224 |
| 313 - UNION CHAPEL | D+83.1 | 763 | - | - |
| 313 - Union Chapel | - | - | D+85.2 | 393 |
| 402 - BERKLEY | D+85.8 | 1,215 | - | - |
| 402 - Berkley | - | - | D+84.1 | 397 |
| 404 - CAMPOSTELLA | D+83.1 | 1,345 | - | - |
| 404 - Campostella | - | - | D+83.8 | 587 |
| 405 - CHESTERFIELD | D+83.9 | 1,344 | - | - |
| 405 - Chesterfield | - | - | D+81.2 | 580 |
| 406 - BARRON BLACK | D+18.7 | 1,285 | - | - |
| 406 - Barron Black | - | - | R+5.8 | 504 |
| 408 - CALVARY REVIVAL CHURCH | D+18.5 | 1,894 | - | - |
| 408 - Easton | - | - | R+9.5 | 733 |
| 409 - FAIRLAWN | D+25.1 | 1,379 | - | - |
| 409 - Fairlawn | - | - | R+7.9 | 572 |
| 411 - RUFFNER ACADEMY | D+83.8 | 661 | - | - |
| 411 - Ruffner Academy | - | - | D+86.1 | 411 |
| 412 - INGLESIDE | D+67.8 | 1,455 | - | - |
| 412 - Ingleside | - | - | D+57.3 | 560 |
| 413 - POPLAR HALLS | D+61.3 | 2,189 | - | - |
| 413 - Poplar Halls | - | - | D+48.9 | 654 |
| 414 - YOUNG PARK | D+83.0 | 1,249 | - | - |
| 414 - Young Park | - | - | D+84.7 | 616 |
| 415 - LAKE TAYLOR HIGH SCHOOL | D+29.4 | 1,522 | - | - |
| 415 - Lake Taylor High School | - | - | D+5.2 | 612 |
| 501 - BAYVIEW | D+10.4 | 2,133 | - | - |
| 501 - Bayview | - | - | R+21.8 | 859 |
| 503 - EAST OCEAN VIEW | D+11.9 | 2,738 | - | - |
| 503 - East Ocean View | - | - | R+15.2 | 853 |
| 504 - LARRYMORE | D+25.0 | 1,661 | - | - |
| 504 - Larrymore | - | - | D+0.9 | 650 |
| 505 - LITTLE CREEK | D+5.1 | 1,358 | - | - |
| 505 - Little Creek | - | - | R+20.4 | 683 |
| 506 - OCEAN VIEW GOLF COURSE | D+28.4 | 2,322 | - | - |
| 506 - Ocean View Center | - | - | D+4.9 | 852 |
| 507 - PRETLOW | D+17.9 | 1,822 | - | - |
| 507 - Pretlow | - | - | R+7.7 | 688 |
| 509 - TARRALLTON | R+9.5 | 1,935 | - | - |
| 509 - Tarrallton | - | - | R+37.2 | 890 |
| 510 - THIRD PRESBYTERIAN | R+3.4 | 2,073 | - | - |
| 510 - Third Presbyterian | - | - | R+25.1 | 1,009 |
| 511 - CROSSROADS | D+11.7 | 1,895 | - | - |
| 511 - Crossroads | - | - | R+1.4 | 901 |
| 512 - AZALEA GARDENS | D+15.8 | 1,199 | - | - |
| 512 - Azalea Gardens | - | - | R+14.0 | 485 |
Newport News city: 87 precincts
| Precinct | 2024 President | 2020 President | ||
|---|---|---|---|---|
| Margin | Votes | Margin | Votes | |
| 101 - DENBIGH | D+42.7 | 2,593 | - | - |
| 101 - Denbigh | - | - | D+23.5 | 1,145 |
| 102 - Epes | - | - | D+48.6 | 1,184 |
| 102 - STONEY RUN | D+55.0 | 2,593 | - | - |
| 103 - Jenkins | - | - | D+13.0 | 1,323 |
| 104 - MCINTOSH | D+45.3 | 1,736 | - | - |
| 104 - Mcintosh | - | - | D+26.7 | 816 |
| 105 - Oyster Point | - | - | D+6.0 | 251 |
| 106 - RESERVOIR | D+49.9 | 1,659 | - | - |
| 106 - Reservoir | - | - | D+23.3 | 1,307 |
| 107 - RICHNECK | D+33.4 | 3,140 | - | - |
| 107 - Richneck | - | - | R+6.7 | 1,109 |
| 108 - KATHERINE JOHNSON | D+34.2 | 831 | - | - |
| 108 - Lee Hall | - | - | D+27.4 | 946 |
| 109 - WINDSOR | D+29.2 | 1,416 | - | - |
| 109 - Windsor | - | - | R+3.4 | 732 |
| 110 - GREENWOOD | D+41.4 | 2,492 | - | - |
| 110 - Greenwood | - | - | D+24.7 | 986 |
| 111 - STONEYBROOK | D+34.5 | 2,647 | - | - |
| 112 - KNOLLWOOD MEADOWS | D+10.6 | 3,059 | - | - |
| 113 - SANFORD | R+4.0 | 1,053 | - | - |
| 201 - BLAND | D+40.5 | 521 | - | - |
| 201 - Bland | - | - | D+30.5 | 226 |
| 202 - BOULEVARD | D+1.1 | 1,752 | - | - |
| 202 - Boulevard | - | - | R+20.5 | 969 |
| 203 - CHARLES | D+2.3 | 3,110 | - | - |
| 203 - Charles | - | - | R+33.4 | 1,356 |
| 204 - MARINERS' MUSEUM | D+25.0 | 1,269 | - | - |
| 204 - Wellesley | - | - | R+2.4 | 553 |
| 205 - DEEP CREEK | R+9.5 | 2,425 | - | - |
| 205 - Deep Creek | - | - | R+45.6 | 1,136 |
| 208 - HIDENWOOD | R+4.7 | 1,465 | - | - |
| 208 - Hidenwood | - | - | R+44.9 | 697 |
| 209 - Hilton | - | - | R+25.8 | 838 |
| 210 - Nelson | - | - | R+25.6 | 1,455 |
| 211 - PALMER | D+32.6 | 2,293 | - | - |
| 211 - Palmer | - | - | D+7.4 | 938 |
| 212 - RIVERSIDE | R+2.2 | 1,198 | - | - |
| 212 - Riverside | - | - | R+31.6 | 665 |
| 213 - Sanford | - | - | R+46.5 | 531 |
| 215 - Warwick | - | - | R+2.0 | 542 |
| 216 - YATES | D+17.1 | 2,210 | - | - |
| 216 - Yates | - | - | R+36.4 | 560 |
| 217 - RIVERVIEW | R+1.1 | 2,038 | - | - |
| 217 - Riverview | - | - | R+38.0 | 789 |
| 218 - KILN CREEK | D+25.6 | 3,475 | - | - |
| 218 - Kiln Creek | - | - | R+18.6 | 1,050 |
| 219 - DEER PARK | D+44.4 | 2,793 | - | - |
| 219 - Deer Park | - | - | D+33.1 | 948 |
| 220 -JENKINS | D+23.2 | 2,418 | - | - |
| 302 - BRIARFIELD | D+49.2 | 1,342 | - | - |
| 302 - Briarfield | - | - | D+36.4 | 659 |
| 303 - CARVER | D+44.4 | 956 | - | - |
| 303 - Carver | - | - | D+27.9 | 480 |
| 304 - CHESTNUT | D+78.3 | 623 | - | - |
| 304 - Chestnut | - | - | D+85.9 | 333 |
| 305 - DOWNTOWN | D+51.7 | 447 | - | - |
| 305 - Downtown | - | - | D+36.7 | 196 |
| 307 - Huntington | - | - | D+91.7 | 301 |
| 308 - JEFFERSON | D+81.3 | 525 | - | - |
| 308 - Jefferson | - | - | D+88.1 | 293 |
| 309 - MAGRUDER | D+78.1 | 652 | - | - |
| 309 - Magruder | - | - | D+86.1 | 294 |
| 310 - MARSHALL | D+82.4 | 777 | - | - |
| 310 - Marshall | - | - | D+83.5 | 387 |
| 311 - NEWMARKET | D+47.3 | 1,939 | - | - |
| 311 - Newmarket | - | - | D+26.6 | 758 |
| 312 - NEWSOME PARK | D+86.4 | 434 | - | - |
| 312 - Newsome Park | - | - | D+91.0 | 189 |
| 313 - REED | D+85.3 | 1,253 | - | - |
| 313 - Reed | - | - | D+85.1 | 476 |
| 314 - RIVER | D+36.6 | 981 | - | - |
| 314 - River | - | - | R+1.7 | 461 |
| 315 - SEDGEFIELD | D+8.5 | 1,477 | - | - |
| 315 - Sedgefield | - | - | R+14.4 | 786 |
| 316 - SOUTH MORRISON | D+27.8 | 1,703 | - | - |
| 316 - South Morrison | - | - | D+18.5 | 675 |
| 317 - WASHINGTON | D+85.0 | 633 | - | - |
| 317 - Washington | - | - | D+89.3 | 168 |
| 318 - WILSON | D+74.6 | 705 | - | - |
| 318 - Wilson | - | - | D+75.3 | 328 |
| 319 - SAUNDERS | D+17.2 | 2,570 | - | - |
| 319 - Saunders | - | - | R+6.7 | 996 |
| 320 - WATKINS | D+4.8 | 3,324 | - | - |
| 320 - Watkins | - | - | R+21.3 | 1,347 |
| 321 - HILTON | D+17.6 | 1,887 | - | - |
| 322 - WARWICK | D+24.8 | 1,138 | - | - |
Hampton city: 60 precincts
| Precinct | 2024 President | 2020 President | ||
|---|---|---|---|---|
| Margin | Votes | Margin | Votes | |
| 101 - ABERDEEN | D+65.4 | 1,967 | - | - |
| 101 - Aberdeen | - | - | D+49.0 | 547 |
| 102 - BASSETTE | D+79.0 | 1,831 | - | - |
| 102 - Bassette | - | - | D+71.3 | 558 |
| 103 - CITY HALL | D+62.5 | 1,352 | - | - |
| 103 - City Hall | - | - | D+49.1 | 434 |
| 104 - COOPER | D+68.9 | 2,849 | - | - |
| 104 - Cooper | - | - | D+53.1 | 874 |
| 105 - EAST HAMPTON | D+40.2 | 1,161 | - | - |
| 105 - East Hampton | - | - | D+41.1 | 336 |
| 106 - ARMSTRONG | D+37.4 | 2,114 | - | - |
| 106 - Armstrong | - | - | D+9.2 | 662 |
| 107 - LINDSAY | D+64.6 | 1,858 | - | - |
| 107 - Lindsay | - | - | D+39.6 | 462 |
| 108 - THOMAS | D+64.2 | 2,278 | - | - |
| 108 - Thomas | - | - | D+61.4 | 621 |
| 109 - PHENIX | D+73.1 | 2,190 | - | - |
| 109 - Phenix | - | - | D+70.4 | 695 |
| 110 - PHOEBUS | D+22.3 | 537 | - | - |
| 110 - Phoebus | - | - | R+1.6 | 258 |
| 111 - HAMPTON LIBRARY | D+28.2 | 813 | - | - |
| 111 - Hampton Library | - | - | R+4.9 | 224 |
| 112 - SMITH | D+39.9 | 2,636 | - | - |
| 112 - Smith | - | - | D+13.7 | 853 |
| 115 - WYTHE | D+23.7 | 1,310 | - | - |
| 115 - Wythe | - | - | R+11.4 | 474 |
| 116 - JONES | D+47.9 | 1,029 | - | - |
| 116 - Jones | - | - | D+35.4 | 359 |
| 117 - KECOUGHTAN | D+47.6 | 1,752 | - | - |
| 117 - Kecoughtan | - | - | D+21.2 | 626 |
| 118 - MALLORY | D+73.1 | 2,230 | - | - |
| 118 - Mallory | - | - | D+57.3 | 637 |
| 201 - Booker | - | - | R+30.3 | 964 |
| 201 - PATRICK | D+8.0 | 2,352 | - | - |
| 202 - BRYAN | D+19.5 | 2,391 | - | - |
| 202 - Bryan | - | - | R+21.8 | 865 |
| 203 - BURBANK | D+24.8 | 1,743 | - | - |
| 203 - Burbank | - | - | R+0.2 | 653 |
| 204 - FORREST | D+36.0 | 1,820 | - | - |
| 204 - Forrest | - | - | D+9.8 | 650 |
| 205 - ASBURY (ASBURY) | R+10.0 | 3,363 | - | - |
| 205 - Asbury | - | - | R+48.7 | 1,486 |
| 208 - KRAFT | D+24.7 | 3,159 | - | - |
| 208 - Kraft | - | - | R+12.4 | 1,187 |
| 209 - LANGLEY | D+18.5 | 2,001 | - | - |
| 209 - Langley | - | - | R+12.2 | 823 |
| 210 - MACHEN | D+50.4 | 3,422 | - | - |
| 210 - Machen | - | - | D+23.2 | 907 |
| 212 - BETHEL | D+53.6 | 3,325 | - | - |
| 212 - Bethel | - | - | D+5.6 | 751 |
| 213 - PHILLIPS | D+8.3 | 3,126 | - | - |
| 213 - Phillips | - | - | R+34.1 | 1,200 |
| 214 - JACKSON | D+26.0 | 2,454 | - | - |
| 214 - Tucker Capps | - | - | D+2.8 | 917 |
| 215 - PEAKE | D+60.3 | 614 | - | - |
| 215 - Tyler | - | - | D+44.2 | 240 |
| 216 - SANDY BOTTOM | D+35.4 | 1,459 | - | - |
| 216 - Sandy Bottom | - | - | R+5.5 | 511 |
| 217 - SYMS | D+3.7 | 1,085 | - | - |
| 217 - Syms | - | - | R+28.5 | 411 |
Chesapeake city: 63 precincts
| Precinct | 2024 President | 2020 President | ||
|---|---|---|---|---|
| Margin | Votes | Margin | Votes | |
| 003 - CAMELOT | D+73.7 | 1,653 | - | - |
| 004 - CHURCHLAND | R+18.9 | 2,079 | - | - |
| 005 - CRESTWOOD | D+66.6 | 1,690 | - | - |
| 008 - SOUTH NORFOLK RECREATION | D+8.6 | 2,252 | - | - |
| 010 - OSCAR SMITH | D+7.0 | 1,017 | - | - |
| 011 - GENEVA PARK | R+10.9 | 1,501 | - | - |
| 012 - GEORGETOWN | D+69.7 | 1,658 | - | - |
| 013 - GILMERTON | R+2.3 | 1,836 | - | - |
| 015 - GREENBRIER MIDDLE SCHOOL | D+26.8 | 2,409 | - | - |
| 018 - INDIAN RIVER | D+27.7 | 1,597 | - | - |
| 019 - JOLLIFF | R+20.6 | 1,419 | - | - |
| 020 - E W CHITTUM | R+6.9 | 2,372 | - | - |
| 021 - FELLOWSHIP | D+5.5 | 2,350 | - | - |
| 022 - NORFOLK HIGHLANDS | R+14.2 | 1,335 | - | - |
| 024 - OAKLETTE | D+14.5 | 1,636 | - | - |
| 025 - ST JULIANS | D+31.5 | 1,629 | - | - |
| 026 - JOHNSON PARK | D+29.1 | 872 | - | - |
| 027 - SILVERWOOD | D+6.9 | 2,074 | - | - |
| 029 - TANGLEWOOD | R+21.3 | 1,704 | - | - |
| 030 - SOUTH NORFOLK | D+80.8 | 792 | - | - |
| 031 - CARVER SCHOOL | D+58.6 | 1,979 | - | - |
| 032 - PROVIDENCE | D+77.5 | 2,173 | - | - |
| 033 - WESTOVER | R+18.1 | 1,104 | - | - |
| 035 - TAYLOR ROAD | D+38.5 | 1,334 | - | - |
| 038 - BAILEY CREEK | R+31.4 | 1,916 | - | - |
| 044 - NANSEMOND | D+24.9 | 1,867 | - | - |
| 048 - JOLLIFF MIDDLE SCHOOL | D+69.6 | 2,498 | - | - |
| 054 - PUGHSVILLE (0001,0000) (part) | D+38.4 | 1,881 | - | - |
| 055 - GEORGETOWN EAST | D+56.9 | 1,346 | - | - |
| 057 - CYPRESS | D+23.8 | 1,917 | - | - |
| 058 - EXPRESSWAY | D+35.0 | 772 | - | - |
| 066 - FAIRWAYS II | D+20.0 | 1,114 | - | - |
| 10 - Oscar Smith | - | - | R+22.2 | 374 |
| 11 - Geneva Park | - | - | R+21.5 | 717 |
| 12 - Georgetown | - | - | D+40.4 | 275 |
| 13 - Gilmerton | - | - | R+31.7 | 751 |
| 15 - Greenbrier Middle School | - | - | R+5.5 | 622 |
| 18 - Indian River | - | - | D+7.9 | 496 |
| 19 - Jolliff | - | - | R+53.8 | 535 |
| 20 - E W Chittum | - | - | R+42.8 | 587 |
| 21 - Fellowship | - | - | R+36.8 | 636 |
| 22 - Norfolk Highlands | - | - | R+31.1 | 530 |
| 24 - Oaklette | - | - | R+2.5 | 635 |
| 25 - St Julians | - | - | R+3.8 | 529 |
| 26 - Johnson Park | - | - | D+11.4 | 376 |
| 27 - Silverwood | - | - | R+31.7 | 539 |
| 29 - Tanglewood | - | - | R+49.0 | 561 |
| 3 - Camelot | - | - | D+67.2 | 366 |
| 30 - South Norfolk | - | - | D+80.4 | 276 |
| 31 - Carver School | - | - | D+41.7 | 609 |
| 32 - Providence | - | - | D+77.8 | 667 |
| 33 - Westover | - | - | R+47.9 | 536 |
| 35 - Taylor Road | - | - | D+23.2 | 423 |
| 38 - Bailey Creek | - | - | R+60.4 | 505 |
| 4 - Churchland | - | - | R+58.8 | 498 |
| 44 - Nansemond | - | - | R+10.3 | 457 |
| 48 - Jolliff Middle School | - | - | D+59.9 | 588 |
| 5 - Crestwood | - | - | D+49.0 | 535 |
| 54 - Pughsville (part) | - | - | D+25.3 | 486 |
| 55 - Georgetown East | - | - | D+14.8 | 183 |
| 57 - Cypress | - | - | D+4.7 | 512 |
| 58 - Expressway | - | - | D+19.9 | 221 |
| 8 - South Norfolk Recreation | - | - | R+16.2 | 710 |
Portsmouth city: 62 precincts
| Precinct | 2024 President | 2020 President | ||
|---|---|---|---|---|
| Margin | Votes | Margin | Votes | |
| 001 - EMANUEL A. M. E. CHURCH | D+50.3 | 1,543 | - | - |
| 005 - CHARLES A. FISHER MEMORIAL ACADEMY | D+85.6 | 770 | - | - |
| 007- PARK VIEW ELEMENTARY SCHOOL | D+57.0 | 987 | - | - |
| 009 - THIRD BAPTIST CHURCH | D+63.0 | 1,314 | - | - |
| 010 - MOUNT HERMON PRESCHOOL CENTER | D+32.3 | 702 | - | - |
| 011 - JOSEPH E. PARKER RECREATION CENTER | D+87.2 | 901 | - | - |
| 013 - ST. MARK MISSIONARY BAPTIST CHURCH | D+86.5 | 535 | - | - |
| 014 - BRIGHTON ELEMENTARY SCHOOL | D+83.0 | 1,104 | - | - |
| 016 - CRADOCK MIDDLE SCHOOL | D+42.6 | 1,092 | - | - |
| 017 - VICTORY LIFE FELLOWSHIP | D+38.3 | 1,396 | - | - |
| 019 - VICTORY ELEMENTARY SCHOOL | D+13.5 | 696 | - | - |
| 020 - NOBLE STREET BAPTIST CHURCH | D+54.7 | 1,274 | - | - |
| 021 - HENDRICKS/KENDALL RECREATION CENTER | D+84.6 | 674 | - | - |
| 022 - ST. MARK DELIVERANCE CENTER | D+13.2 | 1,199 | - | - |
| 023 - WESTHAVEN BAPTIST CHURCH | R+14.1 | 1,210 | - | - |
| 024 - THE SENIOR STATION | D+35.0 | 982 | - | - |
| 025 - WATERVIEW ELEMENTARY SCHOOL | D+23.2 | 1,360 | - | - |
| 026 - WILLIAM E. WATERS MIDDLE SCHOOL | D+84.9 | 1,229 | - | - |
| 027 - CAVALIER MANOR RECREATION CENTER | D+85.3 | 1,126 | - | - |
| 028 - LAKEVIEW ELEMENTARY SCHOOL | D+89.6 | 1,762 | - | - |
| 029 - MANOR HIGH SCHOOL | R+25.5 | 897 | - | - |
| 030 - THE RESCUE CHURCH | R+25.8 | 1,183 | - | - |
| 031 - WEST PARK CHURCH OF CHRIST | D+27.6 | 1,747 | - | - |
| 032 - HODGES MANOR ELEMENTARY SCHOOL | R+4.2 | 1,107 | - | - |
| 033- PINECREST BAPTIST CHURCH | R+30.2 | 949 | - | - |
| 034- CHURCHLAND BRANCH LIBRARY | D+5.8 | 1,344 | - | - |
| 035 - CHURCHLAND ELEMENTARY SCHOOL | D+4.2 | 1,605 | - | - |
| 036 - CHURCHLAND HIGH SCHOOL | D+18.4 | 2,838 | - | - |
| 037 - CHURCHLAND MIDDLE SCHOOL | D+38.1 | 2,117 | - | - |
| 038 - GROVE BAPTIST CHURCH | D+65.9 | 2,047 | - | - |
| 039 - CHURCHLAND PRIMARY AND INTERMEDIATE SCHOOL | D+51.7 | 2,532 | - | - |
| 1 - Emanuel A. M. E. Church | - | - | D+22.9 | 624 |
| 10 - Port Norfolk Recreation Center | - | - | D+5.1 | 450 |
| 11 - Joseph E. Parker Recreation Center | - | - | D+92.0 | 535 |
| 13 - St. Mark Missionary Baptist Church | - | - | D+85.6 | 313 |
| 14 - Brighton Elementary School | - | - | D+87.3 | 463 |
| 16 - Cradock Middle School | - | - | D+26.7 | 678 |
| 17 - Victory Life Fellowship | - | - | D+18.2 | 710 |
| 19 - Victory Elementary School | - | - | R+8.6 | 454 |
| 20 - Noble Street Baptist Church | - | - | D+35.6 | 595 |
| 21 - John F. Kennedy Community Center | - | - | D+83.1 | 337 |
| 22 - St. Mark Deliverance Center | - | - | R+7.8 | 733 |
| 23 - Westhaven Baptist Church | - | - | R+44.9 | 815 |
| 24 - The Senior Station | - | - | D+8.1 | 447 |
| 25 - John Tyler Elementary School | - | - | R+10.9 | 678 |
| 26 - William E. Waters Middle School | - | - | D+90.0 | 510 |
| 27 - Cavalier Manor Recreation Center | - | - | D+86.1 | 495 |
| 28 - Lakeview Elementary School | - | - | D+88.4 | 571 |
| 29 - Woodrow Wilson High School | - | - | R+52.0 | 550 |
| 30 - The Rescue Church | - | - | R+49.9 | 859 |
| 31 - West Park Church Of Christ | - | - | D+2.3 | 1,109 |
| 32 - Hodges Manor Elementary School | - | - | R+47.5 | 566 |
| 33- Pinecrest Baptist Church | - | - | R+56.1 | 681 |
| 34- Churchland Branch Library | - | - | R+41.7 | 606 |
| 35 - Churchland Elementary School | - | - | R+29.6 | 822 |
| 36 - Churchland High School | - | - | R+21.4 | 1,206 |
| 37 - Churchland Middle School | - | - | D+12.4 | 965 |
| 38 - Grove Baptist Church | - | - | D+61.5 | 996 |
| 39 - Churchland Primary And Intermediate School | - | - | D+15.5 | 774 |
| 5 - Hampton Roads Community Health Center | - | - | D+87.3 | 400 |
| 7- Park View Elementary School | - | - | D+33.6 | 438 |
| 9 - Third Baptist Church | - | - | D+53.9 | 532 |
2024 President (Kamala D. Harris vs. Donald J. Trump). Source: Virginia Department of Elections, official election results (Enhanced Voting media export, by locality and precinct). Official, Virginia Department of Elections ENR media export (created 2025-03-05, after State Board certification Dec 2 2024).
2020 President (Joseph Robinette Biden, Jr vs. Donald J. Trump). Source: Virginia Department of Elections, Historical Elections Database (historical.elections.virginia.gov). Certified, Virginia Department of Elections Historical Elections Database (official certified results by locality and precinct; State Board of Elections certification).
Precinct demographics
Demographics are Census American Community Survey (ACS) 2020-2024 5-year estimates for block groups, assigned to precincts by area share. They describe the resident population, not registered or likely voters, and include non-citizens. ACS margins of error are not shown; small precincts carry large error. Area weighting assumes people are spread evenly within each block group, so large rural precincts are the least reliable. Median income is a household-weighted average of block-group medians, an approximation.
| Area | Population | Voting-age pop. | % White non-Hisp. | % Hispanic | % Black | % Asian | Median income* | % Bachelor's+ | % 18-29 (of adults) | % 65+ | % Homeowners | % Below poverty | % Spanish at home (adults) |
|---|---|---|---|---|---|---|---|---|---|---|---|---|---|
| District | 779,698 | 606,385 | 39.0% | 8.9% | 42.7% | 2.9% | $74k | 30.1% | 26.0% | 14.5% | 52.9% | 14.9% | 5.1% |
| Norfolk city (in district) | 235,022 | 187,223 | 41.2% | 10.1% | 38.9% | 3.6% | $74k | 33.5% | 31.1% | 13.0% | 46.2% | 16.5% | 6.0% |
| Newport News city (in district) | 184,783 | 141,892 | 39.3% | 10.8% | 40.6% | 3.3% | $73k | 30.6% | 25.6% | 14.1% | 48.2% | 14.5% | 5.9% |
| Hampton city (in district) | 138,191 | 108,452 | 35.3% | 6.9% | 48.0% | 2.3% | $75k | 28.5% | 23.6% | 16.7% | 56.9% | 12.7% | 3.9% |
| Chesapeake city (in district) | 125,059 | 94,426 | 41.2% | 8.6% | 41.2% | 2.8% | $82k | 29.4% | 21.5% | 14.7% | 64.7% | 13.5% | 5.3% |
| Portsmouth city (in district) | 96,643 | 74,392 | 35.2% | 5.4% | 50.3% | 1.6% | $65k | 24.3% | 22.7% | 15.4% | 58.1% | 17.5% | 2.6% |
Norfolk city: 69 precincts
| Precinct | Population | Voting-age pop. | % White non-Hisp. | % Hispanic | % Black | % Asian | Median income* | % Bachelor's+ | % 18-29 (of adults) | % 65+ | % Homeowners | % Below poverty | % Spanish at home (adults) |
|---|---|---|---|---|---|---|---|---|---|---|---|---|---|
| Azalea Gardens | 2,516 | 1,988 | 56.5% | 7.3% | 31.2% | 1.9% | $80k | 36.6% | 25.9% | 19.8% | 54.3% | 3.2% | 2.5% |
| Ballentine | 4,403 | 3,472 | 27.1% | 7.3% | 57.5% | 0.7% | $73k | 22.1% | 22.0% | 14.4% | 70.5% | 9.7% | 3.7% |
| Barron Black | 3,011 | 2,553 | 41.1% | 8.6% | 23.3% | 21.8% | $84k | 26.7% | 27.1% | 19.0% | 81.2% | 4.1% | 3.6% |
| Bayview | 6,196 | 5,197 | 61.5% | 11.9% | 18.4% | 3.7% | $79k | 30.0% | 21.6% | 15.8% | 45.3% | 10.2% | 8.4% |
| Berkley | 3,559 | 2,519 | 4.9% | 4.4% | 85.7% | 0.0% | $47k | 12.7% | 17.9% | 9.3% | 33.3% | 39.9% | 2.6% |
| Broad Creek | 5,333 | 3,631 | 14.3% | 7.4% | 74.4% | 0.2% | $59k | 19.2% | 26.3% | 12.5% | 40.9% | 36.4% | 6.7% |
| Campostella | 4,680 | 2,955 | 7.3% | 2.7% | 86.0% | 0.2% | $32k | 12.7% | 16.3% | 11.4% | 34.3% | 38.0% | 3.4% |
| Chesterfield | 6,129 | 5,201 | 11.2% | 4.6% | 79.7% | 0.2% | $69k | 22.8% | 64.5% | 8.4% | 50.2% | 21.9% | 2.7% |
| Chrysler Museum | 5,391 | 5,047 | 66.3% | 9.4% | 14.3% | 7.2% | $77k | 69.6% | 34.2% | 20.3% | 24.5% | 10.6% | 5.7% |
| Coleman Place School | 2,897 | 2,220 | 8.1% | 18.7% | 65.8% | 4.8% | $65k | 20.7% | 23.0% | 8.7% | 44.1% | 11.6% | 7.6% |
| Crossroads | 5,011 | 3,780 | 50.1% | 11.0% | 28.8% | 1.5% | $72k | 30.1% | 16.5% | 12.7% | 66.9% | 12.6% | 2.9% |
| East Ocean View | 6,076 | 4,974 | 67.9% | 6.1% | 20.3% | 1.3% | $89k | 48.7% | 20.9% | 17.6% | 48.4% | 9.6% | 6.4% |
| Eastside | 4,386 | 3,450 | 39.6% | 16.3% | 38.5% | 2.8% | $76k | 24.7% | 16.7% | 15.4% | 47.6% | 14.7% | 8.6% |
| Fairlawn | 3,438 | 2,790 | 39.2% | 13.9% | 33.4% | 4.9% | $67k | 24.3% | 16.8% | 13.3% | 53.0% | 18.2% | 5.1% |
| Ghent Square | 2,140 | 1,909 | 69.9% | 8.6% | 10.0% | 7.5% | $112k | 72.6% | 25.2% | 20.2% | 39.6% | 5.7% | 6.8% |
| Granby | 6,318 | 5,023 | 43.5% | 15.2% | 30.0% | 2.7% | $58k | 35.6% | 27.9% | 11.5% | 31.4% | 12.0% | 10.1% |
| Ingleside | 2,890 | 2,321 | 18.9% | 11.1% | 64.4% | 2.6% | $79k | 25.7% | 13.5% | 15.1% | 54.3% | 11.6% | 5.9% |
| Lafayette-Winona | 3,568 | 2,834 | 32.8% | 5.8% | 48.3% | 3.1% | $70k | 22.1% | 26.1% | 16.5% | 57.4% | 21.9% | 2.7% |
| Lake Taylor High School | 4,393 | 3,608 | 34.0% | 13.7% | 39.1% | 6.1% | $70k | 16.2% | 23.2% | 18.9% | 61.3% | 14.9% | 4.0% |
| Lambert's Point | 6,827 | 6,194 | 27.9% | 6.4% | 54.1% | 4.1% | $50k | 30.2% | 63.8% | 5.8% | 31.5% | 26.3% | 4.0% |
| Larchmont School | 6,643 | 5,547 | 47.7% | 9.3% | 29.1% | 8.1% | $90k | 68.2% | 57.9% | 8.1% | 49.1% | 17.5% | 1.9% |
| Larchmont UMC | 2,928 | 2,087 | 89.1% | 5.5% | 1.1% | 1.2% | $177k | 83.0% | 11.1% | 18.7% | 92.9% | 4.8% | 3.5% |
| Larrymore | 3,337 | 2,734 | 53.4% | 4.5% | 33.4% | 2.7% | $80k | 25.1% | 17.5% | 21.2% | 49.1% | 3.5% | 1.9% |
| Lindenwood | 2,029 | 1,555 | 30.5% | 3.0% | 50.7% | 2.1% | $61k | 32.8% | 22.4% | 11.6% | 54.6% | 16.1% | 4.3% |
| Little Creek | 3,820 | 2,931 | 64.7% | 17.7% | 10.8% | 3.7% | $83k | 37.6% | 23.9% | 13.0% | 48.7% | 13.5% | 8.4% |
| Maury | 4,145 | 3,689 | 69.4% | 7.3% | 9.8% | 4.8% | $83k | 69.4% | 33.9% | 13.4% | 32.5% | 8.6% | 4.7% |
| No electorate (water or unpopulated land) | 352 | 303 | 49.2% | 5.8% | 39.6% | 2.6% | $57k | 27.0% | 45.4% | 10.6% | 24.1% | 17.8% | 1.1% |
| No electorate (water or unpopulated land) | 16 | 14 | 66.0% | 7.1% | 16.8% | 1.7% | $51k | 48.5% | 20.3% | 32.8% | 42.3% | 18.5% | 3.4% |
| No electorate (water or unpopulated land) | 302 | 241 | 65.9% | 10.3% | 17.7% | 1.9% | $81k | 43.3% | 16.9% | 15.5% | 43.8% | 12.7% | 9.5% |
| No electorate (water or unpopulated land) | 0 | 0 | |||||||||||
| No electorate (water or unpopulated land) | 13 | 9 | 39.4% | 15.6% | 30.9% | 6.4% | $72k | 22.2% | 13.4% | 11.1% | 69.3% | 18.8% | 3.3% |
| No electorate (water or unpopulated land) | 22 | 15 | 39.3% | 15.5% | 31.1% | 6.4% | $72k | 22.1% | 13.7% | 11.1% | 69.0% | 18.9% | 3.3% |
| No electorate (water or unpopulated land) | 25 | 18 | 39.5% | 15.7% | 30.7% | 6.5% | $72k | 22.2% | 13.0% | 11.2% | 69.4% | 18.7% | 3.4% |
| No electorate (water or unpopulated land) | 21 | 20 | 78.8% | 3.9% | 13.4% | 1.4% | $98k | 50.7% | 7.3% | 49.0% | 0.0% | 5.5% | 4.6% |
| No electorate (water or unpopulated land) | 43 | 34 | 43.7% | 14.6% | 35.0% | 2.3% | $56k | 36.9% | 4.0% | 22.5% | 21.2% | 11.7% | 0.4% |
| No electorate (water or unpopulated land) | 13 | 9 | 18.9% | 11.6% | 60.8% | 0.9% | $52k | 26.9% | 36.9% | 13.6% | 64.6% | 22.8% | 1.6% |
| No electorate (water or unpopulated land) | 13 | 8 | 13.9% | 5.5% | 79.3% | 1.3% | $40k | 28.5% | 66.3% | 6.4% | 16.2% | 19.8% | 0.0% |
| No electorate (water or unpopulated land) | 24 | 21 | 35.7% | 17.8% | 33.2% | 10.8% | $66k | 15.2% | 30.1% | 22.9% | 70.7% | 15.3% | 9.3% |
| No electorate (water or unpopulated land) | 352 | 303 | 49.2% | 5.8% | 39.6% | 2.6% | $57k | 27.0% | 45.4% | 10.6% | 24.1% | 17.8% | 1.1% |
| No electorate (water or unpopulated land) | 16 | 14 | 66.0% | 7.1% | 16.8% | 1.7% | $51k | 48.5% | 20.3% | 32.8% | 42.3% | 18.5% | 3.4% |
| No electorate (water or unpopulated land) | 302 | 241 | 65.9% | 10.3% | 17.7% | 1.9% | $81k | 43.3% | 16.9% | 15.5% | 43.8% | 12.7% | 9.5% |
| No electorate (water or unpopulated land) | 0 | 0 | |||||||||||
| No electorate (water or unpopulated land) | 21 | 20 | 78.8% | 3.9% | 13.4% | 1.4% | $98k | 50.7% | 7.3% | 49.0% | 0.0% | 5.5% | 4.6% |
| No electorate (water or unpopulated land) | 13 | 9 | 18.9% | 11.5% | 60.8% | 0.9% | $52k | 26.9% | 37.0% | 13.6% | 64.6% | 22.8% | 1.6% |
| No electorate (water or unpopulated land) | 43 | 34 | 43.7% | 14.6% | 35.0% | 2.3% | $56k | 36.9% | 4.0% | 22.5% | 21.2% | 11.7% | 0.4% |
| No electorate (water or unpopulated land) | 13 | 8 | 13.9% | 5.5% | 79.3% | 1.3% | $40k | 28.5% | 66.3% | 6.4% | 16.2% | 19.8% | 0.0% |
| No electorate (water or unpopulated land) | 24 | 21 | 35.7% | 17.8% | 33.2% | 10.8% | $66k | 15.2% | 30.1% | 22.9% | 70.7% | 15.3% | 9.3% |
| Northside | 3,846 | 3,042 | 61.9% | 8.9% | 9.5% | 10.5% | $72k | 35.5% | 22.3% | 18.5% | 59.6% | 8.2% | 3.9% |
| Norview | 7,442 | 5,481 | 24.5% | 12.4% | 50.3% | 3.9% | $72k | 21.0% | 24.5% | 12.7% | 56.0% | 18.4% | 6.4% |
| Ocean View Golf Course | 6,343 | 5,209 | 48.1% | 19.1% | 24.7% | 2.4% | $62k | 28.8% | 22.7% | 15.5% | 43.7% | 15.1% | 9.1% |
| Ocean View School | 1,645 | 1,407 | 62.6% | 11.6% | 12.2% | 1.5% | $63k | 33.0% | 34.2% | 7.6% | 31.7% | 11.0% | 7.9% |
| Park Place | 3,974 | 3,164 | 23.8% | 3.5% | 68.1% | 0.2% | $49k | 30.9% | 24.8% | 8.7% | 37.0% | 20.8% | 4.4% |
| Poplar Halls | 6,114 | 4,848 | 19.4% | 8.4% | 58.4% | 5.7% | $78k | 23.8% | 22.8% | 13.2% | 30.7% | 20.0% | 4.9% |
| Pretlow | 4,296 | 3,413 | 62.8% | 8.7% | 11.5% | 2.1% | $74k | 32.7% | 20.7% | 14.8% | 48.2% | 9.4% | 4.7% |
| Rosemont | 5,833 | 4,563 | 5.3% | 7.5% | 77.8% | 5.0% | $64k | 27.2% | 19.9% | 20.6% | 39.7% | 21.9% | 6.8% |
| Ruffner Academy | 3,827 | 2,810 | 10.5% | 1.9% | 84.3% | 0.1% | $23k | 12.7% | 21.7% | 11.5% | 13.2% | 55.6% | 3.0% |
| Second Presbyterian | 12,199 | 10,640 | 54.2% | 15.6% | 19.2% | 4.4% | $70k | 37.0% | 55.0% | 7.3% | 39.3% | 11.5% | 9.9% |
| Sherwood | 8,624 | 6,839 | 27.6% | 13.7% | 49.8% | 4.5% | $80k | 16.4% | 29.9% | 10.8% | 67.2% | 15.2% | 6.7% |
| Suburban Park | 3,910 | 2,980 | 39.2% | 7.8% | 44.0% | 6.5% | $50k | 38.4% | 16.1% | 23.5% | 40.0% | 23.0% | 2.2% |
| Tanners Creek | 2,649 | 2,175 | 29.3% | 12.7% | 47.6% | 4.3% | $54k | 27.4% | 32.5% | 12.0% | 35.9% | 14.0% | 11.9% |
| Tarrallton | 5,456 | 4,037 | 67.7% | 11.1% | 14.5% | 1.9% | $101k | 26.1% | 13.8% | 18.3% | 71.5% | 5.8% | 6.4% |
| Third Presbyterian | 4,506 | 3,865 | 59.4% | 10.8% | 17.4% | 3.1% | $88k | 32.8% | 22.9% | 13.7% | 74.8% | 7.9% | 8.4% |
| Titustown | 14,937 | 11,833 | 43.9% | 17.9% | 28.7% | 3.8% | $50k | 22.1% | 66.5% | 3.1% | 14.5% | 14.5% | 11.0% |
| Union Chapel | 2,666 | 1,784 | 3.1% | 5.0% | 88.8% | 1.5% | $33k | 18.3% | 20.6% | 11.9% | 35.7% | 55.8% | 5.7% |
| Virginia Zoo | 3,922 | 3,454 | 69.4% | 4.7% | 16.8% | 3.2% | $91k | 70.9% | 24.2% | 15.6% | 57.1% | 4.3% | 2.3% |
| W.H. Taylor Elementary | 4,276 | 3,609 | 77.8% | 4.0% | 6.4% | 3.5% | $119k | 65.1% | 22.6% | 15.9% | 52.6% | 6.4% | 2.3% |
| Wesley | 4,001 | 2,767 | 41.8% | 13.8% | 35.3% | 4.3% | $68k | 17.1% | 28.5% | 10.5% | 56.7% | 11.2% | 10.3% |
| Willard | 5,044 | 4,039 | 68.9% | 7.5% | 10.1% | 3.4% | $108k | 53.5% | 15.4% | 20.1% | 74.0% | 5.8% | 4.1% |
| Young Park | 5,823 | 3,712 | 11.2% | 4.3% | 75.9% | 0.7% | $38k | 22.2% | 24.6% | 10.6% | 17.1% | 42.0% | 6.8% |
Newport News city: 133 precincts
| Precinct | Population | Voting-age pop. | % White non-Hisp. | % Hispanic | % Black | % Asian | Median income* | % Bachelor's+ | % 18-29 (of adults) | % 65+ | % Homeowners | % Below poverty | % Spanish at home (adults) |
|---|---|---|---|---|---|---|---|---|---|---|---|---|---|
| Bland | 1,816 | 1,534 | 31.3% | 6.2% | 38.8% | 4.2% | $71k | 22.8% | 40.1% | 2.8% | 7.5% | 4.8% | 4.5% |
| Boulevard | 4,142 | 3,396 | 67.6% | 13.8% | 7.2% | 3.2% | $91k | 25.2% | 34.0% | 12.9% | 56.8% | 6.4% | 7.2% |
| Briarfield | 4,364 | 3,415 | 20.7% | 8.8% | 65.6% | 0.8% | $46k | 17.6% | 23.2% | 11.2% | 28.9% | 13.5% | 5.8% |
| Carver | 1,341 | 1,313 | 56.2% | 3.8% | 35.4% | 1.2% | $74k | 31.6% | 34.6% | 34.2% | 70.2% | 10.4% | 2.2% |
| Charles | 5,448 | 4,407 | 61.0% | 11.7% | 13.6% | 6.5% | $104k | 35.0% | 19.7% | 17.5% | 81.0% | 4.8% | 9.0% |
| Chestnut | 1,696 | 1,312 | 5.2% | 8.7% | 80.2% | 3.7% | $45k | 16.8% | 11.1% | 20.0% | 40.2% | 31.8% | 8.0% |
| Deep Creek | 3,809 | 3,167 | 75.9% | 7.1% | 9.0% | 1.4% | $92k | 45.7% | 15.8% | 24.5% | 84.5% | 5.8% | 4.7% |
| Deer Park | 8,459 | 6,403 | 32.0% | 17.8% | 40.4% | 4.7% | $58k | 38.2% | 30.5% | 11.6% | 18.2% | 16.1% | 16.8% |
| Denbigh | 6,774 | 5,256 | 30.4% | 19.4% | 40.7% | 2.4% | $71k | 21.4% | 19.1% | 14.3% | 44.9% | 12.2% | 12.4% |
| Downtown | 3,000 | 2,639 | 22.9% | 15.3% | 51.5% | 2.8% | $57k | 17.3% | 45.1% | 9.4% | 8.0% | 19.0% | 3.5% |
| Greenwood | 7,122 | 5,173 | 43.1% | 12.2% | 25.8% | 10.4% | $73k | 33.2% | 27.2% | 9.5% | 47.4% | 11.5% | 9.7% |
| Hidenwood | 2,312 | 1,788 | 82.6% | 5.5% | 5.0% | 0.4% | $151k | 64.7% | 11.8% | 22.0% | 93.8% | 1.5% | 2.0% |
| Hilton | 3,354 | 2,378 | 66.0% | 11.7% | 12.7% | 1.5% | $97k | 44.2% | 25.4% | 9.0% | 59.0% | 8.4% | 7.0% |
| Jefferson | 1,772 | 1,296 | 2.8% | 11.5% | 82.1% | 0.1% | $40k | 10.9% | 20.8% | 14.7% | 41.4% | 29.2% | 5.9% |
| Jenkins | 7,359 | 5,242 | 33.5% | 15.5% | 39.1% | 6.9% | $63k | 31.9% | 31.7% | 13.0% | 35.2% | 22.9% | 7.0% |
| Katherine Johnson | 1,944 | 1,560 | 50.5% | 12.5% | 31.6% | 1.0% | $81k | 31.6% | 19.7% | 14.3% | 69.4% | 1.6% | 6.6% |
| Kiln Creek | 6,733 | 5,471 | 43.0% | 6.6% | 40.7% | 6.7% | $99k | 48.0% | 22.8% | 20.4% | 72.2% | 5.8% | 2.0% |
| Knollwood Meadows | 5,155 | 3,988 | 57.0% | 11.0% | 24.2% | 5.6% | $86k | 42.2% | 14.8% | 21.1% | 79.6% | 6.0% | 5.2% |
| Magruder | 2,387 | 1,968 | 5.6% | 7.5% | 85.0% | 0.0% | $46k | 6.3% | 26.6% | 14.0% | 48.2% | 34.7% | 0.4% |
| Mariners' Museum | 4,178 | 3,785 | 66.6% | 9.8% | 14.9% | 1.9% | $57k | 38.8% | 60.3% | 13.9% | 40.7% | 20.7% | 3.1% |
| Marshall | 3,534 | 2,234 | 1.1% | 2.6% | 86.1% | 3.1% | $40k | 6.0% | 27.4% | 9.8% | 23.2% | 37.6% | 0.9% |
| McIntosh | 4,395 | 3,443 | 23.6% | 6.8% | 52.0% | 3.8% | $73k | 27.6% | 22.3% | 10.2% | 33.9% | 13.4% | 5.4% |
| Newmarket | 4,630 | 3,500 | 23.4% | 5.0% | 67.1% | 0.0% | $53k | 16.2% | 23.1% | 13.5% | 43.0% | 16.1% | 0.9% |
| Newsome Park | 1,243 | 926 | 11.7% | 0.2% | 75.6% | 0.0% | $46k | 4.7% | 27.5% | 11.0% | 8.1% | 13.7% | 0.0% |
| No electorate (water or unpopulated land) | 0 | 0 | 42.1% | 15.8% | 0.0% | 21.1% | $59k | 50.0% | 66.7% | 0.0% | 0.0% | 0.0% | 13.3% |
| No electorate (water or unpopulated land) | 0 | 0 | 41.9% | 19.4% | 0.0% | 19.4% | $54k | 55.6% | 70.8% | 0.0% | 0.0% | 0.0% | 12.5% |
| No electorate (water or unpopulated land) | 2 | 2 | 40.8% | 18.5% | 0.0% | 19.4% | $54k | 55.6% | 69.9% | 0.0% | 0.0% | 0.0% | 11.0% |
| No electorate (water or unpopulated land) | 19 | 19 | 31.9% | 22.5% | 33.6% | 10.6% | 2.9% | 96.6% | 0.0% | 0.0% | 0.0% | 6.4% | |
| No electorate (water or unpopulated land) | 3 | 2 | 50.9% | 12.4% | 31.5% | 0.7% | $79k | 31.2% | 19.4% | 14.2% | 68.4% | 2.3% | 6.5% |
| No electorate (water or unpopulated land) | 6 | 5 | 49.0% | 14.3% | 31.7% | 0.7% | $82k | 29.6% | 19.2% | 14.3% | 69.4% | 2.4% | 8.8% |
| No electorate (water or unpopulated land) | 8 | 6 | 40.7% | 23.3% | 32.1% | 0.1% | $96k | 43.1% | 20.8% | 6.7% | 46.3% | 3.0% | 18.4% |
| No electorate (water or unpopulated land) | 8 | 6 | 40.5% | 23.5% | 32.2% | 0.0% | $96k | 43.2% | 20.4% | 6.7% | 46.2% | 2.8% | 18.8% |
| No electorate (water or unpopulated land) | 15 | 12 | 38.8% | 8.1% | 39.2% | 8.5% | $114k | 53.9% | 14.6% | 15.9% | 85.2% | 2.0% | 1.6% |
| No electorate (water or unpopulated land) | 20 | 18 | 70.3% | 1.5% | 25.3% | 0.5% | $48k | 32.0% | 16.5% | 38.7% | 39.4% | 19.0% | 0.9% |
| No electorate (water or unpopulated land) | 50 | 28 | 0.5% | 0.0% | 82.9% | 0.0% | $17k | 9.8% | 12.6% | 4.8% | 12.2% | 51.1% | 0.6% |
| No electorate (water or unpopulated land) | 6 | 3 | 1.8% | 2.2% | 96.0% | 0.0% | $22k | 0.0% | 6.0% | 3.6% | 1.4% | 33.9% | 0.0% |
| No electorate (water or unpopulated land) | 0 | 0 | 0.0% | 0.0% | 100.0% | 0.0% | $23k | 0.0% | 0.0% | 0.0% | 0.0% | 30.0% | 0.0% |
| No electorate (water or unpopulated land) | 143 | 135 | 10.9% | 18.1% | 64.5% | 0.0% | $64k | 9.1% | 26.5% | 7.6% | 0.0% | 27.0% | 1.4% |
| No electorate (water or unpopulated land) | 1 | 1 | 45.8% | 15.3% | 40.3% | 0.0% | 0.0% | 100.0% | 0.0% | 0.0% | |||
| No electorate (water or unpopulated land) | 1 | 1 | 45.2% | 15.1% | 39.8% | 0.0% | 0.0% | 100.0% | 0.0% | 0.0% | |||
| No electorate (water or unpopulated land) | 1 | 1 | 45.5% | 15.5% | 40.0% | 0.0% | 0.0% | 100.0% | 0.0% | 0.0% | |||
| No electorate (water or unpopulated land) | 1 | 1 | 45.0% | 15.4% | 39.6% | 0.0% | 0.0% | 100.0% | 0.0% | 0.0% | |||
| No electorate (water or unpopulated land) | 2 | 2 | 45.0% | 15.2% | 39.3% | 0.0% | 0.0% | 100.0% | 0.0% | 0.0% | |||
| No electorate (water or unpopulated land) | 21 | 15 | 70.7% | 8.3% | 11.0% | 1.6% | $105k | 48.9% | 23.0% | 10.5% | 64.5% | 5.8% | 5.6% |
| No electorate (water or unpopulated land) | 60 | 42 | 76.8% | 8.5% | 3.9% | 2.0% | $119k | 53.3% | 24.5% | 10.1% | 76.3% | 4.8% | 5.2% |
| No electorate (water or unpopulated land) | 8 | 7 | 84.6% | 4.4% | 6.4% | 2.0% | $114k | 47.6% | 8.4% | 32.6% | 82.6% | 10.7% | 1.2% |
| No electorate (water or unpopulated land) | 7 | 6 | 84.3% | 7.6% | 6.3% | 0.4% | $139k | 61.5% | 14.6% | 27.5% | 90.1% | 3.8% | 2.8% |
| No electorate (water or unpopulated land) | 14 | 10 | 82.0% | 4.6% | 4.5% | 0.4% | $158k | 66.2% | 10.5% | 20.0% | 95.4% | 0.6% | 1.6% |
| No electorate (water or unpopulated land) | 45 | 37 | 70.4% | 9.0% | 15.4% | 3.3% | $111k | 47.4% | 13.0% | 23.9% | 94.2% | 10.9% | 5.6% |
| No electorate (water or unpopulated land) | 10 | 8 | 73.5% | 0.6% | 12.2% | 7.1% | $145k | 45.5% | 7.7% | 26.7% | 97.1% | 3.2% | 0.7% |
| No electorate (water or unpopulated land) | 11 | 9 | 73.4% | 0.6% | 12.2% | 7.0% | $145k | 45.5% | 7.7% | 26.7% | 97.1% | 3.2% | 0.7% |
| No electorate (water or unpopulated land) | 19 | 16 | 73.4% | 0.6% | 12.2% | 7.0% | $145k | 45.5% | 7.7% | 26.7% | 97.0% | 3.2% | 0.7% |
| No electorate (water or unpopulated land) | 29 | 24 | 65.1% | 5.1% | 25.1% | 2.7% | $123k | 51.3% | 11.8% | 24.1% | 93.2% | 1.0% | 1.1% |
| No electorate (water or unpopulated land) | 137 | 115 | 48.8% | 10.7% | 29.3% | 9.2% | $83k | 32.5% | 16.2% | 25.0% | 88.8% | 4.4% | 7.7% |
| No electorate (water or unpopulated land) | 0 | 0 | |||||||||||
| No electorate (water or unpopulated land) | 0 | 0 | |||||||||||
| No electorate (water or unpopulated land) | 0 | 0 | |||||||||||
| No electorate (water or unpopulated land) | 0 | 0 | |||||||||||
| No electorate (water or unpopulated land) | 0 | 0 | |||||||||||
| No electorate (water or unpopulated land) | 0 | 0 | |||||||||||
| No electorate (water or unpopulated land) | 0 | 0 | |||||||||||
| No electorate (water or unpopulated land) | 0 | 0 | |||||||||||
| No electorate (water or unpopulated land) | 0 | 0 | |||||||||||
| No electorate (water or unpopulated land) | 0 | 0 | 40.9% | 18.2% | 0.0% | 20.5% | $53k | 53.8% | 70.6% | 0.0% | 0.0% | 0.0% | 11.8% |
| No electorate (water or unpopulated land) | 13 | 9 | 25.6% | 8.7% | 44.0% | 13.8% | $56k | 22.3% | 29.9% | 11.1% | 22.6% | 8.3% | 8.3% |
| No electorate (water or unpopulated land) | 16 | 11 | 47.4% | 16.5% | 34.7% | 0.2% | $82k | 23.3% | 16.2% | 19.1% | 69.1% | 13.3% | 4.8% |
| No electorate (water or unpopulated land) | 31 | 24 | 40.1% | 2.2% | 43.4% | 3.0% | $73k | 52.0% | 34.0% | 5.0% | 11.7% | 6.7% | 3.1% |
| No electorate (water or unpopulated land) | 33 | 22 | 19.1% | 14.9% | 59.5% | 2.3% | $79k | 12.0% | 22.7% | 14.7% | 43.8% | 24.0% | 1.7% |
| No electorate (water or unpopulated land) | 4 | 3 | 50.1% | 13.3% | 31.6% | 0.8% | $82k | 32.6% | 19.1% | 13.9% | 67.8% | 1.4% | 7.6% |
| No electorate (water or unpopulated land) | 0 | 0 | 42.1% | 15.8% | 0.0% | 21.1% | $59k | 50.0% | 66.7% | 0.0% | 0.0% | 0.0% | 13.3% |
| No electorate (water or unpopulated land) | 0 | 0 | 41.9% | 19.4% | 0.0% | 19.4% | $54k | 55.6% | 70.8% | 0.0% | 0.0% | 0.0% | 12.5% |
| No electorate (water or unpopulated land) | 2 | 2 | 40.8% | 18.5% | 0.0% | 19.4% | $54k | 55.6% | 69.9% | 0.0% | 0.0% | 0.0% | 11.0% |
| No electorate (water or unpopulated land) | 19 | 19 | 31.9% | 22.5% | 33.6% | 10.6% | 2.9% | 96.6% | 0.0% | 0.0% | 0.0% | 6.4% | |
| No electorate (water or unpopulated land) | 3 | 2 | 50.9% | 12.4% | 31.5% | 0.7% | $79k | 31.2% | 19.4% | 14.2% | 68.4% | 2.3% | 6.5% |
| No electorate (water or unpopulated land) | 6 | 5 | 49.0% | 14.3% | 31.7% | 0.7% | $82k | 29.6% | 19.2% | 14.3% | 69.4% | 2.4% | 8.8% |
| No electorate (water or unpopulated land) | 8 | 6 | 40.7% | 23.3% | 32.1% | 0.1% | $96k | 43.1% | 20.8% | 6.7% | 46.3% | 3.0% | 18.4% |
| No electorate (water or unpopulated land) | 8 | 6 | 40.5% | 23.5% | 32.2% | 0.0% | $96k | 43.2% | 20.4% | 6.7% | 46.2% | 2.8% | 18.8% |
| No electorate (water or unpopulated land) | 15 | 12 | 38.8% | 8.1% | 39.2% | 8.5% | $114k | 53.9% | 14.6% | 15.9% | 85.2% | 2.0% | 1.6% |
| No electorate (water or unpopulated land) | 20 | 18 | 70.3% | 1.5% | 25.3% | 0.5% | $48k | 32.0% | 16.5% | 38.7% | 39.4% | 19.0% | 0.9% |
| No electorate (water or unpopulated land) | 50 | 28 | 0.5% | 0.0% | 82.9% | 0.0% | $17k | 9.8% | 12.6% | 4.8% | 12.2% | 51.1% | 0.6% |
| No electorate (water or unpopulated land) | 6 | 3 | 1.8% | 2.2% | 96.0% | 0.0% | $22k | 0.0% | 6.0% | 3.6% | 1.4% | 33.9% | 0.0% |
| No electorate (water or unpopulated land) | 0 | 0 | 0.0% | 0.0% | 100.0% | 0.0% | $23k | 0.0% | 0.0% | 0.0% | 0.0% | 30.0% | 0.0% |
| No electorate (water or unpopulated land) | 143 | 135 | 10.9% | 18.1% | 64.5% | 0.0% | $64k | 9.1% | 26.5% | 7.6% | 0.0% | 27.0% | 1.4% |
| No electorate (water or unpopulated land) | 1 | 1 | 45.8% | 15.3% | 40.3% | 0.0% | 0.0% | 100.0% | 0.0% | 0.0% | |||
| No electorate (water or unpopulated land) | 1 | 1 | 45.2% | 15.1% | 39.8% | 0.0% | 0.0% | 100.0% | 0.0% | 0.0% | |||
| No electorate (water or unpopulated land) | 1 | 1 | 45.5% | 15.5% | 40.0% | 0.0% | 0.0% | 100.0% | 0.0% | 0.0% | |||
| No electorate (water or unpopulated land) | 1 | 1 | 45.0% | 15.4% | 39.6% | 0.0% | 0.0% | 100.0% | 0.0% | 0.0% | |||
| No electorate (water or unpopulated land) | 2 | 2 | 45.0% | 15.2% | 39.3% | 0.0% | 0.0% | 100.0% | 0.0% | 0.0% | |||
| No electorate (water or unpopulated land) | 21 | 15 | 70.7% | 8.3% | 11.0% | 1.6% | $105k | 48.9% | 23.0% | 10.5% | 64.5% | 5.8% | 5.6% |
| No electorate (water or unpopulated land) | 60 | 42 | 76.8% | 8.5% | 3.9% | 2.0% | $119k | 53.3% | 24.5% | 10.1% | 76.3% | 4.8% | 5.2% |
| No electorate (water or unpopulated land) | 8 | 7 | 84.6% | 4.4% | 6.4% | 2.0% | $114k | 47.6% | 8.4% | 32.6% | 82.6% | 10.7% | 1.2% |
| No electorate (water or unpopulated land) | 7 | 6 | 84.3% | 7.6% | 6.3% | 0.4% | $139k | 61.5% | 14.6% | 27.5% | 90.1% | 3.8% | 2.8% |
| No electorate (water or unpopulated land) | 14 | 10 | 82.0% | 4.6% | 4.5% | 0.4% | $158k | 66.2% | 10.5% | 20.0% | 95.4% | 0.6% | 1.6% |
| No electorate (water or unpopulated land) | 45 | 37 | 70.4% | 9.0% | 15.4% | 3.3% | $111k | 47.4% | 13.0% | 23.9% | 94.2% | 10.9% | 5.6% |
| No electorate (water or unpopulated land) | 10 | 8 | 73.5% | 0.6% | 12.2% | 7.1% | $145k | 45.5% | 7.7% | 26.7% | 97.1% | 3.2% | 0.7% |
| No electorate (water or unpopulated land) | 11 | 9 | 73.4% | 0.6% | 12.2% | 7.0% | $145k | 45.5% | 7.7% | 26.7% | 97.1% | 3.2% | 0.7% |
| No electorate (water or unpopulated land) | 19 | 16 | 73.4% | 0.6% | 12.2% | 7.0% | $145k | 45.5% | 7.7% | 26.7% | 97.0% | 3.2% | 0.7% |
| No electorate (water or unpopulated land) | 29 | 24 | 65.1% | 5.1% | 25.1% | 2.7% | $123k | 51.3% | 11.8% | 24.1% | 93.2% | 1.0% | 1.1% |
| No electorate (water or unpopulated land) | 137 | 115 | 48.8% | 10.7% | 29.3% | 9.2% | $83k | 32.5% | 16.2% | 25.0% | 88.8% | 4.4% | 7.7% |
| No electorate (water or unpopulated land) | 0 | 0 | |||||||||||
| No electorate (water or unpopulated land) | 0 | 0 | |||||||||||
| No electorate (water or unpopulated land) | 0 | 0 | |||||||||||
| No electorate (water or unpopulated land) | 0 | 0 | |||||||||||
| No electorate (water or unpopulated land) | 0 | 0 | |||||||||||
| No electorate (water or unpopulated land) | 0 | 0 | |||||||||||
| No electorate (water or unpopulated land) | 0 | 0 | |||||||||||
| No electorate (water or unpopulated land) | 0 | 0 | |||||||||||
| No electorate (water or unpopulated land) | 0 | 0 | |||||||||||
| No electorate (water or unpopulated land) | 0 | 0 | 40.9% | 18.2% | 0.0% | 20.5% | $53k | 53.8% | 70.6% | 0.0% | 0.0% | 0.0% | 11.8% |
| No electorate (water or unpopulated land) | 16 | 11 | 47.4% | 16.9% | 34.4% | 0.2% | $81k | 23.2% | 16.1% | 19.0% | 69.0% | 13.3% | 5.1% |
| No electorate (water or unpopulated land) | 31 | 24 | 40.1% | 2.2% | 43.4% | 3.0% | $73k | 52.0% | 34.0% | 5.0% | 11.7% | 6.7% | 3.1% |
| No electorate (water or unpopulated land) | 13 | 9 | 25.6% | 8.7% | 44.0% | 13.8% | $56k | 22.3% | 29.9% | 11.1% | 22.6% | 8.3% | 8.3% |
| No electorate (water or unpopulated land) | 33 | 22 | 19.1% | 14.9% | 59.5% | 2.3% | $79k | 12.0% | 22.7% | 14.7% | 43.8% | 24.0% | 1.7% |
| No electorate (water or unpopulated land) | 4 | 3 | 50.0% | 13.3% | 31.6% | 0.8% | $82k | 32.6% | 19.1% | 13.8% | 68.2% | 1.5% | 7.4% |
| Palmer | 8,466 | 6,235 | 29.7% | 25.1% | 35.1% | 3.0% | $59k | 37.6% | 35.3% | 8.1% | 32.3% | 29.4% | 16.7% |
| Reed | 3,522 | 2,261 | 1.3% | 0.9% | 90.2% | 0.2% | $25k | 9.3% | 12.3% | 11.2% | 30.9% | 36.2% | 1.0% |
| Reservoir | 9,038 | 6,406 | 32.6% | 17.8% | 35.3% | 7.0% | $69k | 27.1% | 47.2% | 5.6% | 38.1% | 9.7% | 9.5% |
| Richneck | 5,863 | 4,708 | 36.8% | 11.2% | 41.1% | 2.6% | $105k | 35.0% | 22.6% | 16.9% | 79.1% | 2.8% | 3.3% |
| River | 2,985 | 2,393 | 45.1% | 8.4% | 44.1% | 0.0% | $65k | 26.1% | 12.1% | 22.0% | 41.8% | 14.5% | 3.3% |
| Riverside | 1,629 | 1,452 | 82.7% | 7.8% | 6.2% | 1.3% | $138k | 61.2% | 32.6% | 22.4% | 90.1% | 4.0% | 2.7% |
| Riverview | 2,811 | 2,450 | 67.8% | 4.9% | 16.2% | 5.9% | $120k | 41.6% | 13.7% | 23.2% | 94.1% | 9.3% | 0.9% |
| Sanford | 1,587 | 1,311 | 67.5% | 3.8% | 21.2% | 4.0% | $129k | 49.4% | 10.6% | 24.9% | 94.4% | 1.7% | 1.0% |
| Saunders | 6,251 | 5,117 | 58.8% | 1.9% | 31.4% | 1.5% | $54k | 31.7% | 19.7% | 22.7% | 36.3% | 15.5% | 1.6% |
| Sedgefield | 4,434 | 3,357 | 47.8% | 1.3% | 44.5% | 3.0% | $89k | 26.9% | 25.8% | 12.3% | 70.5% | 3.0% | 0.7% |
| South Morrison | 3,820 | 2,891 | 32.9% | 9.4% | 54.6% | 1.4% | $61k | 23.8% | 18.0% | 10.8% | 45.8% | 10.5% | 4.2% |
| Stoney Run | 7,749 | 5,881 | 22.1% | 12.1% | 58.1% | 2.4% | $61k | 17.8% | 25.3% | 12.6% | 32.5% | 25.5% | 4.8% |
| Stoneybrook | 6,654 | 4,879 | 28.0% | 16.6% | 43.1% | 2.6% | $62k | 23.9% | 24.0% | 11.2% | 48.2% | 19.2% | 8.0% |
| Warwick | 2,565 | 2,063 | 50.4% | 15.1% | 28.2% | 0.9% | $65k | 27.9% | 19.2% | 15.4% | 38.9% | 18.0% | 7.6% |
| Washington | 1,755 | 1,418 | 7.4% | 5.9% | 80.5% | 0.0% | $27k | 22.1% | 19.0% | 18.9% | 23.9% | 27.3% | 4.6% |
| Watkins | 8,641 | 6,083 | 51.5% | 3.5% | 40.7% | 0.2% | $92k | 34.5% | 14.4% | 9.7% | 72.2% | 7.8% | 2.6% |
| Wilson | 1,059 | 835 | 10.7% | 11.4% | 76.4% | 1.2% | $38k | 24.2% | 28.9% | 24.8% | 59.7% | 6.8% | 4.7% |
| Windsor | 3,349 | 2,169 | 41.4% | 11.2% | 42.8% | 1.6% | $82k | 31.1% | 22.2% | 12.7% | 49.4% | 17.8% | 5.0% |
| Yates | 4,154 | 3,189 | 49.5% | 5.6% | 31.5% | 2.6% | $78k | 39.9% | 24.0% | 21.1% | 40.6% | 10.1% | 0.6% |
Hampton city: 59 precincts
| Precinct | Population | Voting-age pop. | % White non-Hisp. | % Hispanic | % Black | % Asian | Median income* | % Bachelor's+ | % 18-29 (of adults) | % 65+ | % Homeowners | % Below poverty | % Spanish at home (adults) |
|---|---|---|---|---|---|---|---|---|---|---|---|---|---|
| Aberdeen | 4,330 | 3,548 | 19.4% | 9.8% | 60.8% | 0.3% | $52k | 29.6% | 24.8% | 23.0% | 43.4% | 12.5% | 7.2% |
| Armstrong | 5,248 | 4,103 | 38.7% | 7.0% | 48.3% | 1.8% | $78k | 31.0% | 19.2% | 16.1% | 62.2% | 10.0% | 1.8% |
| Asbury | 5,900 | 4,563 | 75.5% | 2.4% | 15.8% | 0.0% | $120k | 35.3% | 8.0% | 22.4% | 85.7% | 4.7% | 0.2% |
| Bassette | 3,146 | 2,553 | 15.9% | 5.1% | 74.6% | 0.0% | $70k | 22.9% | 11.1% | 23.7% | 74.2% | 7.3% | 1.5% |
| Bethel | 3,744 | 2,982 | 32.2% | 0.4% | 49.9% | 6.6% | $105k | 30.6% | 11.5% | 20.9% | 70.2% | 9.6% | 1.6% |
| Bryan | 4,503 | 3,828 | 62.1% | 3.2% | 29.7% | 1.1% | $78k | 30.9% | 11.8% | 23.2% | 62.8% | 9.6% | 3.4% |
| Burbank | 6,954 | 5,162 | 38.2% | 8.9% | 38.0% | 9.2% | $71k | 27.9% | 36.5% | 14.7% | 53.7% | 12.7% | 3.7% |
| City Hall | 3,795 | 2,781 | 20.7% | 3.6% | 66.7% | 1.7% | $62k | 18.4% | 23.3% | 17.6% | 50.0% | 15.9% | 1.2% |
| Cooper | 7,831 | 6,782 | 23.8% | 11.0% | 53.3% | 2.3% | $68k | 24.9% | 34.7% | 17.1% | 12.1% | 16.0% | 6.6% |
| East Hampton | 3,114 | 2,472 | 36.3% | 4.9% | 49.5% | 0.4% | $82k | 22.7% | 38.4% | 17.7% | 36.5% | 21.3% | 2.6% |
| Forrest | 3,727 | 3,144 | 42.3% | 5.6% | 39.8% | 5.5% | $76k | 25.5% | 19.5% | 18.2% | 64.0% | 8.7% | 4.6% |
| HAMPTON UNIV | 1,726 | 1,693 | 20.2% | 6.1% | 67.4% | 1.4% | $41k | 26.6% | 90.7% | 3.3% | 16.1% | 30.2% | 2.5% |
| Hampton Library | 1,141 | 952 | 52.1% | 1.6% | 41.2% | 0.9% | $88k | 39.6% | 27.0% | 16.4% | 61.9% | 15.8% | 3.1% |
| Jackson | 7,324 | 5,481 | 30.4% | 7.1% | 53.6% | 1.3% | $56k | 21.0% | 26.8% | 12.4% | 50.9% | 19.9% | 2.6% |
| Jones | 2,597 | 2,045 | 29.7% | 14.2% | 51.4% | 0.0% | $43k | 19.7% | 19.1% | 15.0% | 50.8% | 15.4% | 12.2% |
| Kecoughtan | 4,683 | 3,117 | 26.8% | 8.5% | 54.3% | 1.5% | $51k | 28.4% | 22.3% | 6.7% | 43.6% | 25.6% | 1.0% |
| Kraft | 5,999 | 4,890 | 38.8% | 8.0% | 38.6% | 3.1% | $91k | 32.6% | 20.3% | 15.6% | 75.0% | 5.1% | 5.7% |
| Langley | 4,325 | 3,600 | 52.4% | 5.1% | 37.7% | 1.3% | $66k | 25.0% | 18.0% | 16.2% | 57.8% | 21.4% | 3.9% |
| Lindsay | 4,035 | 3,032 | 12.5% | 11.8% | 72.9% | 0.0% | $53k | 23.6% | 19.3% | 20.7% | 44.6% | 21.2% | 5.8% |
| Machen | 8,770 | 6,472 | 22.2% | 11.3% | 56.4% | 2.0% | $79k | 30.6% | 29.8% | 9.9% | 45.9% | 7.5% | 7.8% |
| Mallory | 3,963 | 3,261 | 15.9% | 3.0% | 71.0% | 1.2% | $52k | 23.5% | 20.3% | 19.5% | 61.0% | 11.2% | 3.5% |
| No electorate (water or unpopulated land) | 24 | 18 | 33.1% | 9.8% | 42.1% | 2.8% | $111k | 35.0% | 31.7% | 10.7% | 83.5% | 6.7% | 2.3% |
| No electorate (water or unpopulated land) | 3 | 3 | 27.2% | 9.6% | 49.7% | 6.5% | $73k | 36.5% | 27.3% | 17.3% | 60.5% | 20.4% | 5.8% |
| No electorate (water or unpopulated land) | 295 | 240 | 62.6% | 11.5% | 11.2% | 12.3% | $115k | 38.7% | 57.6% | 5.2% | 36.9% | 1.4% | 5.8% |
| No electorate (water or unpopulated land) | 18 | 15 | 48.8% | 3.4% | 43.3% | 1.3% | $108k | 37.3% | 14.6% | 17.3% | 75.8% | 6.1% | 1.6% |
| No electorate (water or unpopulated land) | 37 | 30 | 74.7% | 15.2% | 8.4% | 0.0% | $122k | 53.2% | 18.7% | 27.3% | 90.7% | 1.8% | 5.1% |
| No electorate (water or unpopulated land) | 11 | 11 | 78.8% | 3.9% | 13.5% | 1.3% | $97k | 50.6% | 7.3% | 49.0% | 0.0% | 5.5% | 4.6% |
| No electorate (water or unpopulated land) | 23 | 20 | 26.1% | 6.7% | 55.6% | 4.1% | $63k | 32.0% | 34.7% | 14.3% | 11.9% | 14.3% | 4.4% |
| No electorate (water or unpopulated land) | 10 | 8 | 10.2% | 4.7% | 77.9% | 0.0% | $52k | 21.4% | 13.5% | 26.7% | 42.4% | 8.3% | 3.9% |
| No electorate (water or unpopulated land) | 18 | 12 | 11.1% | 12.2% | 73.4% | 0.0% | $49k | 24.1% | 18.9% | 20.1% | 49.3% | 27.9% | 3.1% |
| No electorate (water or unpopulated land) | 7 | 6 | 16.0% | 13.6% | 68.6% | 0.0% | $50k | 19.8% | 21.9% | 20.6% | 27.7% | 11.5% | 11.0% |
| No electorate (water or unpopulated land) | 5 | 4 | 27.2% | 9.5% | 49.5% | 6.3% | $73k | 36.4% | 27.3% | 17.3% | 60.7% | 20.2% | 5.7% |
| No electorate (water or unpopulated land) | 17 | 13 | 38.9% | 4.2% | 52.1% | 0.6% | $82k | 28.4% | 16.9% | 21.5% | 57.7% | 14.3% | 1.7% |
| No electorate (water or unpopulated land) | 16 | 14 | 26.6% | 1.4% | 59.9% | 0.9% | $68k | 23.9% | 31.9% | 14.6% | 28.9% | 9.8% | 2.4% |
| No electorate (water or unpopulated land) | 27 | 19 | 36.6% | 7.1% | 37.4% | 1.5% | $76k | 37.5% | 19.6% | 13.7% | 66.9% | 16.0% | 0.0% |
| No electorate (water or unpopulated land) | 24 | 18 | 33.1% | 9.8% | 42.1% | 2.8% | $111k | 35.0% | 31.7% | 10.7% | 83.5% | 6.7% | 2.3% |
| No electorate (water or unpopulated land) | 3 | 3 | 27.2% | 9.6% | 49.7% | 6.5% | $73k | 36.5% | 27.3% | 17.3% | 60.5% | 20.4% | 5.8% |
| No electorate (water or unpopulated land) | 295 | 240 | 62.6% | 11.5% | 11.2% | 12.3% | $115k | 38.7% | 57.6% | 5.2% | 36.9% | 1.4% | 5.8% |
| No electorate (water or unpopulated land) | 18 | 15 | 48.8% | 3.4% | 43.3% | 1.3% | $108k | 37.3% | 14.6% | 17.3% | 75.8% | 6.1% | 1.6% |
| No electorate (water or unpopulated land) | 37 | 30 | 74.7% | 15.2% | 8.4% | 0.0% | $122k | 53.2% | 18.7% | 27.3% | 90.7% | 1.8% | 5.1% |
| No electorate (water or unpopulated land) | 11 | 11 | 78.8% | 3.9% | 13.5% | 1.3% | $97k | 50.6% | 7.3% | 49.0% | 0.0% | 5.5% | 4.6% |
| No electorate (water or unpopulated land) | 23 | 20 | 26.1% | 6.7% | 55.6% | 4.1% | $63k | 32.0% | 34.7% | 14.3% | 11.9% | 14.3% | 4.4% |
| No electorate (water or unpopulated land) | 10 | 8 | 10.2% | 4.7% | 77.9% | 0.0% | $52k | 21.4% | 13.5% | 26.7% | 42.4% | 8.3% | 3.9% |
| No electorate (water or unpopulated land) | 18 | 12 | 11.1% | 12.2% | 73.4% | 0.0% | $49k | 24.1% | 18.9% | 20.1% | 49.3% | 27.9% | 3.1% |
| No electorate (water or unpopulated land) | 7 | 6 | 16.0% | 13.6% | 68.6% | 0.0% | $50k | 19.8% | 21.9% | 20.6% | 27.7% | 11.5% | 11.0% |
| No electorate (water or unpopulated land) | 5 | 4 | 27.2% | 9.5% | 49.5% | 6.3% | $73k | 36.4% | 27.3% | 17.3% | 60.7% | 20.2% | 5.7% |
| No electorate (water or unpopulated land) | 16 | 14 | 26.6% | 1.4% | 60.0% | 0.9% | $68k | 24.0% | 31.9% | 14.5% | 28.9% | 9.7% | 2.4% |
| No electorate (water or unpopulated land) | 27 | 19 | 36.6% | 7.1% | 37.4% | 1.5% | $76k | 37.5% | 19.6% | 13.7% | 66.9% | 16.0% | 0.0% |
| No electorate (water or unpopulated land) | 16 | 12 | 39.0% | 4.2% | 52.1% | 0.7% | $82k | 28.7% | 16.9% | 21.5% | 58.8% | 13.9% | 1.6% |
| Patrick | 3,962 | 2,965 | 52.3% | 9.2% | 21.2% | 4.1% | $85k | 28.5% | 16.6% | 15.8% | 68.0% | 5.9% | 5.0% |
| Peake | 1,390 | 906 | 20.4% | 7.3% | 68.6% | 0.1% | $40k | 25.8% | 35.5% | 11.2% | 37.6% | 37.3% | 3.3% |
| Phenix | 4,870 | 3,890 | 18.7% | 3.1% | 70.2% | 0.2% | $64k | 21.1% | 17.5% | 19.9% | 60.2% | 6.9% | 2.6% |
| Phillips | 6,317 | 4,845 | 63.2% | 2.0% | 22.2% | 1.2% | $119k | 38.9% | 23.2% | 16.6% | 85.6% | 15.6% | 0.7% |
| Phoebus | 1,567 | 1,199 | 26.5% | 6.0% | 58.8% | 1.1% | $58k | 24.5% | 25.5% | 10.1% | 44.1% | 15.7% | 7.9% |
| Sandy Bottom | 5,147 | 3,906 | 31.8% | 7.4% | 44.1% | 5.4% | $118k | 39.2% | 26.6% | 14.2% | 86.9% | 5.7% | 2.0% |
| Smith | 6,317 | 4,908 | 42.4% | 4.5% | 45.1% | 1.6% | $67k | 24.1% | 17.7% | 18.0% | 67.9% | 12.0% | 4.2% |
| Syms | 2,490 | 2,051 | 49.2% | 2.0% | 34.4% | 5.0% | $107k | 47.6% | 24.0% | 27.1% | 85.3% | 6.8% | 1.5% |
| Thomas | 5,607 | 4,334 | 17.7% | 12.1% | 64.3% | 1.7% | $53k | 30.4% | 20.2% | 15.7% | 45.7% | 19.3% | 6.5% |
| Wythe | 2,646 | 2,164 | 49.8% | 8.6% | 34.6% | 0.4% | $99k | 31.9% | 16.5% | 21.5% | 78.3% | 5.5% | 3.4% |
Chesapeake city: 59 precincts
| Precinct | Population | Voting-age pop. | % White non-Hisp. | % Hispanic | % Black | % Asian | Median income* | % Bachelor's+ | % 18-29 (of adults) | % 65+ | % Homeowners | % Below poverty | % Spanish at home (adults) |
|---|---|---|---|---|---|---|---|---|---|---|---|---|---|
| Bailey Creek | 3,464 | 2,445 | 87.3% | 1.6% | 4.7% | 0.3% | $143k | 37.2% | 18.6% | 14.5% | 87.9% | 7.5% | 0.5% |
| Camelot | 2,792 | 2,390 | 12.3% | 5.9% | 68.2% | 0.0% | $72k | 21.1% | 18.5% | 25.5% | 89.4% | 11.2% | 2.2% |
| Carver School | 5,013 | 3,747 | 22.7% | 18.8% | 55.0% | 0.1% | $45k | 19.6% | 17.4% | 25.1% | 40.5% | 25.1% | 15.4% |
| Churchland | 2,959 | 2,236 | 72.9% | 3.4% | 7.5% | 5.7% | $101k | 46.8% | 13.9% | 21.8% | 89.5% | 1.4% | 3.8% |
| Crestwood | 3,091 | 2,416 | 20.6% | 4.8% | 62.9% | 1.6% | $62k | 35.4% | 22.5% | 12.9% | 72.5% | 6.0% | 3.9% |
| Cypress | 5,079 | 4,260 | 56.4% | 5.8% | 30.2% | 2.7% | $63k | 32.9% | 41.3% | 13.5% | 20.9% | 18.0% | 3.7% |
| E. W. Chittum | 4,289 | 3,019 | 57.6% | 5.7% | 25.9% | 2.0% | $172k | 54.4% | 10.7% | 9.3% | 94.9% | 7.2% | 6.6% |
| Expressway | 1,027 | 974 | 29.5% | 11.4% | 51.4% | 4.0% | $71k | 27.0% | 5.6% | 28.5% | 53.2% | 11.6% | 1.6% |
| Fairways II | 1,711 | 1,408 | 60.3% | 4.5% | 21.6% | 10.3% | $69k | 32.5% | 27.0% | 17.4% | 63.7% | 11.2% | 1.3% |
| Fellowship | 3,208 | 2,468 | 50.6% | 7.8% | 25.2% | 4.3% | $92k | 48.9% | 20.0% | 15.6% | 73.0% | 11.2% | 3.7% |
| Geneva Park | 5,024 | 3,525 | 60.9% | 8.4% | 25.1% | 1.0% | $57k | 9.4% | 28.1% | 9.0% | 55.3% | 20.5% | 5.3% |
| Georgetown | 3,510 | 2,719 | 21.5% | 7.1% | 68.2% | 2.8% | $86k | 42.8% | 15.8% | 15.5% | 83.9% | 16.7% | 2.0% |
| Georgetown East | 2,350 | 2,108 | 36.5% | 6.9% | 55.6% | 0.7% | $86k | 30.1% | 21.1% | 37.4% | 55.0% | 7.7% | 5.5% |
| Gilmerton | 4,891 | 3,593 | 53.7% | 3.5% | 29.2% | 1.3% | $103k | 14.2% | 17.1% | 12.1% | 99.1% | 8.7% | 0.7% |
| Greenbrier Middle School | 6,382 | 5,217 | 51.1% | 12.6% | 26.7% | 3.9% | $91k | 41.1% | 23.4% | 16.3% | 54.3% | 8.8% | 11.7% |
| Indian River | 4,103 | 2,833 | 39.6% | 20.0% | 32.5% | 1.7% | $62k | 19.2% | 12.0% | 13.2% | 78.1% | 13.8% | 10.5% |
| Johnson Park | 3,109 | 2,109 | 23.2% | 6.0% | 63.6% | 1.5% | $56k | 15.6% | 32.9% | 7.7% | 47.0% | 29.8% | 5.8% |
| Jolliff | 3,271 | 2,253 | 75.8% | 7.5% | 12.7% | 0.8% | $155k | 51.2% | 16.9% | 11.0% | 92.8% | 2.1% | 9.7% |
| Jolliff Middle School | 6,826 | 4,715 | 8.3% | 5.9% | 80.9% | 0.6% | $72k | 27.0% | 25.5% | 9.6% | 71.5% | 18.2% | 3.5% |
| Nansemond | 3,533 | 2,673 | 42.3% | 11.4% | 31.0% | 7.5% | $95k | 46.6% | 18.3% | 16.8% | 76.4% | 3.2% | 3.5% |
| No electorate (water or unpopulated land) | 21 | 14 | 76.7% | 7.3% | 12.2% | 0.7% | $157k | 51.2% | 16.6% | 10.9% | 92.9% | 2.1% | 9.4% |
| No electorate (water or unpopulated land) | 18 | 13 | 33.9% | 7.7% | 54.4% | 1.1% | $109k | 34.8% | 8.1% | 11.9% | 70.9% | 4.5% | 0.5% |
| No electorate (water or unpopulated land) | 773 | 633 | 76.5% | 10.1% | 7.6% | 1.1% | $93k | 31.9% | 10.6% | 24.2% | 80.6% | 5.1% | 7.5% |
| No electorate (water or unpopulated land) | 24 | 22 | 47.2% | 7.3% | 37.6% | 1.8% | $69k | 33.7% | 51.4% | 7.2% | 29.4% | 26.1% | 5.6% |
| No electorate (water or unpopulated land) | 60 | 46 | 57.3% | 3.9% | 29.3% | 1.4% | $100k | 17.9% | 16.4% | 15.8% | 97.7% | 10.4% | 0.4% |
| No electorate (water or unpopulated land) | 7 | 6 | 25.8% | 3.3% | 49.7% | 2.5% | $59k | 19.8% | 17.9% | 20.9% | 79.6% | 9.9% | 5.6% |
| No electorate (water or unpopulated land) | 22 | 15 | 48.4% | 2.1% | 41.7% | 3.8% | $88k | 41.1% | 20.8% | 13.2% | 75.3% | 1.7% | 1.8% |
| No electorate (water or unpopulated land) | 15 | 10 | 80.0% | 6.6% | 0.6% | 7.0% | $101k | 38.9% | 6.5% | 19.0% | 96.6% | 1.2% | 15.9% |
| No electorate (water or unpopulated land) | 33 | 27 | 56.9% | 10.2% | 29.1% | 1.9% | $90k | 50.9% | 17.9% | 20.6% | 90.6% | 9.6% | 4.5% |
| No electorate (water or unpopulated land) | 41 | 27 | 16.5% | 4.6% | 70.4% | 0.3% | $58k | 17.4% | 39.2% | 6.3% | 25.3% | 27.1% | 2.3% |
| No electorate (water or unpopulated land) | 26 | 20 | 5.3% | 8.0% | 68.9% | 0.4% | $63k | 17.8% | 15.9% | 13.7% | 57.4% | 9.8% | 1.9% |
| No electorate (water or unpopulated land) | 34 | 27 | 74.0% | 3.1% | 13.6% | 1.5% | $81k | 24.6% | 15.3% | 22.6% | 79.3% | 16.1% | 0.0% |
| No electorate (water or unpopulated land) | 66 | 49 | 14.7% | 19.3% | 62.6% | 0.2% | $45k | 25.0% | 13.6% | 29.1% | 38.0% | 30.3% | 13.1% |
| No electorate (water or unpopulated land) | 21 | 14 | 76.7% | 7.3% | 12.2% | 0.7% | $157k | 51.2% | 16.6% | 10.9% | 92.9% | 2.1% | 9.4% |
| No electorate (water or unpopulated land) | 18 | 13 | 33.8% | 7.7% | 54.4% | 1.1% | $109k | 34.8% | 8.0% | 11.9% | 71.0% | 4.5% | 0.5% |
| No electorate (water or unpopulated land) | 773 | 633 | 76.5% | 10.1% | 7.6% | 1.1% | $93k | 31.9% | 10.6% | 24.2% | 80.6% | 5.1% | 7.5% |
| No electorate (water or unpopulated land) | 35 | 28 | 74.0% | 3.1% | 13.6% | 1.5% | $81k | 24.6% | 15.3% | 22.6% | 79.3% | 16.1% | 0.0% |
| No electorate (water or unpopulated land) | 37 | 31 | 38.2% | 9.2% | 28.1% | 18.0% | $63k | 36.9% | 17.6% | 19.3% | 41.1% | 19.7% | 2.1% |
| No electorate (water or unpopulated land) | 24 | 22 | 47.2% | 7.3% | 37.6% | 1.8% | $69k | 33.7% | 51.4% | 7.2% | 29.4% | 26.1% | 5.6% |
| No electorate (water or unpopulated land) | 60 | 46 | 57.3% | 3.9% | 29.3% | 1.4% | $100k | 17.9% | 16.4% | 15.8% | 97.7% | 10.4% | 0.4% |
| No electorate (water or unpopulated land) | 7 | 6 | 25.8% | 3.3% | 49.7% | 2.5% | $59k | 19.8% | 17.9% | 20.9% | 79.6% | 9.9% | 5.6% |
| No electorate (water or unpopulated land) | 22 | 15 | 48.4% | 2.1% | 41.7% | 3.8% | $88k | 41.1% | 20.8% | 13.2% | 75.3% | 1.7% | 1.8% |
| No electorate (water or unpopulated land) | 15 | 10 | 80.0% | 6.6% | 0.6% | 7.0% | $101k | 38.9% | 6.5% | 19.0% | 96.6% | 1.2% | 15.9% |
| No electorate (water or unpopulated land) | 33 | 27 | 56.9% | 10.2% | 29.1% | 1.9% | $90k | 50.9% | 17.9% | 20.6% | 90.6% | 9.6% | 4.5% |
| No electorate (water or unpopulated land) | 41 | 27 | 16.5% | 4.6% | 70.4% | 0.3% | $58k | 17.4% | 39.2% | 6.3% | 25.3% | 27.1% | 2.3% |
| No electorate (water or unpopulated land) | 26 | 20 | 5.3% | 8.0% | 68.9% | 0.4% | $63k | 17.8% | 15.9% | 13.7% | 57.4% | 9.8% | 1.9% |
| No electorate (water or unpopulated land) | 66 | 49 | 14.7% | 19.3% | 62.6% | 0.2% | $45k | 25.0% | 13.6% | 29.1% | 38.0% | 30.3% | 13.1% |
| Norfolk Highlands | 4,212 | 3,059 | 58.3% | 10.3% | 24.4% | 0.3% | $90k | 31.1% | 16.1% | 15.8% | 59.7% | 14.8% | 2.8% |
| Oaklette | 6,071 | 4,294 | 25.0% | 6.1% | 62.0% | 4.6% | $58k | 21.2% | 40.2% | 8.0% | 42.6% | 27.3% | 1.9% |
| Oscar Smith | 2,101 | 1,825 | 59.8% | 18.1% | 17.9% | 1.2% | $80k | 17.0% | 29.8% | 11.1% | 75.9% | 19.1% | 9.0% |
| Providence | 6,092 | 4,082 | 8.8% | 4.8% | 78.0% | 0.6% | $63k | 26.9% | 21.1% | 10.2% | 28.7% | 30.7% | 2.3% |
| Pughsville (part) | 3,405 | 2,573 | 26.5% | 7.3% | 61.8% | 1.3% | $96k | 31.8% | 12.8% | 13.0% | 66.9% | 7.0% | 0.9% |
| Silverwood | 4,141 | 3,004 | 56.9% | 2.5% | 33.3% | 3.8% | $93k | 40.2% | 17.6% | 18.6% | 83.0% | 1.4% | 3.8% |
| South Norfolk | 2,690 | 1,848 | 9.8% | 21.9% | 60.0% | 0.8% | $62k | 15.5% | 24.3% | 9.2% | 66.7% | 8.6% | 6.3% |
| South Norfolk Rec | 5,696 | 4,512 | 38.3% | 12.3% | 39.1% | 3.5% | $81k | 27.4% | 22.5% | 14.1% | 78.7% | 10.8% | 7.0% |
| St. Julians | 3,285 | 2,592 | 41.9% | 8.6% | 34.1% | 5.2% | $64k | 22.1% | 18.8% | 19.9% | 71.5% | 7.4% | 4.5% |
| Tanglewood | 2,972 | 2,337 | 66.5% | 4.0% | 11.0% | 7.6% | $93k | 24.7% | 18.7% | 16.5% | 82.8% | 11.9% | 1.1% |
| Taylor Road | 2,836 | 2,373 | 31.7% | 2.6% | 49.6% | 8.9% | $92k | 19.3% | 17.5% | 16.8% | 60.9% | 4.6% | 0.1% |
| Westover | 3,608 | 2,972 | 34.1% | 18.9% | 33.5% | 7.1% | $66k | 10.0% | 18.6% | 12.1% | 45.1% | 16.4% | 17.5% |
Portsmouth city: 43 precincts
| Precinct | Population | Voting-age pop. | % White non-Hisp. | % Hispanic | % Black | % Asian | Median income* | % Bachelor's+ | % 18-29 (of adults) | % 65+ | % Homeowners | % Below poverty | % Spanish at home (adults) |
|---|---|---|---|---|---|---|---|---|---|---|---|---|---|
| Brighton Elementary School | 5,038 | 3,734 | 15.4% | 6.1% | 74.3% | 0.4% | $57k | 13.5% | 31.0% | 12.0% | 54.5% | 23.1% | 3.7% |
| Cavalier Manor Recreation Center | 1,920 | 1,760 | 7.9% | 0.7% | 90.3% | 0.0% | $54k | 19.3% | 28.5% | 22.5% | 77.7% | 6.0% | 0.6% |
| Charles A. Fisher Memorial Academy | 2,847 | 2,071 | 16.1% | 3.7% | 71.4% | 0.3% | $33k | 16.3% | 29.3% | 16.1% | 36.0% | 28.3% | 3.1% |
| Churchland Branch Library | 2,746 | 2,075 | 57.6% | 6.8% | 28.6% | 1.4% | $100k | 46.7% | 16.7% | 17.4% | 83.6% | 11.1% | 3.1% |
| Churchland Elementary School | 2,501 | 2,029 | 58.7% | 1.8% | 20.0% | 3.4% | $93k | 31.3% | 10.3% | 23.5% | 86.1% | 7.9% | 1.3% |
| Churchland High School | 4,618 | 3,727 | 49.9% | 0.1% | 38.8% | 4.7% | $92k | 46.0% | 22.2% | 16.7% | 84.2% | 5.0% | 1.5% |
| Churchland Middle School | 4,051 | 3,010 | 46.3% | 12.6% | 38.8% | 0.2% | $71k | 17.9% | 19.9% | 13.7% | 69.0% | 12.6% | 0.0% |
| Churchland Primary and Intermediate School | 4,828 | 3,640 | 34.3% | 9.5% | 44.5% | 2.5% | $92k | 37.6% | 16.9% | 13.9% | 78.4% | 11.6% | 4.6% |
| Cradock Middle School | 2,890 | 1,971 | 37.1% | 14.1% | 42.4% | 1.2% | $47k | 10.2% | 30.9% | 6.3% | 35.7% | 27.2% | 3.0% |
| Emanuel A. M. E. Church | 3,454 | 3,166 | 56.5% | 4.3% | 30.1% | 4.2% | $60k | 43.6% | 25.4% | 19.1% | 24.8% | 21.3% | 0.1% |
| Grove Baptist Church | 6,043 | 4,116 | 23.5% | 8.8% | 58.0% | 2.0% | $65k | 19.7% | 25.3% | 9.5% | 35.8% | 8.5% | 7.7% |
| Hodges Manor Elementary School | 1,508 | 1,361 | 69.2% | 5.1% | 20.3% | 0.9% | $98k | 36.6% | 11.3% | 30.3% | 80.6% | 12.7% | 5.6% |
| John F. Kennedy Community Center | 1,824 | 1,281 | 1.1% | 3.7% | 67.0% | 4.8% | $73k | 14.6% | 18.0% | 13.4% | 45.1% | 23.9% | 0.3% |
| Joseph E. Parker Recreation Center | 2,208 | 1,680 | 3.1% | 3.0% | 84.0% | 0.4% | $30k | 11.0% | 20.5% | 17.7% | 30.0% | 33.7% | 1.3% |
| Lakeview Elementary School | 3,779 | 3,103 | 2.6% | 0.3% | 95.3% | 0.0% | $69k | 21.1% | 12.7% | 25.1% | 87.4% | 4.3% | 0.0% |
| Manor High School | 1,613 | 1,281 | 69.6% | 14.8% | 14.5% | 0.2% | $73k | 19.4% | 9.0% | 16.2% | 68.4% | 12.0% | 8.7% |
| Mount Hermon Preschool Center | 2,234 | 1,641 | 37.4% | 2.3% | 43.3% | 3.6% | $49k | 32.6% | 26.1% | 19.2% | 56.2% | 29.1% | 0.6% |
| No electorate (water or unpopulated land) | 10 | 8 | 48.4% | 6.2% | 37.0% | 3.6% | $103k | 52.0% | 14.2% | 13.7% | 80.4% | 11.3% | 0.0% |
| No electorate (water or unpopulated land) | 531 | 483 | 41.5% | 20.6% | 30.1% | 0.5% | $64k | 13.4% | 69.0% | 8.0% | 78.9% | 37.1% | 0.0% |
| No electorate (water or unpopulated land) | 48 | 42 | 56.3% | 2.0% | 29.0% | 5.7% | $64k | 30.6% | 29.4% | 23.3% | 62.7% | 15.9% | 0.2% |
| No electorate (water or unpopulated land) | 31 | 21 | 69.4% | 15.5% | 12.9% | 0.2% | $108k | 15.8% | 21.6% | 4.3% | 93.0% | 0.4% | 0.1% |
| No electorate (water or unpopulated land) | 10 | 7 | 8.0% | 1.2% | 84.6% | 1.1% | $22k | 24.6% | 14.0% | 24.1% | 16.1% | 59.8% | 1.7% |
| No electorate (water or unpopulated land) | 10 | 9 | 45.4% | 6.5% | 33.9% | 3.3% | $59k | 49.7% | 35.5% | 11.9% | 14.9% | 10.6% | 0.0% |
| No electorate (water or unpopulated land) | 10 | 8 | 48.4% | 6.2% | 37.0% | 3.6% | $103k | 52.0% | 14.2% | 13.7% | 80.4% | 11.3% | 0.0% |
| No electorate (water or unpopulated land) | 531 | 483 | 41.5% | 20.6% | 30.1% | 0.5% | $64k | 13.4% | 69.0% | 8.0% | 78.9% | 37.1% | 0.0% |
| No electorate (water or unpopulated land) | 48 | 42 | 56.3% | 2.0% | 29.0% | 5.7% | $64k | 30.6% | 29.4% | 23.3% | 62.7% | 15.9% | 0.2% |
| No electorate (water or unpopulated land) | 10 | 7 | 8.0% | 1.2% | 84.6% | 1.1% | $22k | 24.6% | 14.0% | 24.1% | 16.1% | 59.8% | 1.7% |
| No electorate (water or unpopulated land) | 31 | 21 | 69.4% | 15.5% | 12.9% | 0.2% | $108k | 15.8% | 21.6% | 4.3% | 93.0% | 0.4% | 0.1% |
| No electorate (water or unpopulated land) | 10 | 9 | 45.4% | 6.5% | 33.9% | 3.3% | $59k | 49.7% | 35.5% | 11.9% | 14.9% | 10.6% | 0.0% |
| Noble Street Baptist Church | 2,753 | 2,015 | 19.4% | 6.7% | 53.3% | 2.1% | $65k | 24.6% | 25.2% | 13.9% | 83.1% | 23.3% | 1.1% |
| Park View Elementary School | 2,812 | 2,276 | 43.7% | 7.1% | 41.3% | 0.6% | $60k | 24.7% | 36.2% | 12.7% | 39.3% | 11.9% | 2.1% |
| Pinecrest Baptist Church | 1,167 | 952 | 77.3% | 18.3% | 3.8% | 0.0% | $73k | 18.3% | 8.0% | 21.4% | 71.5% | 4.2% | 12.5% |
| St. Mark Deliverance Center | 3,396 | 2,280 | 34.0% | 7.3% | 47.8% | 5.0% | $67k | 19.4% | 22.9% | 11.8% | 58.0% | 23.6% | 9.3% |
| St. Mark Missionary Baptist Church | 2,583 | 1,838 | 2.1% | 3.9% | 83.7% | 2.4% | $56k | 10.5% | 25.5% | 9.3% | 28.5% | 40.3% | 2.4% |
| The Rescue Church | 2,289 | 1,785 | 79.5% | 0.1% | 12.0% | 0.0% | $84k | 23.4% | 12.7% | 17.0% | 84.3% | 11.0% | 0.1% |
| The Senior Station | 2,221 | 1,524 | 46.5% | 0.3% | 41.1% | 1.1% | $48k | 28.3% | 20.0% | 13.7% | 50.5% | 24.7% | 0.9% |
| Third Baptist Church | 4,021 | 3,333 | 25.7% | 4.6% | 66.2% | 1.0% | $57k | 30.0% | 15.3% | 20.3% | 49.0% | 25.6% | 2.5% |
| Victory Elementary School | 2,107 | 1,651 | 44.1% | 6.8% | 38.7% | 0.0% | $86k | 14.2% | 31.0% | 8.1% | 70.0% | 8.0% | 3.5% |
| Victory Life Fellowship | 5,038 | 3,983 | 34.2% | 3.9% | 54.1% | 0.2% | $48k | 9.6% | 28.6% | 8.8% | 43.4% | 18.7% | 4.0% |
| Waterivew Elementary School | 3,038 | 2,460 | 52.5% | 2.3% | 34.8% | 1.1% | $56k | 29.5% | 19.4% | 17.8% | 66.5% | 19.9% | 0.6% |
| West Park Church of Christ | 4,717 | 3,675 | 38.0% | 3.7% | 51.0% | 0.0% | $45k | 14.6% | 21.9% | 17.9% | 38.0% | 21.5% | 0.2% |
| Westhaven Baptist Church | 2,604 | 1,781 | 60.8% | 1.2% | 15.9% | 5.1% | $69k | 26.8% | 19.9% | 13.6% | 63.0% | 18.7% | 1.0% |
| William E. Waters Middle School | 2,512 | 2,053 | 7.3% | 1.5% | 88.2% | 0.0% | $59k | 25.4% | 22.5% | 22.2% | 80.0% | 12.7% | 1.4% |
*Median income is approximate (see note above). ACS 2020-2024 5-year.
Nonpartisan voter information. GOTV Polling does not endorse any candidate.