
Virginia's 4th Congressional District
U.S. House · Virginia · District 4 · General election: Tuesday, November 3, 2026
Candidates on the November 3 ballot
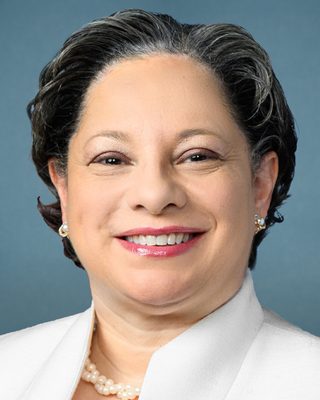 Jennifer L. McClellanDemocraticIncumbentPhoto: U.S. Congress
 Robert P. "Family Man" Murray, Jr.RepublicanPhoto: murrayforcongress.com
- Joan E. "Andrews" BellIndependent
Source: Virginia Department of Elections, candidate list, November 3, 2026 General Election, federal offices, certified list (list retrieved 2026-10-30; retrieved 2026-10-30). Order of names does not reflect ballot order. Incumbent tags appear only where the official list marks incumbents. Photos come from the Candidate Alerts database where one is on file; otherwise initials are shown.
Federal campaign finance filings for this seat: FEC election page (FEC registration is not the same as ballot qualification).
Certified candidates
- Jennifer L. McClellan DemocraticIncumbent @RepMcClellan Website
- Robert P. Murray Republican Website
- Joan E. Bell UN
Certified candidate list from Candidate Alerts, as of 2026-09-24, based on Virginia Department of Elections. Includes candidates the database marks as on the November 3 ballot. Incumbent tags here follow the database.
Past election results
| Candidate | Party | Votes | Share |
|---|---|---|---|
| Jennifer L. McClellan | Democratic | 252,885 | 67.3% |
| William J. "Bill" Moher III | Republican | 121,814 | 32.4% |
| Write-In | 809 | 0.2% | |
| Total | 375,508 |
Source: Virginia Department of Elections, official election results (Enhanced Voting media export, by locality and precinct). Status: Official, Virginia Department of Elections ENR media export (created 2025-03-05, after State Board certification Dec 2 2024)
| Candidate | Party | Votes | Share |
|---|---|---|---|
| A. Donald McEachin | Democratic | 159,044 | 64.9% |
| Leon Benjamin Sr. | Republican | 85,503 | 34.9% |
| Write In | Wri | 431 | 0.2% |
| Total | 244,978 |
Source: Virginia Department of Elections, official results site (results.elections.virginia.gov), results by precinct JSON. Status: Official results (all reporting stages 'Certified'), Virginia Department of Elections official results site
Held under the district lines in effect at the time. Those boundaries differ from the 2026 district.
| Candidate | Party | Votes | Share |
|---|---|---|---|
| A. Donald McEachin | Democratic | 241,142 | 61.6% |
| Leon Benjamin, Sr | Republican | 149,625 | 38.2% |
| Write-Ins | 578 | 0.1% | |
| Total | 391,345 |
Source: Virginia Department of Elections, Historical Elections Database (historical.elections.virginia.gov). Status: Certified, Virginia Department of Elections Historical Elections Database (official certified results by locality and precinct; State Board of Elections certification)
Certified results from state or county election authorities, as compiled in the Candidate Alerts precinct results database (public API candidatealerts.com/api/district-results). Totals are sums of certified precinct and county-level rows.
Demographics
2020 Census demographics by district are not yet published in this data set.
2 of 249 precincts are above 50%, and 9 are above 25%. Source: Census American Community Survey 2020-2024 5-year block groups, allocated to current precinct shapes by area.
Poll status
Map
Share of adults (18+) who speak Spanish at home, by precinct. Census ACS 2020-2024 5-year estimates on the current precinct layer. Hover a precinct for its value.
District shown in red: U.S. Census Bureau cartographic boundary file for the 119th Congress (cb_2024_us_cd119_500k). These are the lines in effect for 2026 in this state per the Candidate Alerts district registry.
Precinct map: past elections and demographics
Choose a layer above. Hover a precinct for its values.
Precinct results
Certified precinct results on current precinct shapes, grouped by county. 492 precincts. "(part)" marks a precinct only partly inside this district; its full vote is shown, so district sums are approximate and are not the official district total. Elections were held under older lines and are shown on the 2026 district.
| County | 2024 President | 2020 President | ||
|---|---|---|---|---|
| Margin | Votes | Margin | Votes | |
| Richmond city | D+66.0 | 103,570 | D+49.7 | 37,753 |
| Chesterfield County | D+14.8 | 99,263 | R+14.6 | 28,982 |
| Henrico County | D+45.9 | 76,093 | D+20.1 | 29,665 |
| Prince George County | R+21.7 | 17,200 | R+42.2 | 7,158 |
| Dinwiddie County | R+23.2 | 15,327 | R+41.0 | 6,750 |
| Petersburg city | D+72.7 | 12,695 | D+67.6 | 4,689 |
| Hopewell city | D+13.4 | 8,793 | R+1.1 | 4,101 |
| Colonial Heights city | R+32.9 | 8,746 | R+46.0 | 3,372 |
| Brunswick County | D+8.4 | 7,638 | R+6.5 | 3,757 |
| Sussex County | D+4.2 | 4,813 | R+2.5 | 2,150 |
| Greensville County | D+9.1 | 4,247 | R+4.4 | 2,367 |
| Surry County | R+0.5 | 4,388 | R+25.2 | 1,840 |
| Southampton County | R+14.9 | 3,787 | R+29.4 | 2,370 |
| Charles City County | D+10.6 | 4,283 | R+22.6 | 1,572 |
| Emporia city | D+31.0 | 2,154 | D+16.4 | 1,211 |
| All counties (approx.) | D+32.2 | 372,997 | D+10.5 | 137,737 |
Richmond city: 140 precincts
| Precinct | 2024 President | 2020 President | ||
|---|---|---|---|---|
| Margin | Votes | Margin | Votes | |
| 101 - ONE HUNDRED ONE | D+28.3 | 640 | - | - |
| 101 - One Hundred One | - | - | D+33.3 | 426 |
| 102 - ONE HUNDRED TWO | D+20.7 | 1,124 | - | - |
| 102 - One Hundred Two | - | - | R+12.0 | 450 |
| 104 - ONE HUNDRED FOUR | D+18.9 | 1,758 | - | - |
| 104 - One Hundred Four | - | - | R+14.2 | 720 |
| 105 - ONE HUNDRED FIVE | D+41.8 | 1,557 | - | - |
| 105 - One Hundred Five | - | - | D+6.2 | 584 |
| 106 - ONE HUNDRED SIX | R+0.7 | 1,839 | - | - |
| 106 - One Hundred Six | - | - | R+44.1 | 692 |
| 111 - ONE HUNDRED ELEVEN | D+41.3 | 1,528 | - | - |
| 111 - One Hundred Eleven | - | - | R+4.8 | 564 |
| 112 - ONE HUNDRED TWELVE | D+49.4 | 1,268 | - | - |
| 112 - One Hundred Twelve | - | - | D+2.1 | 430 |
| 113 - ONE HUNDRED THIRTEEN | D+72.4 | 2,364 | - | - |
| 113 - One Hundred Thirteen | - | - | D+44.1 | 710 |
| 114 - ONE HUNDRED FOURTEEN | D+67.4 | 2,332 | - | - |
| 114 - One Hundred Fourteen | - | - | D+35.4 | 714 |
| 115 - ONE HUNDRED FIFTEEN | D+16.7 | 1,311 | - | - |
| 115 - One Hundred Fifteen | - | - | R+13.8 | 556 |
| 203 - Two Hundred Three | - | - | D+27.2 | 228 |
| 204 - TWO HUNDRED FOUR | D+66.5 | 1,551 | - | - |
| 204 - Two Hundred Four | - | - | D+41.5 | 629 |
| 206 - TWO HUNDRED SIX | D+68.6 | 875 | - | - |
| 206 - Two Hundred Six | - | - | D+69.2 | 302 |
| 207 - TWO HUNDRED SEVEN | D+67.3 | 2,132 | - | - |
| 207 - Two Hundred Seven | - | - | D+40.5 | 655 |
| 208 - TWO HUNDRED EIGHT | D+68.4 | 2,247 | - | - |
| 208 - Two Hundred Eight | - | - | D+39.8 | 566 |
| 213 - TWO HUNDRED THIRTEEN | D+82.1 | 1,718 | - | - |
| 213 - Two Hundred Thirteen | - | - | D+78.9 | 905 |
| 214 - TWO HUNDRED FOURTEEN | D+78.2 | 943 | - | - |
| 214 - Two Hundred Fourteen | - | - | D+74.9 | 517 |
| 215 - TWO HUNDRED FIFTEEN | D+57.9 | 2,338 | - | - |
| 215 - Two Hundred Fifteen | - | - | D+37.9 | 464 |
| 216 - TWO HUNDRED SIXTEEN | D+80.5 | 399 | - | - |
| 301 - THREE HUNDRED ONE | D+82.1 | 845 | - | - |
| 301 - Three Hundred One | - | - | D+86.2 | 354 |
| 302 - THREE HUNDRED TWO | D+71.2 | 1,017 | - | - |
| 302 - Three Hundred Two | - | - | D+58.4 | 291 |
| 303 - THREE HUNDRED THREE | D+83.7 | 935 | - | - |
| 303 - Three Hundred Three | - | - | D+83.6 | 305 |
| 304 - THREE HUNDRED FOUR | D+83.0 | 1,551 | - | - |
| 304 - Three Hundred Four | - | - | D+87.3 | 473 |
| 305 - THREE HUNDRED FIVE | D+78.5 | 1,538 | - | - |
| 305 - Three Hundred Five | - | - | D+73.1 | 476 |
| 306 - THREE HUNDRED SIX | D+85.3 | 681 | - | - |
| 306 - Three Hundred Six | - | - | D+79.3 | 363 |
| 307 - THREE HUNDRED SEVEN | D+62.5 | 2,839 | - | - |
| 308 - THREE HUNDRED EIGHT | D+64.4 | 1,475 | - | - |
| 308 - Three Hundred Eight | - | - | D+24.5 | 372 |
| 309 - THREE HUNDRED NINE | D+56.5 | 726 | - | - |
| 309 - Three Hundred Nine | - | - | D+13.9 | 361 |
| 310 - THREE HUNDRED TEN | D+81.4 | 311 | - | - |
| 310 - Three Hundred Ten | - | - | D+94.2 | 278 |
| 311 - THREE HUNDRED ELEVEN | D+74.9 | 593 | - | - |
| 402 - FOUR HUNDRED TWO | D+63.4 | 2,932 | - | - |
| 402 - Four Hundred Two | - | - | D+22.0 | 827 |
| 404 - FOUR HUNDRED FOUR | D+62.6 | 1,713 | - | - |
| 404 - Four Hundred Four | - | - | D+35.0 | 722 |
| 409 - FOUR HUNDRED NINE | D+34.2 | 1,700 | - | - |
| 409 - Four Hundred Nine | - | - | R+18.1 | 597 |
| 410 - FOUR HUNDRED TEN | D+49.7 | 1,620 | - | - |
| 410 - Four Hundred Ten | - | - | D+27.4 | 675 |
| 412 - FOUR HUNDRED TWELVE | D+65.5 | 1,836 | - | - |
| 412 - Four Hundred Twelve | - | - | D+41.5 | 619 |
| 413 - FOUR HUNDRED THIRTEEN | D+52.6 | 1,652 | - | - |
| 413 - Four Hundred Thirteen | - | - | D+1.8 | 455 |
| 414 - FOUR HUNDRED FOURTEEN | D+42.3 | 1,855 | - | - |
| 414 - Four Hundred Fourteen | - | - | R+8.4 | 598 |
| 415 - FOUR HUNDRED FIFTEEN | D+39.0 | 1,612 | - | - |
| 415 - Four Hundred Fifteen | - | - | R+13.4 | 508 |
| 501 - FIVE HUNDRED ONE | D+74.2 | 2,093 | - | - |
| 501 - Five Hundred One | - | - | D+50.3 | 670 |
| 503 - FIVE HUNDRED THREE | D+76.6 | 2,001 | - | - |
| 503 - Five Hundred Three | - | - | D+68.8 | 715 |
| 504 - FIVE HUNDRED FOUR | D+75.9 | 2,147 | - | - |
| 504 - Five Hundred Four | - | - | D+66.2 | 910 |
| 505 - FIVE HUNDRED FIVE | D+73.6 | 1,166 | - | - |
| 505 - Five Hundred Five | - | - | D+63.0 | 487 |
| 508 - FIVE HUNDRED EIGHT | D+74.5 | 1,018 | - | - |
| 508 - Five Hundred Eight | - | - | D+45.3 | 424 |
| 509 - FIVE HUNDRED NINE | D+81.0 | 1,164 | - | - |
| 509 - Five Hundred Nine | - | - | D+79.2 | 577 |
| 510 - FIVE HUNDRED TEN | D+77.2 | 1,762 | - | - |
| 510 - Five Hundred Ten | - | - | D+70.7 | 700 |
| 602 - SIX HUNDRED TWO | D+88.8 | 827 | - | - |
| 602 - Six Hundred Two | - | - | D+86.9 | 504 |
| 603 - SIX HUNDRED THREE | D+83.6 | 925 | - | - |
| 603 - Six Hundred Three | - | - | D+84.2 | 551 |
| 604 - SIX HUNDRED FOUR | D+80.3 | 1,039 | - | - |
| 604 - Six Hundred Four | - | - | D+80.9 | 446 |
| 606 - SIX HUNDRED SIX | D+85.5 | 1,638 | - | - |
| 606 - Six Hundred Six | - | - | D+83.5 | 588 |
| 607 - SIX HUNDRED SEVEN | D+65.7 | 1,503 | - | - |
| 607 - Six Hundred Seven | - | - | D+49.1 | 528 |
| 609 - SIX HUNDRED NINE | D+71.5 | 1,725 | - | - |
| 609 - Six Hundred Nine | - | - | D+64.4 | 1,017 |
| 610 - SIX HUNDRED TEN | D+85.2 | 867 | - | - |
| 610 - Six Hundred Ten | - | - | D+86.0 | 523 |
| 611 - SIX HUNDRED ELEVEN | D+76.6 | 1,377 | - | - |
| 701 - SEVEN HUNDRED ONE | D+86.1 | 763 | - | - |
| 701 - Seven Hundred One | - | - | D+88.4 | 587 |
| 702 - SEVEN HUNDRED TWO | D+82.3 | 1,333 | - | - |
| 702 - Seven Hundred Two | - | - | D+82.5 | 468 |
| 703 - SEVEN HUNDRED THREE | D+80.8 | 1,680 | - | - |
| 703 - Seven Hundred Three | - | - | D+78.5 | 633 |
| 705 - SEVEN HUNDRED FIVE | D+79.2 | 1,486 | - | - |
| 705 - Seven Hundred Five | - | - | D+63.7 | 430 |
| 706 - SEVEN HUNDRED SIX | D+76.4 | 2,174 | - | - |
| 706 - Seven Hundred Six | - | - | D+78.0 | 885 |
| 707 - SEVEN HUNDRED SEVEN | D+77.4 | 2,869 | - | - |
| 707 - Seven Hundred Seven | - | - | D+55.6 | 732 |
| 708 - SEVEN HUNDRED EIGHT | D+72.9 | 1,240 | - | - |
| 708 - Seven Hundred Eight | - | - | D+53.7 | 886 |
| 709 - SEVEN HUNDRED NINE | D+68.6 | 997 | - | - |
| 802 - EIGHT HUNDRED TWO | D+84.6 | 1,094 | - | - |
| 802 - Eight Hundred Two | - | - | D+81.9 | 491 |
| 806 - EIGHT HUNDRED SIX | D+73.1 | 1,307 | - | - |
| 806 - Eight Hundred Six | - | - | D+65.0 | 466 |
| 810 - EIGHT HUNDRED TEN | D+69.0 | 1,004 | - | - |
| 810 - Eight Hundred Ten | - | - | D+61.6 | 424 |
| 811 - EIGHT HUNDRED ELEVEN | D+73.1 | 1,285 | - | - |
| 811 - Eight Hundred Eleven | - | - | D+76.3 | 616 |
| 812 - EIGHT HUNDRED TWELVE | D+70.9 | 1,923 | - | - |
| 812 - Eight Hundred Twelve | - | - | D+55.9 | 709 |
| 814 - EIGHT HUNDRED FOURTEEN | D+79.3 | 892 | - | - |
| 814 - Eight Hundred Fourteen | - | - | D+72.6 | 369 |
| 902 - NINE HUNDRED TWO | D+80.6 | 454 | - | - |
| 902 - Nine Hundred Two | - | - | D+63.2 | 234 |
| 903 - NINE HUNDRED THREE | D+71.8 | 1,273 | - | - |
| 903 - Nine Hundred Three | - | - | D+64.0 | 594 |
| 908 - NINE HUNDRED EIGHT | D+73.3 | 1,309 | - | - |
| 908 - Nine Hundred Eight | - | - | D+73.8 | 541 |
| 909 - NINE HUNDRED NINE | D+73.7 | 1,398 | - | - |
| 909 - Nine Hundred Nine | - | - | D+62.0 | 623 |
| 910 - NINE HUNDRED TEN | D+71.5 | 1,272 | - | - |
| 910 - Nine Hundred Ten | - | - | D+67.3 | 569 |
| 911 - NINE HUNDRED ELEVEN | D+81.7 | 1,210 | - | - |
| 911 - Nine Hundred Eleven | - | - | D+79.6 | 470 |
Chesterfield County: 82 precincts
| Precinct | 2024 President | 2020 President | ||
|---|---|---|---|---|
| Margin | Votes | Margin | Votes | |
| 101 - BELLWOOD | D+5.8 | 1,608 | - | - |
| 101 - Bellwood | - | - | R+16.9 | 777 |
| 102 - SOUTH CHESTER | D+2.5 | 2,490 | - | - |
| 102 - South Chester | - | - | R+16.5 | 1,067 |
| 103 - ENON | R+0.8 | 4,090 | - | - |
| 103 - Enon | - | - | R+37.9 | 1,434 |
| 104 - NORTH CHESTER | R+7.0 | 3,156 | - | - |
| 104 - North Chester | - | - | R+44.5 | 1,102 |
| 105 - DREWRYS BLUFF | D+21.6 | 1,667 | - | - |
| 105 - Drewrys Bluff | - | - | D+5.5 | 780 |
| 106 - HARROWGATE | D+13.9 | 3,576 | - | - |
| 106 - Harrowgate | - | - | R+18.0 | 1,255 |
| 107 - Wells | - | - | R+11.5 | 972 |
| 108 - ECOFF | R+4.1 | 4,352 | - | - |
| 108 - Ecoff | - | - | R+37.1 | 896 |
| 109 - ELIZABETH SCOTT | D+7.8 | 4,222 | - | - |
| 109 - Elizabeth Scott | - | - | R+27.3 | 1,360 |
| 110 - DUTCH GAP | D+4.1 | 1,791 | - | - |
| 110 - Dutch Gap | - | - | R+37.7 | 738 |
| 111 - IRON BRIDGE | R+9.8 | 2,434 | - | - |
| 111 - Iron Bridge | - | - | R+39.1 | 453 |
| 112 - CARVER | D+10.4 | 2,251 | - | - |
| 112 - Carver | - | - | R+17.3 | 670 |
| 113 - IRON BRIDGE NORTH | D+18.9 | 2,502 | - | - |
| 113 - Iron Bridge North | - | - | R+14.6 | 535 |
| 115 - CRESTHILL | D+15.1 | 2,832 | - | - |
| 201 - GATES | R+20.5 | 786 | - | - |
| 201 - Gates | - | - | R+29.9 | 670 |
| 202 - BEULAH | D+37.1 | 3,141 | - | - |
| 202 - Beulah | - | - | D+5.3 | 773 |
| 203 - BIRD | D+22.0 | 2,519 | - | - |
| 204 - Jacobs | - | - | R+28.5 | 541 |
| 205 - FALLING CREEK | D+39.2 | 2,516 | - | - |
| 205 - Falling Creek | - | - | D+23.8 | 555 |
| 206 - Belmont | - | - | D+56.4 | 500 |
| 207 - CHIPPENHAM | D+53.3 | 3,276 | - | - |
| 208 - MEADOWBROOK | D+44.6 | 2,598 | - | - |
| 208 - Meadowbrook | - | - | D+20.4 | 539 |
| 209 - SALEM CHURCH | D+7.4 | 2,648 | - | - |
| 209 - Salem Church | - | - | R+23.6 | 1,059 |
| 210 - FIVE FORKS | D+37.2 | 3,950 | - | - |
| 210 - Five Forks | - | - | R+0.9 | 863 |
| 211 - NASH | R+9.1 | 4,300 | - | - |
| 211 - Nash | - | - | R+55.3 | 810 |
| 212 - St. Luke's | - | - | R+26.2 | 458 |
| 213 - SOUTHSIDE | D+53.1 | 1,553 | - | - |
| 213 - Southside | - | - | D+31.5 | 362 |
| 214 - Hopkins | - | - | D+64.4 | 132 |
| 215 - North Bird | - | - | D+13.4 | 336 |
| 216 - Ridgedale | - | - | D+39.5 | 509 |
| 218 - NEW MANCHESTER | D+18.5 | 1,305 | - | - |
| 219 - GATES EAST | D+5.1 | 1,264 | - | - |
| 220 - FALLING CREEK EAST | D+32.7 | 318 | - | - |
| 221 - OXBRIDGE | D+14.2 | 3,317 | - | - |
| 222 - TURNER | D+54.3 | 2,018 | - | - |
| 301 - ETTRICK | D+42.6 | 2,373 | - | - |
| 301 - Ettrick | - | - | D+43.3 | 631 |
| 303 - MATOACA | R+4.7 | 3,444 | - | - |
| 303 - Matoaca | - | - | R+37.1 | 839 |
| 305 - BEACH | R+44.3 | 1,096 | - | - |
| 305 - Beach | - | - | R+66.6 | 437 |
| 314 - LONGHOUSE | R+39.0 | 1,734 | - | - |
| 314 - Longhouse | - | - | R+72.6 | 452 |
| 402 - GENITO (0000,0001) | D+9.0 | 2,582 | - | - |
| 402 - Genito | - | - | R+24.4 | 315 |
| 404 - PROVIDENCE | D+23.6 | 2,507 | - | - |
| 404 - Providence | - | - | R+12.0 | 699 |
| 405 - LA PRADE | D+8.5 | 2,687 | - | - |
| 405 - La Prade | - | - | R+30.4 | 483 |
| 408 - REAMS | D+29.7 | 1,519 | - | - |
| 408 - Reams | - | - | R+7.3 | 758 |
| 409 - Manchester | - | - | R+2.1 | 620 |
| 414 - CRENSHAW | R+1.5 | 4,266 | - | - |
| 414 - Crenshaw | - | - | R+29.4 | 1,308 |
| 501 - Huguenot (part) | - | - | R+10.4 | 771 |
| 513 - BEAUFONT | D+40.7 | 1,377 | - | - |
| 513 - Beaufont | - | - | D+22.8 | 447 |
| 515 - DAVIS | D+54.2 | 2,095 | - | - |
| 515 - Davis | - | - | D+36.2 | 690 |
| 516 - POCOSHOCK NORTH | D+38.9 | 856 | - | - |
| 516 - Pocoshock | - | - | D+16.8 | 386 |
| 519 - BUFORD | D+38.9 | 247 | - | - |
Henrico County: 82 precincts
| Precinct | 2024 President | 2020 President | ||
|---|---|---|---|---|
| Margin | Votes | Margin | Votes | |
| 102 - DUMBARTON | D+39.4 | 2,411 | - | - |
| 102 - Dumbarton | - | - | D+27.8 | 908 |
| 104 - GREENDALE | D+18.2 | 1,149 | - | - |
| 105 - Greendale | - | - | R+1.7 | 1,206 |
| 105 - HERMITAGE (0001,0000) | D+19.1 | 2,715 | - | - |
| 106 - HOLLADAY | D+8.2 | 1,235 | - | - |
| 106 - Hermitage | - | - | R+5.4 | 1,095 |
| 109 - JOHNSON | D+28.5 | 1,853 | - | - |
| 110 - Johnson | - | - | D+15.3 | 1,221 |
| 111 - Lakeside | - | - | R+7.0 | 1,365 |
| 111 - MAUDE TREVVETT | D+39.6 | 2,821 | - | - |
| 115 - WESTWOOD | D+31.6 | 1,786 | - | - |
| 117 - Westwood | - | - | R+5.4 | 709 |
| 201 - AZALEA | D+77.1 | 2,227 | - | - |
| 201 - Adams | - | - | D+77.7 | 524 |
| 202 - Azalea | - | - | D+74.6 | 1,069 |
| 202 - BELMONT | D+44.6 | 2,933 | - | - |
| 203 - BROOKLAND | D+15.4 | 1,118 | - | - |
| 203 - Belmont | - | - | D+15.3 | 955 |
| 204 - CANTERBURY | D+32.3 | 610 | - | - |
| 205 - CENTRAL GARDENS | D+87.5 | 1,908 | - | - |
| 205 - Canterbury | - | - | R+25.1 | 263 |
| 206 - CHAMBERLAYNE | D+52.2 | 2,099 | - | - |
| 206 - Central Gardens | - | - | D+88.1 | 703 |
| 207 - Chamberlayne | - | - | D+22.1 | 802 |
| 207 - EASTBOURNE | D+86.1 | 875 | - | - |
| 208 - Fairfield | - | - | D+82.8 | 587 |
| 209 - FAIRFIELD | D+85.4 | 1,267 | - | - |
| 209 - Glen Lea | - | - | D+52.4 | 563 |
| 210 - GLEN LEA | D+70.6 | 1,601 | - | - |
| 211 - Highland Gardens | - | - | D+81.3 | 321 |
| 212 - HIGHLAND GARDENS | D+85.0 | 1,231 | - | - |
| 213 - Hungary | - | - | D+37.4 | 562 |
| 214 - HUNGARY (0000,0001) | D+53.3 | 1,378 | - | - |
| 215 - LAKESIDE | D+33.7 | 3,114 | - | - |
| 215 - Maplewood | - | - | D+78.2 | 752 |
| 216 - Moody | - | - | R+11.1 | 431 |
| 217 - MAPLEWOOD | D+85.3 | 2,251 | - | - |
| 218 - MOODY | D+24.7 | 774 | - | - |
| 220 - Ratcliffe | - | - | D+79.5 | 971 |
| 221 - Stratford Hall | - | - | R+19.1 | 162 |
| 222 - Wilder | - | - | D+35.4 | 512 |
| 223 - RATCLIFFE | D+83.2 | 2,560 | - | - |
| 224 - Essex Village | - | - | D+89.5 | 363 |
| 225 - WILDER | D+64.0 | 1,623 | - | - |
| 501 - ADAMS | D+75.5 | 1,904 | - | - |
| 501 - Antioch | - | - | R+66.2 | 1,036 |
| 502 - ANTIOCH | R+36.2 | 1,629 | - | - |
| 502 - Cedar Fork | - | - | D+55.9 | 415 |
| 503 - CEDAR FORK | D+73.6 | 1,412 | - | - |
| 503 - Chickahominy | - | - | R+35.4 | 854 |
| 504 - CHICKAHOMINY | D+8.3 | 2,020 | - | - |
| 504 - Donahoe | - | - | D+6.2 | 674 |
| 505 - DONAHOE | D+38.0 | 1,454 | - | - |
| 505 - Dorey | - | - | R+20.8 | 893 |
| 506 - DOREY | D+29.3 | 2,658 | - | - |
| 506 - Eanes | - | - | D+30.0 | 811 |
| 507 - EANES | D+56.1 | 2,491 | - | - |
| 507 - Elko | - | - | R+71.0 | 420 |
| 508 - ELKO | R+57.3 | 640 | - | - |
| 508 - Highland Springs | - | - | D+54.1 | 671 |
| 509 - HIGHLAND SPRINGS | D+64.7 | 1,520 | - | - |
| 509 - Laburnum | - | - | D+33.0 | 625 |
| 510 - LABURNUM | D+51.5 | 1,594 | - | - |
| 510 - Mehfoud | - | - | D+15.1 | 680 |
| 511 - MEHFOUD | D+43.5 | 1,767 | - | - |
| 511 - Montrose | - | - | D+61.5 | 890 |
| 512 - MONTROSE | D+69.3 | 1,984 | - | - |
| 512 - Nine Mile | - | - | D+12.1 | 519 |
| 513 - NINE MILE | D+30.3 | 983 | - | - |
| 513 - Pleasants | - | - | D+69.5 | 942 |
| 514 - PLEASANTS | D+77.5 | 2,384 | - | - |
| 514 - Rolfe | - | - | D+65.8 | 806 |
| 515 - ROLFE | D+78.1 | 2,783 | - | - |
| 515 - Sandston | - | - | R+44.7 | 1,091 |
| 516 - SANDSTON | R+17.9 | 1,690 | - | - |
| 516 - Sullivans | - | - | D+26.0 | 904 |
| 517 - SULLIVANS | D+53.7 | 2,881 | - | - |
| 517 - Town Hall | - | - | R+39.7 | 443 |
| 518 - TOWN HALL | R+11.6 | 847 | - | - |
| 518 - Whitlocks | - | - | R+50.9 | 947 |
| 519 - WHITLOCKS | R+4.8 | 1,913 | - | - |
Prince George County: 20 precincts
| Precinct | 2024 President | 2020 President | ||
|---|---|---|---|---|
| Margin | Votes | Margin | Votes | |
| 101 - RICHARD BLAND | R+24.9 | 1,064 | - | - |
| 101 - Richard Bland | - | - | R+47.4 | 553 |
| 102 - TEMPLETON | R+54.2 | 3,024 | - | - |
| 102 - Templeton | - | - | R+68.0 | 1,455 |
| 103 - UNION BRANCH | R+21.0 | 1,756 | - | - |
| 103 - Union Branch | - | - | R+39.6 | 843 |
| 104 - RIVES | D+1.3 | 1,194 | - | - |
| 104 - Rives | - | - | R+19.1 | 507 |
| 105 - HARRISON | R+61.2 | 760 | - | - |
| 105 - Harrison | - | - | R+64.6 | 390 |
| 201 - BLAND | R+22.4 | 2,952 | - | - |
| 201 - Bland | - | - | R+51.4 | 777 |
| 202 - BLACKWATER | R+31.9 | 1,903 | - | - |
| 202 - Black Water | - | - | R+47.1 | 869 |
| 203 - BRANDON | R+44.6 | 725 | - | - |
| 203 - Brandon | - | - | R+58.0 | 438 |
| 204 - COURTS | D+9.7 | 2,259 | - | - |
| 204 - Courts Bldg | - | - | R+19.1 | 671 |
| 205 - JEFFERSON PARK | D+23.4 | 1,563 | - | - |
| 205 - Jefferson Park | - | - | D+15.9 | 655 |
Dinwiddie County: 26 precincts
| Precinct | 2024 President | 2020 President | ||
|---|---|---|---|---|
| Margin | Votes | Margin | Votes | |
| 101 - WHITE OAK | R+60.7 | 595 | - | - |
| 101 - White Oak | - | - | R+75.5 | 421 |
| 102 - ROCKY RUN | R+49.1 | 1,022 | - | - |
| 102 - Rocky Run | - | - | R+69.9 | 471 |
| 103 - CHURCH ROAD | R+69.1 | 1,539 | - | - |
| 103 - Church Road | - | - | R+81.6 | 721 |
| 201 - ROHOIC | D+14.1 | 807 | - | - |
| 201 - Rohoic | - | - | R+6.0 | 400 |
| 202 - SUTHERLAND | R+27.1 | 2,207 | - | - |
| 202 - Sutherland | - | - | R+47.0 | 892 |
| 301 - REAMS | R+44.8 | 650 | - | - |
| 301 - Reams | - | - | R+56.7 | 423 |
| 302 - NEW HOPE | R+32.9 | 1,091 | - | - |
| 302 - New Hope | - | - | R+57.1 | 511 |
| 303 - LITTLE ZION | R+16.3 | 1,678 | - | - |
| 303 - Little Zion | - | - | R+21.5 | 571 |
| 401 - DINWIDDIE | R+26.2 | 1,667 | - | - |
| 401 - Dinwiddie | - | - | R+54.2 | 570 |
| 402 - MCKENNEY (0000,0001) | R+28.9 | 952 | - | - |
| 402 - Mckenney | - | - | R+36.3 | 466 |
| 403 - CHERRY HILL | R+8.9 | 618 | - | - |
| 403 - Cherry Hill | - | - | R+22.9 | 314 |
| 501 - EDGEHILL | D+40.2 | 649 | - | - |
| 501 - Edgehill | - | - | D+15.4 | 117 |
| 502 - CHESDIN | D+15.5 | 1,852 | - | - |
| 502 - Chesdin | - | - | D+11.5 | 873 |
Petersburg city: 14 precincts
| Precinct | 2024 President | 2020 President | ||
|---|---|---|---|---|
| Margin | Votes | Margin | Votes | |
| 101 - FIRST WARD FIRST PRECINCT | D+71.6 | 1,502 | - | - |
| 101 - First Ward First Precinct | - | - | D+68.3 | 605 |
| 201 - SECOND WARD FIRST PRECINCT | D+78.2 | 2,035 | - | - |
| 201 - Second Ward First Precinct | - | - | D+73.6 | 845 |
| 301 - THIRD WARD FIRST PRECINCT | D+60.8 | 2,360 | - | - |
| 301 - Third Ward First Precinct | - | - | D+46.5 | 761 |
| 401 - FOURTH WARD FIRST PRECINCT | D+62.9 | 1,746 | - | - |
| 401 - Fourth Ward First Precinct | - | - | D+52.5 | 628 |
| 501 - FIFTH WARD FIRST PRECINCT | D+76.1 | 1,512 | - | - |
| 501 - Fifth Ward First Precinct | - | - | D+75.7 | 613 |
| 601 - SIXTH WARD FIRST PRECINCT | D+85.5 | 1,632 | - | - |
| 601 - Sixth Ward First Precinct | - | - | D+88.7 | 591 |
| 701 - SEVENTH WARD FIRST PRECINCT | D+77.6 | 1,908 | - | - |
| 701 - Seventh Ward First Precinct | - | - | D+72.0 | 646 |
Hopewell city: 14 precincts
| Precinct | 2024 President | 2020 President | ||
|---|---|---|---|---|
| Margin | Votes | Margin | Votes | |
| 101 - WARD ONE | D+3.2 | 1,043 | - | - |
| 101 - Ward One | - | - | R+17.4 | 505 |
| 201 - WARD TWO | D+70.3 | 909 | - | - |
| 201 - Ward Two | - | - | D+55.9 | 479 |
| 301 - WARD THREE | R+16.1 | 1,600 | - | - |
| 301 - Ward Three | - | - | R+39.3 | 749 |
| 401 - WARD FOUR | D+9.8 | 1,753 | - | - |
| 401 - Ward Four | - | - | R+7.8 | 742 |
| 501 - WARD FIVE | R+14.1 | 1,326 | - | - |
| 501 - Ward Five | - | - | R+28.5 | 594 |
| 601 - WARD SIX | D+46.7 | 1,060 | - | - |
| 601 - Ward Six | - | - | D+52.5 | 549 |
| 701 - WARD SEVEN | D+25.3 | 1,102 | - | - |
| 701 - Ward Seven | - | - | D+1.4 | 483 |
Colonial Heights city: 10 precincts
| Precinct | 2024 President | 2020 President | ||
|---|---|---|---|---|
| Margin | Votes | Margin | Votes | |
| 001 - FIRST | R+25.0 | 1,220 | - | - |
| 002 - SECOND | R+31.5 | 1,519 | - | - |
| 003 - THIRD | R+26.5 | 1,678 | - | - |
| 004 - FOURTH | R+31.2 | 2,224 | - | - |
| 005 - FIFTH | R+45.3 | 2,105 | - | - |
| 1 - First | - | - | R+40.3 | 643 |
| 2 - Second | - | - | R+44.3 | 630 |
| 3 - Third | - | - | R+39.2 | 673 |
| 4 - Fourth | - | - | R+42.5 | 696 |
| 5 - Fifth | - | - | R+62.2 | 730 |
Brunswick County: 26 precincts
| Precinct | 2024 President | 2020 President | ||
|---|---|---|---|---|
| Margin | Votes | Margin | Votes | |
| 101 - BRODNAX (0000,0001) | D+5.4 | 373 | - | - |
| 101 - Brodnax | - | - | R+14.2 | 254 |
| 102 - ROCK STORE | R+25.9 | 613 | - | - |
| 102 - Rock Store | - | - | R+39.7 | 353 |
| 103 - TILLMAN | R+30.1 | 784 | - | - |
| 103 - Tillman | - | - | R+39.8 | 442 |
| 201 - DROMGOOLE | R+8.1 | 236 | - | - |
| 201 - Dromgoole | - | - | R+7.6 | 144 |
| 202 - EDGERTON | D+45.3 | 688 | - | - |
| 202 - Edgerton | - | - | D+36.0 | 272 |
| 203 - FITZHUGH | D+12.1 | 604 | - | - |
| 203 - Fitzhugh | - | - | D+20.5 | 317 |
| 301 - ALBERTA | D+6.8 | 148 | - | - |
| 301 - Alberta | - | - | R+6.3 | 111 |
| 302 - DANIELTOWN | R+18.6 | 720 | - | - |
| 302 - Danieltown | - | - | R+35.6 | 399 |
| 303 - ELMORE | R+8.7 | 369 | - | - |
| 303 - Elmore | - | - | R+23.1 | 195 |
| 304 - SEYMOUR | R+10.7 | 338 | - | - |
| 304 - Seymour | - | - | R+20.0 | 235 |
| 401 - STURGEON | D+12.9 | 1,109 | - | - |
| 401 - Sturgeon | - | - | D+0.0 | 482 |
| 402 - KING'S STORE | D+39.0 | 359 | - | - |
| 402 - King's Store | - | - | D+25.3 | 186 |
| 501 - TOTARO (1420B,1420A,0000) | D+43.2 | 1,297 | - | - |
| 501 - Totaro | - | - | D+41.1 | 367 |
Sussex County: 19 precincts
| Precinct | 2024 President | 2020 President | ||
|---|---|---|---|---|
| Margin | Votes | Margin | Votes | |
| 101 - WAVERLY | D+61.1 | 614 | - | - |
| 101 - Waverly | - | - | D+52.9 | 437 |
| 201 - STONY CREEK (2360,0000) | D+14.9 | 720 | - | - |
| 201 - Stony Creek | - | - | D+7.4 | 312 |
| 202 - Little Mill | - | - | D+7.8 | 115 |
| 301 - COURTHOUSE | R+29.0 | 286 | - | - |
| 301 - Courthouse | - | - | R+58.0 | 307 |
| 302 - NEWVILLE ONE | R+44.0 | 209 | - | - |
| 302 - Wakefield | - | - | R+73.1 | 145 |
| 401 - WAKEFIELD FIREHOUSE (2560,0000) | R+4.1 | 796 | - | - |
| 402 - West Wakefield | - | - | D+57.9 | 57 |
| 501 - HENRY (1340,0000) | D+10.4 | 685 | - | - |
| 501 - Henry | - | - | D+15.5 | 343 |
| 502 - Yale | - | - | R+4.9 | 142 |
| 601 - BLACKWATER (0002,0003) | R+6.6 | 587 | - | - |
| 601 - Blackwater | - | - | R+38.0 | 292 |
| 602 - WAKEFIELD | R+23.1 | 195 | - | - |
| 701 - YALE | R+15.1 | 476 | - | - |
| 702 - NEWVILLE TWO | D+5.3 | 245 | - | - |
Greensville County: 17 precincts
| Precinct | 2024 President | 2020 President | ||
|---|---|---|---|---|
| Margin | Votes | Margin | Votes | |
| 101 - PRECINCT 1-A | D+19.9 | 357 | - | - |
| 101 - Precinct 1-a | - | - | D+10.3 | 319 |
| 102 - PRECINCT 1-B | R+27.3 | 187 | - | - |
| 102 - Precinct 1-b | - | - | R+46.5 | 142 |
| 103 - PRECINCT 1-C | D+41.4 | 478 | - | - |
| 201 - PRECINCT 2-A | D+38.0 | 497 | - | - |
| 201 - Precinct 2-a | - | - | D+31.6 | 313 |
| 202 - PRECINCT 2-B | R+25.0 | 689 | - | - |
| 202 - Precinct 2-b | - | - | R+41.0 | 422 |
| 302 - PRECINCT 3-A | D+45.7 | 792 | - | - |
| 302 - Precinct 3-a | - | - | D+18.4 | 501 |
| 401 - PRECINCT 4-A | R+40.3 | 315 | - | - |
| 401 - Precinct 4-a | - | - | R+53.1 | 211 |
| 402 - PRECINCT 4-B (0001,0000) | D+12.0 | 515 | - | - |
| 402 - Precinct 4-b | - | - | D+15.7 | 318 |
| 403 - PRECINCT 4-C | R+34.5 | 417 | - | - |
| 403 - Precinct 4-c | - | - | R+19.9 | 141 |
Surry County: 13 precincts
| Precinct | 2024 President | 2020 President | ||
|---|---|---|---|---|
| Margin | Votes | Margin | Votes | |
| 101 - SURRY (2400,0000) | R+24.2 | 952 | - | - |
| 101 - Surry | - | - | R+52.3 | 281 |
| 201 - BACONS CASTLE | D+14.5 | 867 | - | - |
| 201 - Bacons Castle | - | - | R+25.6 | 367 |
| 301 - DENDRON (0740,0000) | D+0.7 | 882 | - | - |
| 301 - Dendron | - | - | R+17.5 | 234 |
| 302 - Walls Bridge | - | - | R+32.0 | 200 |
| 401 - CARSLEY | D+0.1 | 897 | - | - |
| 401 - Carsley | - | - | R+14.5 | 358 |
| 501 - CLAREMONT (0000,0510) | R+13.3 | 540 | - | - |
| 501 - Claremont | - | - | R+36.0 | 308 |
| 502 - SPRING GROVE | D+58.4 | 250 | - | - |
| 502 - Spring Grove | - | - | D+48.9 | 92 |
Southampton County: 10 precincts
| Precinct | 2024 President | 2020 President | ||
|---|---|---|---|---|
| Margin | Votes | Margin | Votes | |
| 201 - BOYKINS-BRANCHVILLE (0270,0000,0280) | D+5.4 | 1,001 | - | - |
| 201 - Boykins | - | - | R+2.9 | 551 |
| 202 - Branchville | - | - | R+34.9 | 218 |
| 301 - CAPRON-DREWRYVILLE (0410,0000) | R+28.4 | 1,096 | - | - |
| 301 - Capron | - | - | R+24.9 | 357 |
| 302 - SEBRELL | R+28.0 | 792 | - | - |
| 302 - Sebrell | - | - | R+50.4 | 393 |
| 401 - Drewryville | - | - | R+22.7 | 374 |
| 702 - NEWSOMS (0000,1740) | R+9.5 | 898 | - | - |
| 702 - Newsoms (part) | - | - | R+48.6 | 477 |
Charles City County: 6 precincts
| Precinct | 2024 President | 2020 President | ||
|---|---|---|---|---|
| Margin | Votes | Margin | Votes | |
| 101 - PRECINCT 1-1 | R+1.8 | 1,520 | - | - |
| 101 - Precinct 1-1 | - | - | R+37.5 | 667 |
| 201 - PRECINCT 2-1 | D+19.3 | 1,338 | - | - |
| 201 - Precinct 2-1 | - | - | R+12.8 | 438 |
| 301 - PRECINCT 3-1 | D+15.7 | 1,425 | - | - |
| 301 - Precinct 3-1 | - | - | R+10.5 | 467 |
Emporia city: 13 precincts
| Precinct | 2024 President | 2020 President | ||
|---|---|---|---|---|
| Margin | Votes | Margin | Votes | |
| 101 - PRECINCT 1-1 | D+32.2 | 382 | - | - |
| 101 - Precinct 1-1 | - | - | D+40.2 | 234 |
| 201 - PRECINCT 2-1 | D+63.4 | 227 | - | - |
| 301 - PRECINCT 3-1 | D+15.3 | 353 | - | - |
| 301 - Precinct 3-1 | - | - | R+4.9 | 204 |
| 401 - PRECINCT 4-1 | D+17.2 | 354 | - | - |
| 401 - Precinct 4-1 | - | - | R+2.9 | 239 |
| 501 - PRECINCT 5-1 | D+86.2 | 218 | - | - |
| 501 - Precinct 5-1 | - | - | D+86.6 | 127 |
| 601 - DISTRICT 6 | R+8.1 | 396 | - | - |
| 601 - District 6 | - | - | R+30.2 | 222 |
| 701 - DISTRICT 7 | D+57.6 | 224 | - | - |
| 701 - District 7 | - | - | D+42.2 | 185 |
2024 President (Kamala D. Harris vs. Donald J. Trump). Source: Virginia Department of Elections, official election results (Enhanced Voting media export, by locality and precinct). Official, Virginia Department of Elections ENR media export (created 2025-03-05, after State Board certification Dec 2 2024).
2020 President (Joseph Robinette Biden, Jr vs. Donald J. Trump). Source: Virginia Department of Elections, Historical Elections Database (historical.elections.virginia.gov). Certified, Virginia Department of Elections Historical Elections Database (official certified results by locality and precinct; State Board of Elections certification).
Precinct demographics
Demographics are Census American Community Survey (ACS) 2020-2024 5-year estimates for block groups, assigned to precincts by area share. They describe the resident population, not registered or likely voters, and include non-citizens. ACS margins of error are not shown; small precincts carry large error. Area weighting assumes people are spread evenly within each block group, so large rural precincts are the least reliable. Median income is a household-weighted average of block-group medians, an approximation.
| Area | Population | Voting-age pop. | % White non-Hisp. | % Hispanic | % Black | % Asian | Median income* | % Bachelor's+ | % 18-29 (of adults) | % 65+ | % Homeowners | % Below poverty | % Spanish at home (adults) |
|---|---|---|---|---|---|---|---|---|---|---|---|---|---|
| District | 795,683 | 637,054 | 41.5% | 10.5% | 40.9% | 2.1% | $78k | 33.0% | 22.8% | 16.0% | 59.1% | 13.5% | 7.2% |
| Richmond city (in district) | 229,091 | 188,989 | 41.5% | 10.7% | 40.4% | 2.1% | $75k | 45.7% | 27.1% | 14.0% | 43.5% | 18.2% | 7.2% |
| Chesterfield County (in district) | 207,692 | 161,224 | 44.1% | 16.4% | 31.8% | 2.5% | $93k | 32.5% | 21.3% | 15.4% | 71.9% | 9.3% | 11.7% |
| Henrico County (in district) | 148,035 | 119,266 | 34.3% | 7.7% | 51.0% | 2.6% | $76k | 30.7% | 20.0% | 17.5% | 61.6% | 11.8% | 5.5% |
| Prince George County (in district) | 42,673 | 34,242 | 51.4% | 10.4% | 30.8% | 1.8% | $91k | 25.2% | 31.8% | 13.3% | 74.3% | 9.0% | 5.6% |
| Petersburg city (in district) | 33,573 | 25,547 | 14.4% | 6.5% | 74.1% | 1.3% | $52k | 25.4% | 21.9% | 16.8% | 38.7% | 21.7% | 5.2% |
| Dinwiddie County (in district) | 28,179 | 22,549 | 62.2% | 4.4% | 29.9% | 0.6% | $84k | 19.4% | 16.3% | 19.2% | 79.6% | 11.7% | 3.5% |
| Hopewell city (in district) | 22,756 | 16,984 | 40.7% | 8.9% | 41.6% | 1.1% | $61k | 13.7% | 20.5% | 15.0% | 57.9% | 21.7% | 5.9% |
| Colonial Heights city (in district) | 18,290 | 13,806 | 65.0% | 8.3% | 18.9% | 3.7% | $78k | 28.0% | 16.6% | 18.3% | 68.0% | 7.9% | 4.5% |
| Brunswick County (in district) | 15,839 | 13,415 | 41.2% | 2.9% | 51.5% | 0.6% | $55k | 16.6% | 18.5% | 22.3% | 74.4% | 15.0% | 3.0% |
| Greensville County (in district) | 11,404 | 9,645 | 35.0% | 2.9% | 56.0% | 0.2% | $52k | 14.7% | 19.5% | 16.3% | 65.9% | 14.3% | 2.6% |
| Sussex County (in district) | 10,780 | 9,083 | 40.8% | 1.1% | 54.0% | 0.5% | $67k | 16.5% | 20.9% | 19.2% | 69.8% | 11.6% | 1.0% |
| Southampton County (in district) | 8,736 | 7,223 | 55.2% | 4.9% | 31.3% | 0.2% | $76k | 17.5% | 14.1% | 19.7% | 76.2% | 7.8% | 1.9% |
| Charles City County (in district) | 6,648 | 5,702 | 44.7% | 2.1% | 40.4% | 1.1% | $80k | 17.4% | 13.3% | 26.8% | 86.3% | 9.4% | 1.2% |
| Surry County (in district) | 6,556 | 5,440 | 54.0% | 3.1% | 39.0% | 0.3% | $74k | 27.0% | 13.7% | 25.5% | 79.5% | 10.5% | 1.3% |
| Emporia city (in district) | 5,432 | 3,938 | 18.7% | 7.8% | 64.0% | 0.6% | $67k | 16.0% | 21.2% | 18.3% | 38.5% | 15.7% | 4.5% |
Richmond city: 72 precincts
| Precinct | Population | Voting-age pop. | % White non-Hisp. | % Hispanic | % Black | % Asian | Median income* | % Bachelor's+ | % 18-29 (of adults) | % 65+ | % Homeowners | % Below poverty | % Spanish at home (adults) |
|---|---|---|---|---|---|---|---|---|---|---|---|---|---|
| Eight Hundred Eleven | 4,391 | 3,343 | 9.8% | 3.8% | 81.2% | 0.1% | $46k | 15.6% | 19.7% | 14.5% | 24.9% | 33.0% | 3.1% |
| Eight Hundred Fourteen | 3,058 | 2,397 | 22.8% | 9.7% | 65.9% | 0.0% | $79k | 15.5% | 19.0% | 13.3% | 52.2% | 9.9% | 11.0% |
| Eight Hundred Six | 6,966 | 5,022 | 9.1% | 33.7% | 53.3% | 1.6% | $51k | 10.6% | 20.8% | 11.4% | 38.3% | 19.2% | 33.2% |
| Eight Hundred Ten | 5,141 | 3,595 | 15.5% | 22.1% | 58.0% | 0.3% | $59k | 17.8% | 20.4% | 12.7% | 63.2% | 11.4% | 14.5% |
| Eight Hundred Twelve | 4,690 | 3,720 | 18.3% | 27.3% | 49.4% | 0.3% | $75k | 26.7% | 13.3% | 16.6% | 80.2% | 4.9% | 18.4% |
| Eight Hundred Two | 2,362 | 1,989 | 13.1% | 7.6% | 76.9% | 0.0% | $51k | 18.0% | 20.5% | 8.5% | 40.5% | 16.6% | 6.5% |
| Five Hundred Eight | 2,193 | 1,858 | 70.1% | 0.6% | 22.1% | 0.6% | $98k | 61.8% | 19.9% | 14.6% | 52.3% | 9.3% | 3.0% |
| Five Hundred Five | 4,214 | 4,129 | 59.6% | 5.3% | 23.7% | 4.8% | $80k | 59.5% | 63.3% | 6.0% | 32.7% | 31.7% | 3.6% |
| Five Hundred Four | 3,947 | 3,529 | 57.8% | 7.5% | 27.0% | 2.0% | $73k | 54.9% | 39.4% | 10.4% | 38.5% | 22.1% | 2.7% |
| Five Hundred Nine | 4,272 | 3,404 | 17.1% | 4.1% | 69.3% | 0.1% | $41k | 19.0% | 25.6% | 17.1% | 33.8% | 18.3% | 2.6% |
| Five Hundred Ten | 3,469 | 2,701 | 35.8% | 22.1% | 37.0% | 0.2% | $69k | 41.8% | 21.1% | 22.2% | 67.3% | 25.8% | 12.9% |
| Five Hundred Three | 3,905 | 3,480 | 52.8% | 4.2% | 36.1% | 1.6% | $83k | 49.4% | 25.6% | 16.9% | 61.2% | 17.5% | 1.9% |
| Five Hundred one | 2,508 | 2,324 | 77.6% | 4.4% | 10.2% | 2.0% | $95k | 73.1% | 29.0% | 11.4% | 40.1% | 10.3% | 1.6% |
| Four Hundred Fifteen | 2,509 | 2,369 | 61.7% | 11.4% | 16.4% | 5.2% | $90k | 63.0% | 12.8% | 31.1% | 57.9% | 9.8% | 5.5% |
| Four Hundred Four | 3,167 | 2,635 | 41.3% | 23.0% | 29.3% | 1.0% | $68k | 47.7% | 11.7% | 16.2% | 45.2% | 8.0% | 19.3% |
| Four Hundred Fourteen | 2,320 | 2,082 | 78.3% | 7.3% | 5.2% | 6.5% | $112k | 63.3% | 10.2% | 27.9% | 81.2% | 5.4% | 2.0% |
| Four Hundred Nine | 2,353 | 2,154 | 74.9% | 8.8% | 9.7% | 2.0% | $104k | 63.1% | 8.2% | 38.8% | 85.0% | 13.0% | 5.0% |
| Four Hundred Ten | 3,589 | 2,948 | 54.4% | 6.9% | 32.8% | 1.9% | $84k | 42.0% | 18.3% | 19.2% | 55.9% | 6.6% | 3.8% |
| Four Hundred Thirteen | 2,171 | 1,903 | 75.2% | 4.4% | 12.2% | 4.2% | $113k | 58.8% | 7.8% | 28.6% | 81.2% | 3.5% | 2.2% |
| Four Hundred Twelve | 2,732 | 2,316 | 35.6% | 9.8% | 44.2% | 5.8% | $53k | 46.3% | 20.7% | 24.4% | 28.9% | 7.7% | 8.4% |
| Four Hundred Two | 4,647 | 3,948 | 76.2% | 3.5% | 16.1% | 0.6% | $117k | 59.1% | 10.1% | 22.6% | 68.6% | 3.4% | 3.9% |
| Nine Hundred Eight | 3,295 | 2,649 | 15.5% | 3.8% | 73.0% | 3.7% | $41k | 35.8% | 26.4% | 21.1% | 13.7% | 21.7% | 1.9% |
| Nine Hundred Eleven | 3,692 | 2,736 | 8.5% | 34.7% | 55.1% | 0.3% | $74k | 19.0% | 18.9% | 13.2% | 75.9% | 7.0% | 22.9% |
| Nine Hundred Nine | 4,202 | 2,997 | 20.5% | 23.9% | 47.9% | 1.4% | $56k | 29.8% | 18.5% | 13.7% | 58.6% | 13.2% | 14.5% |
| Nine Hundred Ten | 6,590 | 4,874 | 5.8% | 41.8% | 50.9% | 0.0% | $54k | 15.1% | 26.3% | 8.5% | 51.9% | 23.0% | 31.6% |
| Nine Hundred Three | 4,951 | 3,689 | 7.4% | 22.9% | 67.0% | 0.0% | $35k | 8.5% | 18.4% | 14.6% | 48.5% | 41.8% | 15.3% |
| Nine Hundred Two | 3,311 | 1,849 | 0.5% | 79.7% | 19.7% | 0.0% | $37k | 2.2% | 30.1% | 7.0% | 14.5% | 55.5% | 63.7% |
| One Hundred Eleven | 2,069 | 1,639 | 80.6% | 8.3% | 4.9% | 1.1% | $148k | 76.0% | 13.2% | 12.5% | 77.0% | 2.1% | 5.3% |
| One Hundred Fifteen | 1,558 | 1,241 | 82.0% | 1.7% | 9.5% | 2.5% | $122k | 79.6% | 8.4% | 24.5% | 78.7% | 2.8% | 1.0% |
| One Hundred Five | 2,652 | 2,194 | 89.3% | 3.3% | 2.1% | 1.5% | $130k | 83.2% | 12.5% | 14.2% | 59.3% | 5.0% | 2.3% |
| One Hundred Four | 2,362 | 1,936 | 88.0% | 1.9% | 6.4% | 0.8% | $144k | 83.2% | 12.6% | 18.2% | 73.7% | 4.9% | 1.3% |
| One Hundred Fourteen | 3,202 | 2,810 | 85.0% | 4.8% | 2.7% | 1.3% | $94k | 77.5% | 28.3% | 9.8% | 35.0% | 7.0% | 3.5% |
| One Hundred One | 3,014 | 2,818 | 63.9% | 8.0% | 11.8% | 8.7% | $164k | 78.2% | 74.5% | 8.9% | 91.1% | 4.9% | 5.0% |
| One Hundred Six | 2,452 | 2,058 | 92.9% | 2.4% | 2.1% | 0.4% | $215k | 88.3% | 6.2% | 27.1% | 98.1% | 2.9% | 0.7% |
| One Hundred Thirteen | 4,271 | 3,925 | 68.6% | 3.4% | 16.8% | 0.8% | $83k | 66.8% | 29.2% | 12.6% | 31.5% | 11.6% | 4.3% |
| One Hundred Twelve | 1,792 | 1,385 | 85.4% | 4.5% | 3.2% | 0.8% | $113k | 77.2% | 13.1% | 16.1% | 54.5% | 4.2% | 2.9% |
| One Hundred Two | 1,718 | 1,326 | 88.1% | 2.5% | 4.7% | 1.0% | $170k | 85.7% | 9.0% | 18.8% | 85.0% | 2.9% | 0.9% |
| Seven Hundred Eight | 3,803 | 3,556 | 54.5% | 11.2% | 18.7% | 4.1% | $57k | 59.2% | 39.6% | 4.6% | 8.3% | 15.1% | 9.0% |
| Seven Hundred Five | 2,700 | 2,392 | 52.3% | 6.3% | 33.0% | 1.3% | $63k | 48.6% | 20.3% | 11.5% | 43.3% | 11.9% | 2.2% |
| Seven Hundred Nine | 1,545 | 1,399 | 70.0% | 6.0% | 10.3% | 2.1% | $68k | 63.6% | 35.0% | 3.1% | 8.9% | 16.6% | 5.1% |
| Seven Hundred One | 3,412 | 1,819 | 2.5% | 0.0% | 92.0% | 0.3% | $25k | 12.8% | 27.6% | 5.1% | 23.5% | 54.2% | 0.0% |
| Seven Hundred Seven | 4,750 | 3,969 | 64.9% | 7.2% | 20.9% | 2.3% | $88k | 65.1% | 25.4% | 10.1% | 40.4% | 10.7% | 4.5% |
| Seven Hundred Six | 6,037 | 5,087 | 21.2% | 1.8% | 72.4% | 0.4% | $45k | 20.1% | 25.1% | 11.0% | 45.8% | 22.1% | 1.6% |
| Seven Hundred Three | 3,318 | 2,567 | 25.4% | 11.1% | 59.2% | 0.5% | $64k | 35.4% | 14.5% | 10.7% | 43.1% | 22.8% | 8.4% |
| Seven Hundred Two | 3,227 | 2,855 | 22.9% | 5.9% | 63.5% | 1.3% | $45k | 28.8% | 21.1% | 15.0% | 34.1% | 32.4% | 3.6% |
| Six Hundred Eleven | 2,630 | 2,494 | 39.4% | 7.2% | 47.4% | 4.5% | $53k | 50.9% | 33.7% | 8.7% | 14.0% | 5.6% | 7.2% |
| Six Hundred Four | 2,632 | 2,282 | 18.4% | 1.2% | 75.7% | 1.5% | $61k | 34.1% | 21.7% | 19.8% | 56.8% | 10.2% | 1.6% |
| Six Hundred Nine | 3,642 | 3,358 | 42.3% | 1.6% | 47.8% | 0.8% | $67k | 54.6% | 41.4% | 3.5% | 5.7% | 26.3% | 0.8% |
| Six Hundred Seven | 2,746 | 2,733 | 62.5% | 6.7% | 14.9% | 6.7% | $61k | 69.0% | 41.9% | 5.1% | 8.1% | 16.1% | 4.3% |
| Six Hundred Six | 4,184 | 2,838 | 11.2% | 2.2% | 80.7% | 1.3% | $71k | 31.0% | 16.2% | 12.8% | 63.6% | 12.7% | 3.1% |
| Six Hundred Ten | 3,273 | 2,594 | 12.6% | 4.7% | 72.6% | 0.0% | $52k | 10.3% | 18.4% | 15.3% | 39.8% | 38.4% | 3.1% |
| Six Hundred Three | 2,589 | 1,873 | 12.7% | 1.3% | 81.5% | 0.0% | $52k | 27.3% | 22.1% | 15.8% | 41.9% | 24.3% | 1.0% |
| Six Hundred Two | 4,182 | 2,767 | 9.7% | 2.4% | 80.3% | 1.4% | $29k | 11.0% | 22.5% | 7.9% | 15.1% | 48.4% | 4.3% |
| Three Hundred Eight | 2,305 | 2,015 | 64.1% | 4.7% | 23.2% | 0.9% | $81k | 59.9% | 13.9% | 19.5% | 61.3% | 7.1% | 2.9% |
| Three Hundred Eleven | 876 | 859 | 60.0% | 10.7% | 19.2% | 2.2% | $61k | 58.7% | 57.7% | 6.5% | 13.8% | 26.5% | 9.6% |
| Three Hundred Five | 2,868 | 2,292 | 28.1% | 3.2% | 51.1% | 5.6% | $78k | 50.2% | 23.6% | 12.7% | 48.2% | 21.6% | 2.0% |
| Three Hundred Four | 3,073 | 2,431 | 28.1% | 1.4% | 56.8% | 7.1% | $88k | 40.1% | 17.2% | 15.3% | 65.3% | 17.6% | 2.5% |
| Three Hundred Nine | 2,212 | 2,061 | 68.5% | 2.8% | 19.3% | 2.6% | $74k | 60.1% | 8.3% | 46.0% | 29.8% | 10.1% | 0.9% |
| Three Hundred One | 2,445 | 1,854 | 15.2% | 2.6% | 75.9% | 0.3% | $37k | 26.8% | 19.5% | 14.1% | 38.1% | 30.8% | 1.2% |
| Three Hundred Seven | 4,362 | 3,707 | 62.3% | 7.3% | 19.5% | 2.8% | $90k | 64.5% | 12.4% | 21.6% | 60.1% | 6.8% | 3.3% |
| Three Hundred Six | 2,432 | 2,239 | 25.8% | 6.0% | 54.1% | 6.4% | $64k | 49.2% | 57.6% | 13.7% | 30.0% | 31.7% | 5.1% |
| Three Hundred Ten | 1,969 | 1,059 | 3.9% | 0.0% | 92.0% | 0.0% | $22k | 3.8% | 36.3% | 2.4% | 0.0% | 65.8% | 0.0% |
| Three Hundred Three | 1,392 | 1,169 | 36.9% | 3.2% | 50.0% | 4.0% | $79k | 49.1% | 10.3% | 18.5% | 70.7% | 9.7% | 1.3% |
| Three Hundred Two | 1,513 | 1,247 | 42.5% | 3.5% | 47.4% | 2.3% | $71k | 54.9% | 13.7% | 17.0% | 61.5% | 9.8% | 1.3% |
| Two Hundred Eight | 3,141 | 2,687 | 76.5% | 4.1% | 8.7% | 4.4% | $125k | 82.7% | 34.5% | 14.6% | 56.3% | 15.3% | 1.1% |
| Two Hundred Fifteen | 3,960 | 3,818 | 70.1% | 6.7% | 14.2% | 3.4% | $84k | 69.0% | 50.6% | 6.1% | 13.8% | 11.0% | 2.8% |
| Two Hundred Four | 2,500 | 2,367 | 82.1% | 8.5% | 4.8% | 1.1% | $102k | 79.3% | 45.6% | 13.8% | 34.3% | 13.4% | 4.8% |
| Two Hundred Fourteen | 4,513 | 4,351 | 42.6% | 7.6% | 29.9% | 12.3% | $35k | 45.8% | 80.1% | 1.6% | 4.3% | 31.7% | 4.8% |
| Two Hundred Seven | 2,926 | 2,679 | 79.5% | 8.8% | 3.4% | 2.2% | $99k | 81.2% | 26.5% | 16.2% | 45.6% | 6.2% | 3.0% |
| Two Hundred Six | 1,466 | 1,378 | 72.3% | 6.1% | 16.1% | 1.3% | $39k | 61.0% | 46.2% | 28.7% | 28.1% | 34.1% | 2.9% |
| Two Hundred Sixteen | 625 | 610 | 43.5% | 8.5% | 40.3% | 2.3% | $37k | 43.9% | 71.8% | 4.3% | 17.7% | 45.5% | 5.5% |
| Two Hundred Thirteen | 4,106 | 3,610 | 44.5% | 6.3% | 42.0% | 1.5% | $51k | 57.0% | 55.3% | 4.6% | 30.5% | 27.9% | 4.5% |
Chesterfield County: 41 precincts
| Precinct | Population | Voting-age pop. | % White non-Hisp. | % Hispanic | % Black | % Asian | Median income* | % Bachelor's+ | % 18-29 (of adults) | % 65+ | % Homeowners | % Below poverty | % Spanish at home (adults) |
|---|---|---|---|---|---|---|---|---|---|---|---|---|---|
| Beach | 2,505 | 2,163 | 82.0% | 1.9% | 9.7% | 0.4% | $132k | 38.1% | 12.1% | 25.9% | 95.0% | 3.4% | 3.0% |
| Beaufont | 3,420 | 2,634 | 25.2% | 31.6% | 38.5% | 3.4% | $45k | 26.4% | 35.0% | 7.2% | 27.2% | 30.0% | 19.9% |
| Bellwood | 4,508 | 3,151 | 38.9% | 30.3% | 17.7% | 3.8% | $83k | 18.9% | 17.0% | 11.7% | 51.0% | 24.6% | 25.1% |
| Beulah | 6,783 | 5,007 | 31.1% | 25.3% | 34.1% | 2.7% | $95k | 29.7% | 18.8% | 17.9% | 82.2% | 8.8% | 19.9% |
| Bird | 5,857 | 4,619 | 37.6% | 19.1% | 35.4% | 0.3% | $97k | 21.7% | 21.4% | 13.4% | 80.4% | 4.9% | 11.7% |
| Buford | 687 | 576 | 71.2% | 1.9% | 18.9% | 6.0% | $101k | 43.6% | 2.6% | 39.0% | 34.0% | 9.3% | 0.6% |
| Carver | 3,741 | 3,016 | 60.4% | 6.5% | 26.3% | 1.5% | $122k | 41.4% | 14.3% | 19.5% | 94.0% | 1.6% | 7.0% |
| Chippenham | 7,323 | 5,797 | 21.9% | 24.8% | 45.9% | 3.1% | $76k | 18.9% | 21.2% | 14.6% | 73.3% | 13.6% | 20.2% |
| Crenshaw | 7,672 | 5,844 | 55.5% | 9.0% | 21.3% | 3.5% | $84k | 29.6% | 22.6% | 14.1% | 71.7% | 14.5% | 10.1% |
| Cresthill | 6,771 | 4,748 | 60.3% | 14.8% | 20.3% | 1.3% | $104k | 35.7% | 20.5% | 12.6% | 75.7% | 10.0% | 5.0% |
| Davis | 6,034 | 4,445 | 21.0% | 19.8% | 56.8% | 0.2% | $61k | 33.5% | 19.5% | 11.1% | 55.0% | 19.4% | 15.7% |
| Drewrys Bluff | 8,144 | 5,977 | 27.6% | 36.9% | 32.0% | 0.7% | $48k | 13.8% | 28.5% | 11.1% | 34.0% | 20.1% | 29.0% |
| Dutch Gap | 3,016 | 2,312 | 54.6% | 13.0% | 25.2% | 5.0% | $130k | 47.3% | 17.9% | 15.1% | 91.0% | 4.0% | 6.3% |
| Ecoff | 7,060 | 5,844 | 58.6% | 3.9% | 25.6% | 2.9% | $86k | 35.3% | 15.2% | 24.9% | 66.0% | 10.2% | 2.2% |
| Elizabeth Scott | 7,048 | 5,804 | 43.6% | 13.2% | 30.9% | 4.0% | $121k | 40.1% | 20.6% | 15.4% | 73.4% | 2.4% | 7.4% |
| Enon | 8,503 | 6,594 | 50.7% | 9.9% | 29.5% | 5.5% | $102k | 34.6% | 17.5% | 12.7% | 80.1% | 4.4% | 5.3% |
| Ettrick | 7,451 | 6,529 | 29.9% | 6.1% | 57.7% | 0.6% | $70k | 29.4% | 45.9% | 12.9% | 78.8% | 11.4% | 5.5% |
| Falling Creek | 6,814 | 5,156 | 19.5% | 41.2% | 32.3% | 4.0% | $66k | 22.2% | 25.0% | 17.2% | 59.7% | 16.7% | 31.5% |
| Falling Creek East | 1,124 | 939 | 31.0% | 52.2% | 14.1% | 0.1% | $65k | 20.6% | 45.6% | 14.4% | 45.7% | 19.4% | 37.5% |
| Five Forks | 7,976 | 6,124 | 33.4% | 7.8% | 49.3% | 6.1% | $114k | 39.7% | 26.0% | 10.0% | 93.5% | 3.7% | 7.7% |
| Gates | 1,764 | 1,553 | 70.0% | 3.2% | 17.9% | 1.5% | $99k | 34.9% | 18.6% | 25.8% | 83.5% | 5.4% | 3.2% |
| Gates East | 2,599 | 2,007 | 47.8% | 13.9% | 27.9% | 4.8% | $66k | 24.1% | 23.1% | 22.7% | 57.0% | 17.4% | 6.9% |
| Genito | 5,429 | 4,317 | 58.1% | 8.3% | 24.4% | 3.9% | $105k | 44.3% | 17.7% | 14.5% | 75.9% | 6.0% | 9.6% |
| Harrowgate | 6,210 | 4,775 | 43.2% | 11.0% | 38.4% | 2.0% | $91k | 38.0% | 16.5% | 20.5% | 88.7% | 4.8% | 3.8% |
| Iron Bridge | 3,291 | 2,689 | 52.0% | 13.8% | 26.6% | 2.1% | $101k | 31.4% | 26.7% | 16.3% | 71.8% | 2.7% | 7.0% |
| Iron Bridge North | 3,627 | 3,073 | 34.1% | 5.1% | 45.0% | 11.1% | $88k | 49.5% | 22.5% | 16.7% | 58.4% | 7.1% | 1.8% |
| La Prade | 4,658 | 3,801 | 70.5% | 5.3% | 17.8% | 2.6% | $127k | 44.4% | 10.0% | 27.4% | 78.8% | 7.8% | 4.3% |
| Longhouse | 3,064 | 2,437 | 66.0% | 4.8% | 19.7% | 0.3% | $117k | 29.6% | 13.9% | 22.4% | 94.0% | 4.0% | 0.5% |
| Matoaca | 5,087 | 3,854 | 58.0% | 3.6% | 30.5% | 0.3% | $80k | 23.8% | 18.6% | 19.3% | 80.3% | 13.0% | 0.6% |
| Meadowbrook | 5,100 | 3,897 | 23.7% | 18.9% | 49.6% | 2.8% | $88k | 26.0% | 21.0% | 19.7% | 82.3% | 14.5% | 11.7% |
| Nash | 5,626 | 4,523 | 63.3% | 3.0% | 23.9% | 4.2% | $169k | 57.2% | 16.4% | 21.7% | 88.1% | 2.1% | 1.0% |
| New Manchester | 2,740 | 2,132 | 39.2% | 50.6% | 8.2% | 0.0% | $124k | 39.9% | 34.5% | 9.2% | 95.4% | 0.2% | 51.0% |
| North Chester | 7,154 | 5,712 | 50.9% | 10.0% | 31.1% | 1.7% | $103k | 29.4% | 18.2% | 11.8% | 69.8% | 4.1% | 5.3% |
| Oxbridge | 5,301 | 4,556 | 54.6% | 8.8% | 32.3% | 1.2% | $83k | 31.8% | 26.8% | 20.0% | 76.9% | 4.5% | 6.6% |
| Pocoshock North | 1,101 | 947 | 44.5% | 1.2% | 49.8% | 0.0% | $93k | 53.4% | 7.6% | 30.5% | 61.7% | 3.4% | 1.2% |
| Providence | 5,247 | 3,875 | 66.4% | 3.7% | 26.2% | 2.3% | $123k | 43.6% | 16.5% | 13.0% | 80.6% | 3.8% | 4.9% |
| Reams | 3,161 | 2,455 | 58.2% | 12.9% | 23.4% | 3.1% | $96k | 47.3% | 18.8% | 20.2% | 81.5% | 2.3% | 14.9% |
| Salem Church | 7,210 | 5,291 | 42.2% | 32.7% | 19.8% | 1.8% | $99k | 20.1% | 18.6% | 11.8% | 81.7% | 5.6% | 20.6% |
| South Chester | 7,407 | 4,957 | 52.3% | 31.0% | 11.5% | 0.4% | $92k | 31.0% | 17.0% | 11.0% | 73.8% | 9.8% | 21.4% |
| Southside | 3,196 | 2,554 | 20.8% | 31.7% | 42.3% | 1.6% | $56k | 22.9% | 21.7% | 10.2% | 65.6% | 10.4% | 27.4% |
| Turner | 6,286 | 4,540 | 22.3% | 16.9% | 52.3% | 0.0% | $69k | 24.3% | 21.7% | 5.8% | 45.4% | 14.1% | 14.3% |
Henrico County: 42 precincts
| Precinct | Population | Voting-age pop. | % White non-Hisp. | % Hispanic | % Black | % Asian | Median income* | % Bachelor's+ | % 18-29 (of adults) | % 65+ | % Homeowners | % Below poverty | % Spanish at home (adults) |
|---|---|---|---|---|---|---|---|---|---|---|---|---|---|
| Adams | 4,195 | 3,455 | 17.6% | 1.5% | 72.9% | 6.4% | $61k | 29.8% | 19.1% | 23.2% | 65.0% | 10.1% | 1.3% |
| Antioch | 2,286 | 1,942 | 85.0% | 1.2% | 12.1% | 0.0% | $100k | 26.2% | 13.3% | 25.3% | 97.9% | 1.3% | 0.3% |
| Azalea | 5,229 | 4,441 | 14.1% | 8.5% | 66.3% | 0.2% | $64k | 19.7% | 32.2% | 16.3% | 37.1% | 21.4% | 3.6% |
| Belmont | 5,976 | 4,886 | 52.3% | 2.3% | 36.6% | 3.1% | $74k | 38.6% | 16.1% | 19.8% | 58.1% | 14.2% | 2.3% |
| Brookland | 2,651 | 2,089 | 51.3% | 14.7% | 20.0% | 10.6% | $93k | 30.4% | 21.6% | 16.9% | 74.3% | 7.4% | 7.2% |
| Canterbury | 329 | 329 | 85.3% | 0.0% | 13.1% | 0.6% | $70k | 64.2% | 3.0% | 87.3% | 17.9% | 25.0% | 0.0% |
| Cedar Fork | 2,651 | 2,094 | 31.4% | 2.8% | 63.7% | 0.0% | $72k | 21.6% | 17.5% | 22.5% | 74.6% | 14.5% | 2.3% |
| Central Gardens | 3,652 | 2,820 | 3.4% | 0.0% | 94.7% | 0.0% | $65k | 28.4% | 15.0% | 12.9% | 67.4% | 21.8% | 6.3% |
| Chamberlayne | 1,863 | 1,758 | 45.0% | 3.8% | 45.3% | 3.5% | $89k | 46.0% | 14.1% | 28.2% | 91.4% | 2.3% | 2.8% |
| Chickahominy | 4,263 | 3,294 | 46.4% | 10.1% | 40.7% | 0.0% | $82k | 22.9% | 14.2% | 25.6% | 86.4% | 9.7% | 4.7% |
| Donahoe | 3,263 | 2,441 | 48.1% | 14.2% | 33.1% | 1.4% | $74k | 16.0% | 14.9% | 17.0% | 60.0% | 12.8% | 9.6% |
| Dorey | 2,875 | 2,393 | 40.2% | 4.3% | 52.1% | 0.7% | $117k | 33.0% | 15.2% | 19.3% | 95.2% | 2.1% | 2.0% |
| Dumbarton | 5,398 | 4,120 | 34.2% | 11.2% | 37.3% | 9.6% | $80k | 32.6% | 26.4% | 7.8% | 29.9% | 8.2% | 10.9% |
| Eanes | 4,567 | 3,547 | 24.9% | 4.9% | 61.9% | 1.5% | $66k | 20.3% | 22.8% | 18.9% | 55.8% | 22.5% | 4.2% |
| Eastbourne | 1,906 | 1,410 | 3.4% | 2.3% | 93.8% | 0.0% | $47k | 34.2% | 10.2% | 13.8% | 92.7% | 7.1% | 4.0% |
| Elko | 1,030 | 824 | 75.1% | 5.4% | 12.6% | 0.3% | $92k | 26.0% | 15.2% | 23.1% | 93.2% | 3.2% | 4.6% |
| Fairfield | 3,778 | 2,814 | 1.5% | 13.5% | 80.9% | 0.0% | $57k | 30.9% | 23.5% | 12.7% | 32.2% | 20.4% | 4.7% |
| Glen Lea | 3,094 | 2,385 | 19.7% | 6.7% | 72.0% | 0.0% | $72k | 35.4% | 23.9% | 13.2% | 73.9% | 6.9% | 2.6% |
| Greendale | 2,368 | 2,105 | 67.1% | 4.5% | 20.0% | 3.2% | $80k | 37.5% | 26.3% | 18.8% | 46.0% | 9.0% | 2.3% |
| Hermitage | 7,902 | 6,384 | 43.6% | 17.6% | 26.7% | 5.0% | $68k | 28.1% | 22.0% | 12.3% | 52.8% | 9.9% | 14.1% |
| Highland Gardens | 4,389 | 2,557 | 4.6% | 3.5% | 87.7% | 1.8% | $45k | 14.6% | 28.6% | 11.8% | 38.1% | 27.3% | 2.0% |
| Highland Springs | 3,071 | 2,220 | 15.8% | 1.3% | 74.6% | 0.2% | $50k | 26.5% | 24.2% | 11.2% | 45.4% | 16.5% | 0.5% |
| Holladay | 2,905 | 2,276 | 59.8% | 18.3% | 15.2% | 3.4% | $75k | 28.6% | 18.6% | 18.2% | 54.2% | 10.0% | 12.7% |
| Hungary | 3,492 | 2,837 | 27.1% | 13.2% | 46.2% | 9.9% | $82k | 32.6% | 21.7% | 18.3% | 65.2% | 11.0% | 2.3% |
| Johnson | 3,278 | 2,920 | 58.2% | 18.5% | 13.7% | 8.6% | $65k | 48.1% | 27.6% | 11.8% | 47.4% | 22.1% | 13.1% |
| Laburnum | 4,281 | 3,691 | 27.1% | 5.9% | 59.7% | 0.6% | $47k | 13.4% | 23.9% | 17.4% | 45.1% | 10.5% | 7.6% |
| Lakeside | 4,614 | 3,883 | 73.5% | 9.2% | 7.6% | 5.2% | $77k | 44.4% | 22.3% | 14.8% | 68.0% | 9.5% | 10.7% |
| Maplewood | 3,092 | 2,542 | 2.5% | 1.7% | 93.2% | 0.0% | $68k | 27.3% | 12.7% | 21.6% | 69.7% | 4.3% | 0.4% |
| Maude Trevvett | 7,554 | 6,371 | 38.4% | 20.9% | 25.7% | 6.9% | $66k | 28.1% | 26.0% | 17.9% | 35.0% | 12.3% | 15.0% |
| Mehfoud | 2,508 | 2,096 | 32.0% | 2.5% | 61.6% | 0.7% | $121k | 38.4% | 12.7% | 18.4% | 95.9% | 1.2% | 2.3% |
| Montrose | 3,943 | 3,313 | 15.9% | 1.1% | 77.9% | 1.6% | $68k | 26.7% | 18.6% | 16.0% | 40.7% | 10.4% | 2.4% |
| Moody | 1,014 | 798 | 65.3% | 16.2% | 10.8% | 2.5% | $91k | 52.2% | 11.4% | 16.2% | 75.1% | 7.1% | 11.1% |
| Nine Mile | 1,279 | 1,159 | 41.7% | 5.3% | 49.0% | 0.0% | $49k | 21.0% | 18.0% | 20.0% | 58.5% | 22.5% | 0.9% |
| Pleasants | 5,242 | 3,920 | 11.3% | 3.1% | 82.2% | 1.0% | $58k | 25.5% | 21.4% | 16.3% | 60.7% | 22.1% | 1.8% |
| Ratcliffe | 5,436 | 4,201 | 8.9% | 0.3% | 87.6% | 0.2% | $69k | 20.3% | 14.7% | 20.8% | 60.4% | 14.8% | 0.3% |
| Rolfe | 3,262 | 2,628 | 9.6% | 7.7% | 81.8% | 0.0% | $80k | 24.4% | 19.6% | 13.8% | 71.2% | 3.1% | 5.7% |
| Sandston | 3,591 | 2,924 | 58.7% | 8.4% | 25.7% | 1.4% | $72k | 14.8% | 19.2% | 15.9% | 68.6% | 9.5% | 5.5% |
| Sullivans | 5,456 | 4,461 | 35.6% | 3.3% | 56.6% | 0.9% | $103k | 40.2% | 15.9% | 16.2% | 81.1% | 2.5% | 2.6% |
| Town Hall | 1,733 | 1,657 | 65.7% | 6.3% | 23.7% | 1.1% | $111k | 47.8% | 15.5% | 30.9% | 87.0% | 3.2% | 0.3% |
| Westwood | 2,627 | 2,333 | 77.4% | 13.3% | 4.4% | 0.7% | $117k | 65.0% | 15.0% | 26.3% | 80.5% | 7.0% | 6.2% |
| Whitlocks | 3,444 | 2,762 | 58.9% | 3.5% | 31.3% | 0.6% | $116k | 28.8% | 16.0% | 20.2% | 97.7% | 2.9% | 3.3% |
| Wilder | 2,550 | 2,186 | 17.2% | 4.4% | 72.7% | 1.2% | $122k | 56.9% | 17.9% | 20.5% | 90.7% | 11.7% | 4.4% |
Prince George County: 10 precincts
| Precinct | Population | Voting-age pop. | % White non-Hisp. | % Hispanic | % Black | % Asian | Median income* | % Bachelor's+ | % 18-29 (of adults) | % 65+ | % Homeowners | % Below poverty | % Spanish at home (adults) |
|---|---|---|---|---|---|---|---|---|---|---|---|---|---|
| Blackwater | 1,540 | 1,278 | 66.3% | 3.5% | 23.7% | 0.8% | $89k | 34.9% | 17.1% | 25.5% | 89.2% | 10.6% | 1.0% |
| Bland | 6,226 | 4,804 | 60.7% | 4.6% | 27.4% | 1.3% | $97k | 32.7% | 24.7% | 15.8% | 83.9% | 12.4% | 1.5% |
| Brandon | 2,227 | 1,756 | 61.6% | 2.9% | 26.4% | 0.2% | $118k | 39.7% | 18.8% | 23.1% | 90.8% | 2.7% | 2.0% |
| Court | 4,012 | 3,084 | 42.1% | 3.6% | 46.3% | 2.1% | $104k | 36.4% | 21.8% | 15.1% | 77.3% | 10.8% | 2.0% |
| Harrison | 1,926 | 1,549 | 68.6% | 2.1% | 22.7% | 0.6% | $95k | 29.9% | 18.2% | 20.1% | 91.9% | 10.8% | 0.4% |
| Jefferson Park | 12,353 | 10,411 | 31.2% | 17.4% | 41.5% | 2.6% | $66k | 16.1% | 46.9% | 3.0% | 29.3% | 13.4% | 11.1% |
| Richard Bland | 1,343 | 969 | 49.3% | 16.0% | 31.9% | 1.5% | $67k | 26.6% | 16.6% | 17.1% | 79.6% | 10.7% | 9.0% |
| Rives | 4,670 | 3,683 | 48.4% | 15.7% | 27.7% | 2.9% | $81k | 29.2% | 46.7% | 9.2% | 48.9% | 6.7% | 7.7% |
| Templeton | 5,299 | 4,188 | 76.2% | 8.2% | 13.9% | 0.9% | $91k | 18.5% | 18.7% | 21.4% | 88.5% | 3.5% | 4.0% |
| Union Branch | 3,078 | 2,521 | 63.7% | 10.1% | 20.0% | 1.6% | $97k | 14.2% | 26.1% | 20.2% | 89.2% | 6.4% | 1.4% |
Petersburg city: 7 precincts
| Precinct | Population | Voting-age pop. | % White non-Hisp. | % Hispanic | % Black | % Asian | Median income* | % Bachelor's+ | % 18-29 (of adults) | % 65+ | % Homeowners | % Below poverty | % Spanish at home (adults) |
|---|---|---|---|---|---|---|---|---|---|---|---|---|---|
| Fifth Ward First Precinct | 4,100 | 3,274 | 12.2% | 1.9% | 82.1% | 0.0% | $50k | 29.6% | 18.2% | 15.6% | 25.5% | 32.3% | 2.8% |
| First Ward First Precinct | 3,620 | 2,759 | 16.9% | 2.3% | 75.0% | 0.1% | $39k | 22.8% | 19.2% | 18.9% | 39.6% | 23.7% | 2.9% |
| Fourth Ward First Precinct | 4,963 | 3,962 | 18.1% | 7.6% | 70.6% | 0.8% | $56k | 31.9% | 23.2% | 17.8% | 31.7% | 22.4% | 6.1% |
| Second Ward First Precinct | 5,002 | 3,895 | 8.6% | 4.6% | 82.3% | 3.4% | $56k | 23.4% | 26.6% | 19.6% | 48.1% | 11.5% | 3.0% |
| Seventh Ward First Precinct | 6,659 | 4,813 | 11.0% | 14.8% | 67.1% | 1.8% | $51k | 25.7% | 26.3% | 13.0% | 41.5% | 27.5% | 11.4% |
| Sixth Ward First Precinct | 4,122 | 3,102 | 15.1% | 10.0% | 70.1% | 0.8% | $51k | 24.1% | 26.0% | 14.6% | 26.9% | 27.8% | 8.0% |
| Third Ward First Precinct | 5,106 | 3,742 | 20.3% | 0.5% | 75.0% | 1.4% | $55k | 19.0% | 12.2% | 19.3% | 59.3% | 8.2% | 0.3% |
Dinwiddie County: 13 precincts
| Precinct | Population | Voting-age pop. | % White non-Hisp. | % Hispanic | % Black | % Asian | Median income* | % Bachelor's+ | % 18-29 (of adults) | % 65+ | % Homeowners | % Below poverty | % Spanish at home (adults) |
|---|---|---|---|---|---|---|---|---|---|---|---|---|---|
| Cherry Hill | 1,016 | 788 | 57.0% | 2.9% | 39.0% | 0.0% | $61k | 19.0% | 13.4% | 22.7% | 78.3% | 10.1% | 2.5% |
| Chesdin | 2,787 | 2,133 | 45.1% | 3.4% | 40.9% | 0.8% | $87k | 20.5% | 25.9% | 12.0% | 79.8% | 11.4% | 5.6% |
| Church Road | 2,466 | 1,903 | 83.4% | 6.1% | 8.3% | 0.5% | $97k | 17.2% | 12.1% | 14.2% | 91.0% | 6.5% | 4.4% |
| Dinwiddie | 2,339 | 2,001 | 66.3% | 0.1% | 31.9% | 0.6% | $93k | 26.5% | 12.9% | 22.5% | 82.0% | 9.3% | 0.7% |
| Edgehill | 1,378 | 1,188 | 51.8% | 5.6% | 37.8% | 2.0% | $60k | 21.8% | 19.5% | 19.0% | 69.6% | 22.0% | 6.6% |
| Little Zion | 2,971 | 2,471 | 63.8% | 0.7% | 34.6% | 0.2% | $81k | 21.9% | 13.4% | 20.8% | 81.5% | 7.8% | 0.9% |
| McKenney | 2,109 | 1,531 | 54.9% | 1.0% | 41.8% | 0.6% | $84k | 4.7% | 18.1% | 15.0% | 88.0% | 27.2% | 1.3% |
| New Hope | 2,891 | 2,251 | 50.8% | 8.6% | 36.2% | 0.6% | $70k | 18.5% | 15.4% | 16.9% | 58.2% | 14.0% | 7.4% |
| Reams | 1,056 | 847 | 75.9% | 2.1% | 19.5% | 0.3% | $63k | 11.7% | 15.5% | 16.5% | 63.7% | 14.9% | 2.9% |
| Rocky Run | 1,981 | 1,704 | 78.4% | 0.7% | 19.4% | 0.4% | $88k | 20.5% | 13.0% | 29.2% | 83.4% | 8.6% | 0.0% |
| Rohoic | 1,544 | 1,278 | 41.9% | 17.1% | 39.8% | 0.7% | $83k | 26.5% | 13.2% | 12.1% | 77.7% | 9.4% | 7.2% |
| Sutherland | 4,734 | 3,679 | 66.5% | 5.1% | 23.5% | 0.8% | $102k | 19.0% | 17.7% | 22.4% | 86.0% | 9.1% | 4.1% |
| White Oak | 907 | 774 | 76.3% | 5.9% | 14.6% | 0.0% | $62k | 18.9% | 21.1% | 31.8% | 82.5% | 10.3% | 0.0% |
Hopewell city: 7 precincts
| Precinct | Population | Voting-age pop. | % White non-Hisp. | % Hispanic | % Black | % Asian | Median income* | % Bachelor's+ | % 18-29 (of adults) | % 65+ | % Homeowners | % Below poverty | % Spanish at home (adults) |
|---|---|---|---|---|---|---|---|---|---|---|---|---|---|
| Ward Five | 2,874 | 2,174 | 58.0% | 13.6% | 20.8% | 1.0% | $74k | 10.4% | 31.2% | 13.9% | 78.2% | 16.5% | 5.7% |
| Ward Four | 4,283 | 3,296 | 45.8% | 10.0% | 36.1% | 2.3% | $66k | 16.2% | 19.8% | 14.0% | 81.7% | 17.6% | 7.9% |
| Ward One | 2,905 | 2,204 | 48.0% | 8.6% | 35.3% | 0.0% | $49k | 17.8% | 11.9% | 17.2% | 44.7% | 30.3% | 2.6% |
| Ward Seven | 3,512 | 2,587 | 34.3% | 6.6% | 44.4% | 0.4% | $74k | 15.1% | 12.9% | 13.8% | 51.0% | 16.2% | 8.7% |
| Ward Six | 2,396 | 1,892 | 24.9% | 4.3% | 69.6% | 0.1% | $62k | 11.5% | 18.8% | 16.8% | 58.0% | 20.8% | 3.1% |
| Ward Three | 2,911 | 2,117 | 49.1% | 7.7% | 28.4% | 2.6% | $75k | 15.7% | 20.7% | 20.0% | 59.6% | 11.0% | 3.9% |
| Ward Two | 3,875 | 2,716 | 26.3% | 10.3% | 57.9% | 0.5% | $40k | 7.6% | 28.2% | 11.8% | 36.2% | 37.5% | 6.9% |
Colonial Heights city: 5 precincts
| Precinct | Population | Voting-age pop. | % White non-Hisp. | % Hispanic | % Black | % Asian | Median income* | % Bachelor's+ | % 18-29 (of adults) | % 65+ | % Homeowners | % Below poverty | % Spanish at home (adults) |
|---|---|---|---|---|---|---|---|---|---|---|---|---|---|
| Fifth | 3,768 | 2,678 | 70.5% | 1.7% | 18.7% | 4.7% | $109k | 40.4% | 13.6% | 24.9% | 94.1% | 4.4% | 1.5% |
| First | 2,491 | 1,921 | 49.7% | 4.9% | 29.3% | 12.2% | $57k | 25.3% | 18.5% | 16.7% | 53.4% | 10.7% | 2.5% |
| Fourth | 4,558 | 3,703 | 64.7% | 16.9% | 15.0% | 2.3% | $68k | 27.3% | 13.6% | 24.6% | 59.1% | 9.4% | 9.4% |
| Second | 4,271 | 3,104 | 65.0% | 8.5% | 18.9% | 1.4% | $71k | 20.1% | 21.3% | 9.7% | 62.6% | 9.9% | 3.6% |
| Third | 3,201 | 2,400 | 70.9% | 6.1% | 16.7% | 1.1% | $90k | 27.9% | 17.0% | 14.2% | 74.0% | 5.4% | 2.8% |
Brunswick County: 13 precincts
| Precinct | Population | Voting-age pop. | % White non-Hisp. | % Hispanic | % Black | % Asian | Median income* | % Bachelor's+ | % 18-29 (of adults) | % 65+ | % Homeowners | % Below poverty | % Spanish at home (adults) |
|---|---|---|---|---|---|---|---|---|---|---|---|---|---|
| Alberta | 50 | 41 | 37.8% | 1.8% | 51.5% | 0.0% | $39k | 16.7% | 20.4% | 22.5% | 68.0% | 21.3% | 3.0% |
| Brodnax | 858 | 770 | 52.1% | 5.5% | 41.3% | 0.2% | $57k | 13.1% | 19.1% | 23.4% | 67.6% | 6.2% | 5.6% |
| Danieltown | 1,364 | 1,103 | 58.6% | 1.1% | 33.6% | 0.0% | $41k | 16.2% | 10.8% | 22.0% | 69.8% | 12.4% | 2.0% |
| Dromgoole | 650 | 594 | 83.4% | 0.0% | 12.2% | 0.0% | $72k | 42.8% | 3.1% | 49.5% | 91.1% | 12.3% | 0.0% |
| Edgerton | 1,817 | 1,466 | 14.8% | 0.4% | 80.5% | 0.7% | $40k | 13.2% | 31.8% | 19.0% | 56.9% | 13.9% | 0.2% |
| Elmore | 655 | 563 | 35.4% | 0.6% | 60.2% | 0.0% | $42k | 13.0% | 3.7% | 30.7% | 94.9% | 24.3% | 0.8% |
| Fitzhugh | 972 | 726 | 40.8% | 0.5% | 55.7% | 0.7% | $56k | 16.1% | 17.6% | 23.7% | 81.4% | 23.5% | 0.4% |
| King's Store | 701 | 574 | 28.6% | 5.2% | 62.9% | 0.0% | $50k | 7.9% | 24.7% | 20.2% | 78.6% | 24.6% | 6.7% |
| Lawrenceville | 2,416 | 1,909 | 37.5% | 0.9% | 57.2% | 1.4% | $67k | 23.2% | 21.6% | 15.1% | 57.2% | 17.1% | 0.3% |
| Rock Store | 1,033 | 896 | 54.9% | 2.8% | 28.2% | 3.0% | $63k | 29.1% | 16.5% | 38.5% | 86.0% | 9.0% | 2.1% |
| Seymour | 483 | 433 | 52.0% | 5.5% | 41.5% | 0.1% | $57k | 13.0% | 19.1% | 23.4% | 67.4% | 6.1% | 5.6% |
| Sturgeon | 3,772 | 3,379 | 29.5% | 7.0% | 60.3% | 0.0% | $54k | 5.5% | 17.5% | 14.8% | 79.9% | 20.3% | 7.0% |
| Tillman | 1,070 | 961 | 73.9% | 0.0% | 24.2% | 0.0% | $58k | 34.8% | 20.9% | 32.9% | 96.4% | 4.9% | 0.0% |
Greensville County: 9 precincts
| Precinct | Population | Voting-age pop. | % White non-Hisp. | % Hispanic | % Black | % Asian | Median income* | % Bachelor's+ | % 18-29 (of adults) | % 65+ | % Homeowners | % Below poverty | % Spanish at home (adults) |
|---|---|---|---|---|---|---|---|---|---|---|---|---|---|
| 101 PRECINCT 1-A | 470 | 377 | 14.3% | 0.9% | 78.9% | 0.0% | $40k | 17.7% | 28.6% | 17.5% | 63.9% | 16.6% | 1.9% |
| 102 PRECINCT 1-B | 629 | 495 | 33.6% | 2.9% | 59.9% | 0.0% | $42k | 18.0% | 14.2% | 33.9% | 76.4% | 16.5% | 6.5% |
| 103 PRECINCT 1-C | 1,150 | 878 | 15.0% | 1.0% | 77.1% | 0.0% | $42k | 13.6% | 31.5% | 17.0% | 59.5% | 13.8% | 0.6% |
| 201 PRECINCT 2-A | 679 | 536 | 24.8% | 0.1% | 70.4% | 0.0% | $40k | 12.5% | 25.7% | 27.0% | 61.0% | 15.3% | 0.0% |
| 202 PRECINCT 2-B | 1,555 | 1,236 | 21.4% | 0.9% | 72.9% | 0.0% | $40k | 15.5% | 25.0% | 24.2% | 65.1% | 16.2% | 2.0% |
| 302 PRECINCT 3-A | 4,283 | 3,959 | 35.1% | 5.2% | 51.9% | 0.4% | $70k | 7.8% | 16.8% | 9.1% | 64.2% | 12.4% | 3.3% |
| 401 PRECINCT 4-A | 479 | 395 | 80.4% | 2.0% | 12.8% | 0.0% | $35k | 26.4% | 12.0% | 13.2% | 64.5% | 21.4% | 1.2% |
| 402 PRECINCT 4-B | 1,224 | 1,046 | 43.4% | 4.5% | 48.3% | 0.4% | $67k | 20.1% | 21.0% | 10.6% | 54.5% | 18.8% | 2.6% |
| 403 PRECINCT 4-C | 935 | 723 | 67.0% | 0.2% | 28.1% | 0.7% | $70k | 34.4% | 6.2% | 24.0% | 82.3% | 3.5% | 2.7% |
Sussex County: 10 precincts
| Precinct | Population | Voting-age pop. | % White non-Hisp. | % Hispanic | % Black | % Asian | Median income* | % Bachelor's+ | % 18-29 (of adults) | % 65+ | % Homeowners | % Below poverty | % Spanish at home (adults) |
|---|---|---|---|---|---|---|---|---|---|---|---|---|---|
| Blackwater | 1,408 | 1,108 | 35.6% | 1.4% | 59.8% | 0.2% | $73k | 18.9% | 18.6% | 16.9% | 62.9% | 15.3% | 0.6% |
| Courthouse | 398 | 355 | 56.2% | 0.6% | 41.3% | 0.4% | $63k | 15.6% | 22.2% | 27.6% | 77.2% | 10.3% | 0.7% |
| Henry | 1,294 | 1,046 | 48.7% | 0.0% | 41.5% | 0.0% | $58k | 22.2% | 12.8% | 21.6% | 64.9% | 16.8% | 0.0% |
| Newville One | 890 | 881 | 38.3% | 3.4% | 51.1% | 2.9% | $66k | 5.2% | 12.6% | 9.2% | 82.6% | 5.8% | 4.8% |
| Newville Two | 1,965 | 1,570 | 27.7% | 1.4% | 68.2% | 0.4% | $60k | 13.0% | 22.1% | 19.2% | 65.6% | 5.3% | 1.0% |
| Stony Creek | 1,050 | 918 | 49.8% | 0.1% | 44.7% | 0.5% | $101k | 16.6% | 18.6% | 27.5% | 85.4% | 11.0% | 0.2% |
| Wakefield | 1,227 | 1,029 | 33.5% | 0.9% | 63.5% | 0.1% | $68k | 24.4% | 36.6% | 15.9% | 67.9% | 14.5% | 0.2% |
| Wakefield Firehouse | 1,196 | 1,041 | 49.0% | 1.5% | 46.5% | 0.9% | $63k | 15.8% | 24.8% | 17.0% | 77.4% | 6.7% | 1.1% |
| Waverly | 236 | 165 | 17.7% | 0.7% | 79.9% | 0.0% | $61k | 13.6% | 25.5% | 20.4% | 61.8% | 4.5% | 0.0% |
| Yale | 1,117 | 971 | 53.6% | 0.8% | 43.6% | 0.3% | $48k | 17.8% | 17.8% | 22.4% | 64.8% | 15.3% | 0.9% |
Southampton County: 4 precincts
| Precinct | Population | Voting-age pop. | % White non-Hisp. | % Hispanic | % Black | % Asian | Median income* | % Bachelor's+ | % 18-29 (of adults) | % 65+ | % Homeowners | % Below poverty | % Spanish at home (adults) |
|---|---|---|---|---|---|---|---|---|---|---|---|---|---|
| Boykins-Branchville | 1,993 | 1,537 | 40.7% | 6.6% | 39.5% | 0.1% | $67k | 18.1% | 15.6% | 21.0% | 75.5% | 7.2% | 1.7% |
| Capron-Drewryville | 3,238 | 2,801 | 48.0% | 6.5% | 37.1% | 0.4% | $97k | 14.1% | 10.5% | 12.6% | 75.9% | 9.5% | 2.8% |
| Newsoms | 1,019 | 834 | 55.6% | 4.7% | 33.3% | 0.1% | $76k | 20.6% | 14.4% | 18.6% | 78.7% | 7.8% | 1.2% |
| Sebrell | 2,487 | 2,050 | 76.1% | 1.4% | 16.4% | 0.1% | $67k | 21.1% | 17.6% | 28.4% | 76.0% | 7.0% | 1.1% |
Charles City County: 3 precincts
| Precinct | Population | Voting-age pop. | % White non-Hisp. | % Hispanic | % Black | % Asian | Median income* | % Bachelor's+ | % 18-29 (of adults) | % 65+ | % Homeowners | % Below poverty | % Spanish at home (adults) |
|---|---|---|---|---|---|---|---|---|---|---|---|---|---|
| Precinct 1-1 | 2,366 | 1,991 | 55.3% | 2.3% | 32.5% | 1.9% | $87k | 16.9% | 10.6% | 25.4% | 83.5% | 8.0% | 1.4% |
| Precinct 2-1 | 2,194 | 1,860 | 36.4% | 2.9% | 43.8% | 0.2% | $71k | 14.7% | 13.9% | 28.0% | 87.6% | 11.4% | 1.8% |
| Precinct 3-1 | 2,087 | 1,851 | 41.5% | 1.0% | 45.8% | 1.1% | $82k | 20.8% | 15.5% | 27.2% | 88.0% | 9.0% | 0.6% |
Surry County: 6 precincts
| Precinct | Population | Voting-age pop. | % White non-Hisp. | % Hispanic | % Black | % Asian | Median income* | % Bachelor's+ | % 18-29 (of adults) | % 65+ | % Homeowners | % Below poverty | % Spanish at home (adults) |
|---|---|---|---|---|---|---|---|---|---|---|---|---|---|
| Bacons Castle | 1,225 | 1,008 | 46.2% | 4.0% | 46.8% | 0.0% | $81k | 23.5% | 9.7% | 35.0% | 84.2% | 16.5% | 0.5% |
| Carsley | 1,430 | 1,188 | 56.0% | 2.1% | 38.3% | 0.0% | $77k | 22.7% | 20.6% | 17.1% | 87.4% | 7.7% | 2.2% |
| Claremont | 1,347 | 1,099 | 63.8% | 3.4% | 29.2% | 1.5% | $78k | 35.1% | 6.7% | 20.0% | 77.6% | 9.7% | 1.7% |
| Dendron | 1,314 | 1,167 | 51.7% | 1.9% | 40.6% | 0.0% | $72k | 22.0% | 18.0% | 32.8% | 78.9% | 5.4% | 0.3% |
| Spring Grove | 429 | 329 | 54.1% | 5.1% | 36.8% | 0.0% | $53k | 38.9% | 13.9% | 17.3% | 60.6% | 13.2% | 2.8% |
| Surry | 811 | 649 | 49.4% | 4.2% | 43.0% | 0.0% | $69k | 29.1% | 11.7% | 27.5% | 74.4% | 14.9% | 1.4% |
Emporia city: 7 precincts
| Precinct | Population | Voting-age pop. | % White non-Hisp. | % Hispanic | % Black | % Asian | Median income* | % Bachelor's+ | % 18-29 (of adults) | % 65+ | % Homeowners | % Below poverty | % Spanish at home (adults) |
|---|---|---|---|---|---|---|---|---|---|---|---|---|---|
| DISTRICT 6 | 850 | 636 | 56.7% | 1.8% | 25.4% | 0.0% | $72k | 20.2% | 22.6% | 17.4% | 79.9% | 4.2% | 0.5% |
| DISTRICT 7 | 462 | 297 | 6.6% | 18.0% | 67.9% | 0.0% | $68k | 11.9% | 17.7% | 15.3% | 31.6% | 16.7% | 14.5% |
| PRECINCT 1-1 | 1,595 | 1,022 | 5.8% | 14.8% | 74.4% | 0.6% | $69k | 14.7% | 23.2% | 11.8% | 27.3% | 19.8% | 9.8% |
| PRECINCT 2-1 | 529 | 451 | 20.2% | 2.0% | 72.8% | 0.2% | $34k | 9.3% | 12.0% | 32.0% | 37.8% | 13.1% | 2.3% |
| PRECINCT 3-1 | 656 | 485 | 22.7% | 7.6% | 47.0% | 0.0% | $140k | 26.1% | 11.3% | 21.4% | 45.1% | 7.8% | 1.5% |
| PRECINCT 4-1 | 719 | 598 | 21.3% | 3.6% | 65.7% | 0.0% | $56k | 12.8% | 9.5% | 30.9% | 40.4% | 10.1% | 2.2% |
| PRECINCT 5-1 | 619 | 448 | 0.1% | 0.0% | 95.7% | 3.2% | $34k | 16.5% | 53.0% | 8.6% | 8.0% | 36.8% | 0.0% |
*Median income is approximate (see note above). ACS 2020-2024 5-year.
Nonpartisan voter information. GOTV Polling does not endorse any candidate.