
Virginia's 5th Congressional District
U.S. House · Virginia · District 5 · General election: Tuesday, November 3, 2026
Candidates on the November 3 ballot
- Tom S. P. PerrielloDemocratic
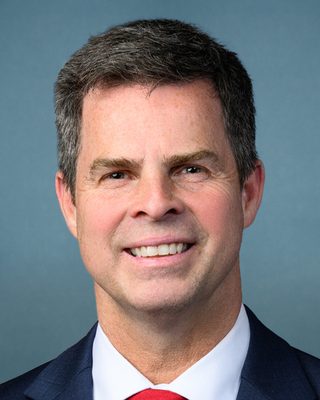 John J. McGuire IIIRepublicanIncumbentPhoto: U.S. Congress
- Cooke C. HarveyIndependent
Source: Virginia Department of Elections, candidate list, November 3, 2026 General Election, federal offices, certified list (list retrieved 2026-10-30; retrieved 2026-10-30). Order of names does not reflect ballot order. Incumbent tags appear only where the official list marks incumbents. Photos come from the Candidate Alerts database where one is on file; otherwise initials are shown.
Federal campaign finance filings for this seat: FEC election page (FEC registration is not the same as ballot qualification).
Certified candidates
- John J. McGuire III RepublicanIncumbent @RepJohnMcGuire Website
- Tom S. P. Perriello Democratic Website
- Cooke Costa Harvey Independent
Certified candidate list from Candidate Alerts, as of 2026-09-24, based on Virginia Department of Elections. Includes candidates the database marks as on the November 3 ballot. Incumbent tags here follow the database.
Past election results
| Candidate | Party | Votes | Share |
|---|---|---|---|
| John J. McGuire III | Republican | 249,564 | 57.3% |
| Gloria Tinsley Witt | Democratic | 184,229 | 42.3% |
| Write-In | 2,046 | 0.5% | |
| Total | 435,839 |
Source: Virginia Department of Elections, official election results (Enhanced Voting media export, by locality and precinct). Status: Official, Virginia Department of Elections ENR media export (created 2025-03-05, after State Board certification Dec 2 2024)
| Candidate | Party | Votes | Share |
|---|---|---|---|
| Robert G. "Bob" Good | Republican | 177,191 | 57.6% |
| Joshua M. Throneburg | Democratic | 129,996 | 42.2% |
| Write In | Wri | 603 | 0.2% |
| Total | 307,790 |
Source: Virginia Department of Elections, official results site (results.elections.virginia.gov), results by precinct JSON. Status: Official results (all reporting stages 'Certified'), Virginia Department of Elections official results site
Held under the district lines in effect at the time. Those boundaries differ from the 2026 district.
| Candidate | Party | Votes | Share |
|---|---|---|---|
| Robert George Good | Republican | 210,988 | 52.4% |
| Bryant Cameron Webb | Democratic | 190,315 | 47.3% |
| Write-Ins | 1,014 | 0.3% | |
| Total | 402,317 |
Source: Virginia Department of Elections, Historical Elections Database (historical.elections.virginia.gov). Status: Certified, Virginia Department of Elections Historical Elections Database (official certified results by locality and precinct; State Board of Elections certification)
Certified results from state or county election authorities, as compiled in the Candidate Alerts precinct results database (public API candidatealerts.com/api/district-results). Totals are sums of certified precinct and county-level rows.
Demographics
2020 Census demographics by district are not yet published in this data set.
0 of 304 precincts are above 50%, and 0 are above 25%. Source: Census American Community Survey 2020-2024 5-year block groups, allocated to current precinct shapes by area.
Poll status
Map
Share of adults (18+) who speak Spanish at home, by precinct. Census ACS 2020-2024 5-year estimates on the current precinct layer. Hover a precinct for its value.
District shown in red: U.S. Census Bureau cartographic boundary file for the 119th Congress (cb_2024_us_cd119_500k). These are the lines in effect for 2026 in this state per the Candidate Alerts district registry.
Precinct map: past elections and demographics
Choose a layer above. Hover a precinct for its values.
Precinct results
Certified precinct results on current precinct shapes, grouped by county. 585 precincts. "(part)" marks a precinct only partly inside this district; its full vote is shown, so district sums are approximate and are not the official district total. Elections were held under older lines and are shown on the 2026 district.
| County | 2024 President | 2020 President | ||
|---|---|---|---|---|
| Margin | Votes | Margin | Votes | |
| Albemarle County | D+33.9 | 65,136 | R+14.5 | 19,904 |
| Lynchburg city | R+4.7 | 34,748 | R+29.7 | 17,934 |
| Pittsylvania County | R+43.1 | 33,676 | R+53.1 | 15,803 |
| Campbell County | R+48.2 | 30,570 | R+63.5 | 14,055 |
| Louisa County | R+25.9 | 23,713 | R+54.0 | 7,500 |
| Powhatan County | R+43.9 | 20,685 | R+65.9 | 9,628 |
| Charlottesville city | D+70.3 | 21,570 | D+39.9 | 5,241 |
| Bedford County | R+46.0 | 19,021 | R+68.1 | 7,760 |
| Amherst County | R+36.3 | 17,155 | R+56.6 | 8,484 |
| Halifax County | R+21.1 | 17,630 | R+44.7 | 7,742 |
| Goochland County | R+18.4 | 19,525 | R+51.2 | 5,846 |
| Danville city | D+20.8 | 17,433 | D+11.5 | 7,413 |
| Mecklenburg County | R+20.9 | 16,062 | R+32.0 | 5,895 |
| Fluvanna County | R+6.3 | 16,495 | R+48.9 | 5,262 |
| Hanover County | R+34.1 | 11,909 | R+57.0 | 5,703 |
| Appomattox County | R+50.5 | 9,552 | R+61.4 | 4,640 |
| Nelson County | R+7.0 | 9,288 | R+48.1 | 4,497 |
| Prince Edward County | R+2.1 | 9,143 | R+15.7 | 4,619 |
| Amelia County | R+44.5 | 7,930 | R+60.2 | 3,496 |
| Buckingham County | R+23.2 | 7,846 | R+39.4 | 3,250 |
| Charlotte County | R+32.7 | 5,928 | R+50.5 | 3,245 |
| Nottoway County | R+22.4 | 6,750 | R+37.3 | 2,314 |
| Lunenburg County | R+22.9 | 5,798 | R+40.8 | 3,112 |
| Cumberland County | R+22.1 | 5,415 | R+41.6 | 2,817 |
| All counties (approx.) | R+12.2 | 432,978 | R+40.5 | 176,160 |
Albemarle County: 58 precincts
| Precinct | 2024 President | 2020 President | ||
|---|---|---|---|---|
| Margin | Votes | Margin | Votes | |
| 101 - WOODBROOK | D+37.1 | 2,331 | - | - |
| 101 - Woodbrook | - | - | R+1.9 | 778 |
| 103 - BRANCHLANDS | D+44.3 | 872 | - | - |
| 103 - Branchlands | - | - | D+14.1 | 276 |
| 104 - AGNOR-HURT | D+47.9 | 1,824 | - | - |
| 104 - Agnor-hurt | - | - | D+13.1 | 677 |
| 105 - DUNLORA | D+56.7 | 3,018 | - | - |
| 105 - Dunlora | - | - | D+5.8 | 686 |
| 106 - NORTHSIDE | D+20.9 | 2,344 | - | - |
| 106 - Northside | - | - | R+22.1 | 1,205 |
| 201 - JACK JOUETT | D+33.9 | 2,882 | - | - |
| 201 - Jack Jouett | - | - | R+14.5 | 716 |
| 202 - UNIVERSITY | D+63.5 | 1,462 | - | - |
| 202 - University | - | - | D+49.8 | 492 |
| 203 - GEORGETOWN | D+54.6 | 2,229 | - | - |
| 203 - Georgetown | - | - | D+33.6 | 746 |
| 301 - IVY | D+43.8 | 3,371 | - | - |
| 301 - Ivy | - | - | R+2.7 | 1,018 |
| 302 - RED HILL | D+25.0 | 2,580 | - | - |
| 302 - Red Hill | - | - | R+18.8 | 1,036 |
| 304 - EAST IVY | D+37.1 | 909 | - | - |
| 304 - East Ivy | - | - | D+4.0 | 253 |
| 305 - COUNTRY GREEN | D+45.6 | 2,481 | - | - |
| 305 - Country Green | - | - | R+11.6 | 545 |
| 306 - PORTERS | D+16.8 | 1,300 | - | - |
| 306 - Porters | - | - | R+8.8 | 751 |
| 307 - YELLOW MOUNTAIN | D+21.2 | 1,070 | - | - |
| 307 - Yellow Mountain | - | - | R+19.1 | 319 |
| 401 - SCOTTSVILLE (0001,0000) | R+8.2 | 1,435 | - | - |
| 401 - Scottsville | - | - | R+48.6 | 741 |
| 402 - MONTICELLO | R+8.8 | 1,243 | - | - |
| 402 - Monticello | - | - | R+46.1 | 523 |
| 405 - MOUNTAIN VIEW | D+55.2 | 3,399 | - | - |
| 406 - STONE ROBINSON | D+14.4 | 2,930 | - | - |
| 406 - Stone Robinson | - | - | R+43.5 | 842 |
| 407 - BISCUIT RUN | D+51.3 | 1,579 | - | - |
| 407 - Biscuit Run | - | - | D+12.2 | 394 |
| 501 - KESWICK | D+16.3 | 1,254 | - | - |
| 501 - Keswick | - | - | R+17.6 | 612 |
| 502 - STONY POINT | D+13.6 | 1,358 | - | - |
| 502 - Stony Point | - | - | R+29.9 | 623 |
| 503 - HOLLYMEAD | D+40.2 | 2,467 | - | - |
| 503 - Hollymead | - | - | D+3.7 | 844 |
| 504 - FREE BRIDGE | D+48.9 | 1,795 | - | - |
| 506 - BAKER-BUTLER | D+29.1 | 3,956 | - | - |
| 506 - Baker-butler | - | - | R+26.4 | 958 |
| 507 - PANTOPS | D+42.4 | 1,834 | - | - |
| 507 - Pantops | - | - | R+16.2 | 389 |
| 601 - CROZET | D+25.8 | 3,173 | - | - |
| 601 - Crozet | - | - | R+34.2 | 977 |
| 602 - FREE UNION (0000,0001) (part) | D+7.2 | 1,216 | - | - |
| 602 - Free Union (part) | - | - | R+28.9 | 650 |
| 603 - EARLYSVILLE | D+16.2 | 2,790 | - | - |
| 603 - Earlysville | - | - | R+35.5 | 1,181 |
| 604 - BROWNSVILLE | D+31.7 | 2,743 | - | - |
| 604 - Brownsville | - | - | R+23.4 | 770 |
| 606 - MECHUMS RIVER | D+39.5 | 3,291 | - | - |
| 606 - Mechums River | - | - | R+15.3 | 902 |
Lynchburg city: 36 precincts
| Precinct | 2024 President | 2020 President | ||
|---|---|---|---|---|
| Margin | Votes | Margin | Votes | |
| 101 - FIRST WARD FIRST PRECINCT | R+3.2 | 3,043 | - | - |
| 101 - First Ward First Precinct | - | - | R+29.2 | 1,595 |
| 102 - FIRST WARD SECOND PRECINCT | R+7.5 | 3,099 | - | - |
| 102 - First Ward Second Precinct | - | - | R+49.7 | 1,476 |
| 103 - FIRST WARD THIRD PRECINCT | D+0.7 | 2,142 | - | - |
| 103 - First Ward Third Precinct | - | - | R+43.9 | 875 |
| 104 - FIRST WARD FOURTH PRECINCT | D+18.9 | 950 | - | - |
| 104 - First Ward Fourth Precinct | - | - | R+11.3 | 407 |
| 105 - FIRST WARD FIFTH PRECINCT | D+21.1 | 1,343 | - | - |
| 105 - First Ward Fifth Precinct | - | - | R+17.7 | 626 |
| 201 - SECOND WARD FIRST PRECINCT | D+41.3 | 2,752 | - | - |
| 201 - Second Ward First Precinct | - | - | D+29.0 | 1,209 |
| 202 - SECOND WARD SECOND PRECINCT | D+40.5 | 2,328 | - | - |
| 202 - Second Ward Second Precinct | - | - | D+34.4 | 956 |
| 203 - SECOND WARD THIRD PRECINCT | D+36.9 | 647 | - | - |
| 203 - Second Ward Third Precinct | - | - | D+40.6 | 399 |
| 204 - SECOND WARD FOURTH PRECINCT | R+5.1 | 704 | - | - |
| 204 - Second Ward Fourth Precinct | - | - | R+11.2 | 481 |
| 301 - THIRD WARD FIRST PRECINCT | R+4.7 | 891 | - | - |
| 301 - Third Ward First Precinct | - | - | R+11.3 | 583 |
| 302 - THIRD WARD SECOND PRECINCT | R+93.7 | 1,532 | - | - |
| 302 - Third Ward Second Precinct | - | - | R+78.9 | 1,368 |
| 303 - THIRD WARD THIRD PRECINCT | R+13.6 | 1,171 | - | - |
| 303 - Third Ward Third Precinct | - | - | R+33.1 | 740 |
| 304 - THIRD WARD FOURTH PRECINCT | R+21.6 | 1,299 | - | - |
| 304 - Third Ward Fourth Precinct | - | - | R+38.0 | 739 |
| 305 - THIRD WARD FIFTH PRECINCT | R+31.9 | 2,797 | - | - |
| 305 - Third Ward Fifth Precinct | - | - | R+53.8 | 1,402 |
| 401 - FOURTH WARD FIRST PRECINCT | R+26.5 | 3,780 | - | - |
| 401 - Fourth Ward First Precinct | - | - | R+52.2 | 1,872 |
| 402 - FOURTH WARD SECOND PRECINCT | R+10.5 | 1,263 | - | - |
| 402 - Fourth Ward Second Precinct | - | - | R+37.9 | 681 |
| 403 - FOURTH WARD THIRD PRECINCT | R+5.1 | 2,355 | - | - |
| 403 - Fourth Ward Third Precinct | - | - | R+28.6 | 1,395 |
| 404 - FOURTH WARD FOURTH PRECINCT | D+0.5 | 2,652 | - | - |
| 404 - Fourth Ward Fourth Precinct | - | - | R+27.3 | 1,130 |
Pittsylvania County: 57 precincts
| Precinct | 2024 President | 2020 President | ||
|---|---|---|---|---|
| Margin | Votes | Margin | Votes | |
| 103 - TWIN SPRINGS | R+58.7 | 2,717 | - | - |
| 103 - Twin Springs | - | - | R+68.2 | 869 |
| 105 - CHATHAM (0001,0000) | R+45.5 | 789 | - | - |
| 105 - Chatham | - | - | R+58.1 | 308 |
| 106 - TUNSTALL | R+56.2 | 1,223 | - | - |
| 106 - Tunstall | - | - | R+70.8 | 569 |
| 108 - WEST BLAIRS | R+36.3 | 721 | - | - |
| 108 - West Blairs | - | - | R+56.4 | 275 |
| 201 - CALLANDS | R+58.9 | 1,038 | - | - |
| 201 - Callands | - | - | R+66.7 | 570 |
| 202- BEARSKIN | R+29.3 | 594 | - | - |
| 204 - SANDY LEVEL | R+55.8 | 713 | - | - |
| 204 - Sandy Level | - | - | R+65.1 | 424 |
| 206 - CLIMAX | R+55.5 | 737 | - | - |
| 206 - Climax | - | - | R+64.8 | 298 |
| 207 - GRETNA (0000,0001) | R+51.1 | 1,565 | - | - |
| 207 - Gretna | - | - | R+56.1 | 748 |
| 301 - CENTRAL (0002,0000) | D+5.2 | 1,065 | - | - |
| 301 - Central | - | - | D+13.1 | 251 |
| 305 - RICEVILLE | R+2.3 | 780 | - | - |
| 305 - Riceville | - | - | D+7.8 | 359 |
| 307 - EAST BLAIRS | D+27.9 | 1,237 | - | - |
| 307 - East Blairs | - | - | D+42.2 | 443 |
| 308 - MT AIRY | D+0.3 | 673 | - | - |
| 308 - Mt Airy | - | - | D+2.0 | 251 |
| 309 - EAST GRETNA (0000,0001) | R+19.0 | 541 | - | - |
| 309 - East Gretna | - | - | R+26.0 | 242 |
| 402 - KEELING | R+61.3 | 1,051 | - | - |
| 402 - Keeling | - | - | R+74.0 | 581 |
| 404 - KENTUCK | R+53.5 | 1,927 | - | - |
| 404 - Kentuck | - | - | R+59.7 | 951 |
| 405 - RINGGOLD | R+51.0 | 2,078 | - | - |
| 405 - Ringgold | - | - | R+55.1 | 1,089 |
| 501 - HURT (0001,0000) | R+39.1 | 1,742 | - | - |
| 501 - Hurt | - | - | R+52.0 | 954 |
| 502 - MOTLEY SYCAMORE | R+47.5 | 2,114 | - | - |
| 502 - Motley Sycamore | - | - | R+63.1 | 853 |
| 503 - RENAN | R+60.5 | 764 | - | - |
| 503 - Renan | - | - | R+62.7 | 574 |
| 603 - STONY MILL | R+51.8 | 1,366 | - | - |
| 603 - Stony Mill | - | - | R+69.0 | 772 |
| 604 - SWANSONVILLE | R+49.8 | 773 | - | - |
| 604 - Swansonville | - | - | R+50.4 | 587 |
| 605 - WHITMELL | R+50.1 | 1,069 | - | - |
| 605 - Whitmell | - | - | R+59.4 | 581 |
| 606 - BROSVILLE | R+19.2 | 1,072 | - | - |
| 606 - Brosville | - | - | R+21.7 | 650 |
| 607 - DRY FORK | R+56.1 | 465 | - | - |
| 607 - Dry Fork | - | - | R+69.5 | 246 |
| 702 - BACHELORS HALL | R+65.5 | 1,392 | - | - |
| 702 - Bachelors Hall | - | - | R+77.3 | 780 |
| 703 - FERRY ROAD | R+43.0 | 298 | - | - |
| 703 - Ferry Road | - | - | R+40.7 | 226 |
| 704 - MT HERMON | R+41.7 | 2,098 | - | - |
| 704 - Mt Hermon | - | - | R+53.3 | 793 |
| 705 - MT CROSS | R+57.2 | 1,074 | - | - |
| 705 - Mt Cross | - | - | R+69.9 | 559 |
Campbell County: 31 precincts
| Precinct | 2024 President | 2020 President | ||
|---|---|---|---|---|
| Margin | Votes | Margin | Votes | |
| 101 - BROOKVILLE | R+46.1 | 2,290 | - | - |
| 101 - Brookville | - | - | R+64.5 | 1,269 |
| 102 - NEW LONDON | R+53.9 | 2,228 | - | - |
| 102 - New London | - | - | R+64.6 | 1,412 |
| 201 - WALKER | R+41.2 | 2,063 | - | - |
| 201 - Walker | - | - | R+56.7 | 1,006 |
| 202 - BEDFORD SPRINGS | R+51.4 | 2,271 | - | - |
| 202 - Bedford Springs | - | - | R+71.6 | 1,218 |
| 301 - EVINGTON | R+55.1 | 1,146 | - | - |
| 301 - Evington | - | - | R+61.2 | 582 |
| 302 - OTTER RIVER | R+53.5 | 1,504 | - | - |
| 302 - Otter River | - | - | R+64.3 | 485 |
| 303 - ALTAVISTA | R+19.4 | 1,589 | - | - |
| 303 - Altavista | - | - | R+40.3 | 919 |
| 401 - THREE FORKS | R+60.0 | 1,757 | - | - |
| 401 - Three Forks | - | - | R+78.2 | 859 |
| 402 - COURT HOUSE | R+55.2 | 3,159 | - | - |
| 402 - Court House | - | - | R+71.6 | 1,185 |
| 501 - SPRING HILL | R+50.1 | 2,449 | - | - |
| 501 - Spring Hill | - | - | R+62.7 | 1,113 |
| 502 - YELLOW BRANCH | R+43.5 | 1,698 | - | - |
| 601 - KINGS | R+44.1 | 1,811 | - | - |
| 601 - Kings | - | - | R+61.5 | 911 |
| 602 - CONCORD | R+52.2 | 2,429 | - | - |
| 602 - Concord | - | - | R+70.8 | 1,063 |
| 701 - BROOKNEAL | R+24.1 | 407 | - | - |
| 701 - Brookneal | - | - | R+49.0 | 698 |
| 702 - GLADYS | R+44.9 | 2,704 | - | - |
| 702 - Gladys | - | - | R+61.6 | 833 |
| 703 - MORRIS CHURCH | R+53.2 | 1,065 | - | - |
| 703 - Morris Church | - | - | R+64.3 | 502 |
Louisa County: 25 precincts
| Precinct | 2024 President | 2020 President | ||
|---|---|---|---|---|
| Margin | Votes | Margin | Votes | |
| 101 - GREEN SPRINGS #1 | R+2.1 | 2,929 | - | - |
| 101 - Zion | - | - | R+52.5 | 1,038 |
| 102 - GREEN SPRINGS #2 | R+19.2 | 1,137 | - | - |
| 102 - Mechanicsville | - | - | R+50.5 | 637 |
| 201 - LOUISA #1 (1460,0000) | R+15.0 | 1,495 | - | - |
| 201 - Louisa #1 | - | - | R+50.6 | 536 |
| 202 - LOUISA #2 | R+29.1 | 1,340 | - | - |
| 202 - Louisa #2 | - | - | R+57.7 | 643 |
| 203 - LOUISA #3 | R+29.9 | 241 | - | - |
| 301 - PATRICK HENRY #1 | D+10.8 | 1,850 | - | - |
| 301 - Patrick Henry No 1 | - | - | R+29.5 | 952 |
| 302 - PATRICK HENRY #2 | R+22.1 | 1,317 | - | - |
| 401 - MINERAL (0000,1620) | R+37.6 | 3,532 | - | - |
| 401 - Mineral | - | - | R+67.5 | 952 |
| 402 - Yanceyville | - | - | R+42.9 | 324 |
| 501 - CUCKOO #1 | R+20.7 | 875 | - | - |
| 501 - Fredericks Hall | - | - | R+24.9 | 346 |
| 502 - CUCKOO #2 | R+39.2 | 955 | - | - |
| 502 - Cuckoo | - | - | R+62.9 | 558 |
| 503 - CUCKOO #3 | R+35.6 | 1,762 | - | - |
| 503 - Elk Creek | - | - | R+68.8 | 510 |
| 601 - JACKSON | R+50.0 | 3,009 | - | - |
| 602 - Locust Creek | - | - | R+68.4 | 1,004 |
| 701 - MOUNTAIN ROAD #1 (0000,0001) | R+43.2 | 1,566 | - | - |
| 702 - MOUNTAIN ROAD #2 | R+22.9 | 1,705 | - | - |
Powhatan County: 24 precincts
| Precinct | 2024 President | 2020 President | ||
|---|---|---|---|---|
| Margin | Votes | Margin | Votes | |
| 101 - SUBLETTS | R+41.0 | 2,064 | - | - |
| 101 - Subletts | - | - | R+66.2 | 931 |
| 102 - MANAKIN | R+30.3 | 1,689 | - | - |
| 102 - Manakin | - | - | R+59.8 | 723 |
| 103 - FLAT ROCK | R+48.7 | 799 | - | - |
| 103 - Flat Rock | - | - | R+69.2 | 594 |
| 201 - POWHATAN STATION | R+56.1 | 1,651 | - | - |
| 201 - Powhatan Station | - | - | R+70.7 | 902 |
| 202 - GRACELAND | R+49.1 | 2,207 | - | - |
| 202 - Graceland | - | - | R+70.8 | 1,190 |
| 301 - BETHESDA | R+47.2 | 2,288 | - | - |
| 301 - Bethesda | - | - | R+65.6 | 860 |
| 302 - LEE'S LANDING | R+36.0 | 2,098 | - | - |
| 302 - Lee's Landing | - | - | R+63.1 | 793 |
| 401 - POWHATAN COURTHOUSE | R+47.8 | 3,006 | - | - |
| 401 - Powhatan Courthouse | - | - | R+77.4 | 1,102 |
| 402 - MT ZION | R+54.4 | 1,212 | - | - |
| 402 - Mt Zion | - | - | R+67.7 | 619 |
| 501 - SMITH CROSS ROADS | R+28.8 | 1,721 | - | - |
| 501 - Smith Cross Roads | - | - | R+52.5 | 807 |
| 502 - PINEVILLE | R+30.2 | 1,000 | - | - |
| 502 - Pineville | - | - | R+48.9 | 558 |
| 503 - TOBACCOVILLE (Tobaccoville) | R+63.1 | 950 | - | - |
| 503 - Tobaccoville | - | - | R+68.1 | 549 |
Charlottesville city: 15 precincts
| Precinct | 2024 President | 2020 President | ||
|---|---|---|---|---|
| Margin | Votes | Margin | Votes | |
| 101 - Key Recreation | D+74.1 | 3,246 | D+26.2 | 619 |
| 102 - CLARK | D+69.1 | 2,830 | - | - |
| 102 - Clark | - | - | D+44.0 | 905 |
| 201 - CARVER | D+78.3 | 1,947 | - | - |
| 201 - Carver | - | - | D+59.3 | 670 |
| 202 - VENABLE | D+66.2 | 1,577 | - | - |
| 202 - Walker | - | - | D+25.3 | 827 |
| 301 - Benjamin Tonsler | - | - | D+63.3 | 761 |
| 301 - JACKSON-VIA | D+70.1 | 2,688 | - | - |
| 302 - JOHNSON | D+71.1 | 2,075 | - | - |
| 302 - Johnson | - | - | D+28.3 | 902 |
| 303 - BUFORD | D+76.7 | 1,934 | - | - |
| 401 - CHARLOTTESVILLE HIGH SCHOOL | D+64.0 | 3,177 | - | - |
| 402 - Alumni Hall | - | - | D+33.4 | 557 |
| 402 - WALKER | D+64.5 | 2,096 | - | - |
Bedford County: 19 precincts
| Precinct | 2024 President | 2020 President | ||
|---|---|---|---|---|
| Margin | Votes | Margin | Votes | |
| 301 - NEW LONDON ACADEMY | R+57.1 | 2,328 | - | - |
| 301 - New London Academy | - | - | R+74.5 | 864 |
| 303 - FOREST ALLIANCE CHURCH | R+53.0 | 1,030 | - | - |
| 304 - ONE IN CHRIST CHURCH | R+51.3 | 876 | - | - |
| 304 - Riverside Church | - | - | R+72.0 | 468 |
| 305 - FOREST FIRE STATION #2 | R+54.9 | 1,354 | - | - |
| 306 - Forest Fire Station #2 | - | - | R+80.2 | 524 |
| 401 - FOREST ELEMENTARY SCHOOL | R+46.9 | 2,666 | - | - |
| 401 - Forest Elementary School | - | - | R+69.2 | 1,054 |
| 402 - THOMAS JEFFERSON ELEM SCHOOL | R+46.2 | 2,082 | - | - |
| 403 - Knights Of Columbus Bldg | - | - | R+65.1 | 1,274 |
| 403 - PLEASANT VIEW BAPTIST CHURCH | R+40.3 | 1,988 | - | - |
| 404 - FOREST RECREATION CENTER | R+38.4 | 838 | - | - |
| 404 - Forest Recreation Center | - | - | R+75.2 | 934 |
| 503 - BOONSBORO ELEMENTARY SCHOOL | R+24.8 | 2,035 | - | - |
| 504 - BOONSBORO RURITAN CLUB | R+48.6 | 3,318 | - | - |
| 505 - Boonsboro Elementary School | - | - | R+52.6 | 1,096 |
| 506 - Boonsboro Ruritan Club | - | - | R+67.6 | 1,546 |
| 705 - MOUNTAIN VIEW CHURCH | R+45.1 | 506 | - | - |
Amherst County: 22 precincts
| Precinct | 2024 President | 2020 President | ||
|---|---|---|---|---|
| Margin | Votes | Margin | Votes | |
| 101 - WRIGHT SHOP | R+1.6 | 1,112 | - | - |
| 101 - Wright Shop | - | - | R+18.2 | 621 |
| 102 - NEW GLASGOW | R+41.0 | 1,558 | - | - |
| 102 - New Glasgow | - | - | R+64.3 | 711 |
| 103 - COOLWELL | R+56.0 | 711 | - | - |
| 103 - Coolwell | - | - | R+64.6 | 472 |
| 201 - COURT HOUSE (0000,0070) | R+23.1 | 2,397 | - | - |
| 201 - Court House | - | - | R+49.0 | 881 |
| 202 - TEMPERANCE | R+55.9 | 957 | - | - |
| 202 - Temperance | - | - | R+70.9 | 605 |
| 301 - MONROE | R+39.4 | 962 | - | - |
| 301 - Monroe | - | - | R+64.2 | 525 |
| 302 - ELON | R+52.0 | 2,473 | - | - |
| 302 - Elon | - | - | R+66.5 | 1,300 |
| 303 - PLEASANT VIEW | R+50.1 | 641 | - | - |
| 303 - Pleasant View | - | - | R+62.5 | 379 |
| 401 - AMELON | R+37.3 | 2,520 | - | - |
| 401 - Amelon | - | - | R+57.9 | 1,279 |
| 402 - LONCO | R+37.5 | 848 | - | - |
| 402 - Lonco | - | - | R+61.1 | 370 |
| 501 - MADISON | R+28.3 | 2,976 | - | - |
| 501 - Madison | - | - | R+49.4 | 1,341 |
Halifax County: 40 precincts
| Precinct | 2024 President | 2020 President | ||
|---|---|---|---|---|
| Margin | Votes | Margin | Votes | |
| 101 - CHILDREY | R+26.7 | 805 | - | - |
| 101 - Childrey | - | - | R+48.5 | 487 |
| 102 - LIBERTY | R+34.1 | 414 | - | - |
| 102 - Liberty | - | - | R+49.8 | 263 |
| 103 - REPUBLICAN GROVE | R+19.0 | 920 | - | - |
| 103 - Republican Grove | - | - | R+33.8 | 438 |
| 201 - CLAYS MILL | R+38.6 | 617 | - | - |
| 201 - Clays Mill | - | - | R+70.6 | 272 |
| 202 - CROSSROADS | R+27.2 | 558 | - | - |
| 202 - Crossroads | - | - | R+57.1 | 340 |
| 203 - CLOVER | R+14.4 | 896 | - | - |
| 203 - Clover | - | - | R+33.1 | 465 |
| 302 - MEADVILLE | D+25.4 | 354 | - | - |
| 302 - Meadville | - | - | D+2.2 | 184 |
| 304 - VERNON HILL | R+38.1 | 646 | - | - |
| 304 - Vernon Hill | - | - | R+61.7 | 350 |
| 305 - SINAI (0001,0000) | D+14.6 | 1,235 | - | - |
| 305 - Sinai | - | - | D+6.8 | 336 |
| 401 - COURTHOUSE (1160C,1160A,1160D,1160B,0000) | R+4.1 | 1,096 | - | - |
| 401 - Courthouse | - | - | R+33.2 | 271 |
| 403 - CENTER (0000,1160D,2280,1160B) | R+23.4 | 1,211 | - | - |
| 403 - Center | - | - | R+40.8 | 321 |
| 502 - DAN RIVER (0000,0001) | R+22.3 | 1,385 | - | - |
| 502 - Dan River | - | - | R+40.7 | 501 |
| 503 - SCOTTSBURG (0001,0000) | R+56.6 | 758 | - | - |
| 503 - Scottsburg | - | - | R+67.0 | 448 |
| 601 - BLACK WALNUT | R+35.6 | 905 | - | - |
| 601 - Black Walnut | - | - | R+69.3 | 365 |
| 603 - MT CARMEL | R+17.8 | 1,199 | - | - |
| 603 - Mt Carmel | - | - | R+40.8 | 574 |
| 605 - UNION (2280,0000) | R+37.6 | 404 | - | - |
| 605 - Union | - | - | R+56.4 | 195 |
| 701 - HYCO (0000,0001) | R+49.2 | 1,261 | - | - |
| 701 - Hyco | - | - | R+66.5 | 571 |
| 702 - MIDWAY (0001,0000) | R+67.3 | 792 | - | - |
| 702 - Midway | - | - | R+77.4 | 509 |
| 703 - VIRGILINA (0001,0000) | R+66.3 | 561 | - | - |
| 703 - Virgilina | - | - | R+76.1 | 381 |
| 801 - SOUTH BOSTON (0000,0001) | D+36.1 | 1,613 | - | - |
| 801 - South Boston | - | - | D+35.7 | 471 |
Goochland County: 20 precincts
| Precinct | 2024 President | 2020 President | ||
|---|---|---|---|---|
| Margin | Votes | Margin | Votes | |
| 101 - FIFE | R+30.5 | 1,477 | - | - |
| 101 - Fife | - | - | R+54.8 | 589 |
| 102 - HADENSVILLE | R+30.7 | 1,876 | - | - |
| 102 - Hadensville | - | - | R+60.7 | 848 |
| 201 - THREE SQUARE | R+14.6 | 1,612 | - | - |
| 201 - Three Square | - | - | R+35.7 | 266 |
| 202 - SANDY HOOK | R+14.5 | 1,707 | - | - |
| 202 - Sandy Hook | - | - | R+41.9 | 762 |
| 301 - BEAVERDAM | R+20.3 | 2,096 | - | - |
| 301 - Goochland Court House 1 | - | - | R+53.6 | 502 |
| 302 - RANDOLPH | R+12.0 | 1,425 | - | - |
| 401 - SHALLOW WELL | R+35.5 | 1,001 | - | - |
| 401 - Shallow Well | - | - | R+50.6 | 799 |
| 402 - CENTERVILLE | R+19.5 | 2,539 | - | - |
| 402 - Centerville | - | - | R+51.7 | 545 |
| 403 - WEST CREEK | D+16.4 | 1,210 | - | - |
| 501 - MANAKIN | R+24.6 | 2,035 | - | - |
| 501 - Manakin | - | - | R+55.7 | 909 |
| 502 - BLAIR | R+13.4 | 2,547 | - | - |
| 502 - Blair Road | - | - | R+45.0 | 626 |
Danville city: 32 precincts
| Precinct | 2024 President | 2020 President | ||
|---|---|---|---|---|
| Margin | Votes | Margin | Votes | |
| 001 - WARD ONE | D+55.3 | 541 | - | - |
| 002 - WARD TWO | D+26.6 | 533 | - | - |
| 003 - WARD THREE | D+44.0 | 992 | - | - |
| 004 - WARD FOUR | D+10.3 | 1,982 | - | - |
| 006 - WARD SIX | D+54.8 | 509 | - | - |
| 007 - WARD SEVEN | D+62.5 | 872 | - | - |
| 008 - WARD EIGHT | D+37.1 | 848 | - | - |
| 009 - WARD NINE | D+10.0 | 820 | - | - |
| 010 - WARD TEN | D+21.6 | 1,153 | - | - |
| 011 - WARD ELEVEN | D+37.4 | 1,529 | - | - |
| 012 - WARD TWELVE | D+30.8 | 1,585 | - | - |
| 013 - WARD THIRTEEN | D+34.2 | 1,423 | - | - |
| 014 - WARD FOURTEEN | D+84.6 | 208 | - | - |
| 015 - WARD FIFTEEN | D+4.3 | 1,377 | - | - |
| 016 - WARD SIXTEEN | R+16.1 | 1,593 | - | - |
| 017 - WARD SEVENTEEN | R+30.2 | 1,468 | - | - |
| 1 - Ward One | - | - | D+57.6 | 224 |
| 10 - Ward Ten | - | - | D+9.8 | 501 |
| 11 - Ward Eleven | - | - | D+37.1 | 560 |
| 12 - Ward Twelve | - | - | D+12.6 | 618 |
| 13 - Ward Thirteen | - | - | D+20.2 | 610 |
| 14 - Ward Fourteen | - | - | D+86.8 | 91 |
| 15 - Ward Fifteen | - | - | R+12.1 | 611 |
| 16 - Ward Sixteen | - | - | R+29.2 | 753 |
| 17 - Ward Seventeen | - | - | R+48.3 | 520 |
| 2 - Ward Two | - | - | D+11.0 | 228 |
| 3 - Ward Three | - | - | D+34.2 | 380 |
| 4 - Ward Four | - | - | D+0.0 | 833 |
| 6 - Ward Six | - | - | D+70.8 | 243 |
| 7 - Ward Seven | - | - | D+59.8 | 430 |
| 8 - Ward Eight | - | - | D+35.7 | 415 |
| 9 - Ward Nine | - | - | R+0.8 | 396 |
Mecklenburg County: 39 precincts
| Precinct | 2024 President | 2020 President | ||
|---|---|---|---|---|
| Margin | Votes | Margin | Votes | |
| 101 - PALMER SPRINGS | D+14.2 | 618 | - | - |
| 101 - Wrights Store | - | - | R+14.3 | 329 |
| 102 - ANTIOCH CHURCH | R+52.9 | 240 | - | - |
| 102 - Pearsons Store | - | - | R+49.3 | 148 |
| 103 - CLARKSVILLE SOUTH (0001,0000) | D+11.3 | 906 | - | - |
| 103 - South Clarksville | - | - | R+13.7 | 468 |
| 201 - CHASE CITY (0000,0001) | D+13.7 | 1,146 | - | - |
| 202 - BLUESTONE | R+3.8 | 266 | - | - |
| 202 - Bluestone Senior High School | - | - | D+26.3 | 114 |
| 203 - Chase City Vfw Post | - | - | D+63.3 | 237 |
| 301 - BRACEY | R+51.7 | 1,179 | - | - |
| 301 - Bracey | - | - | R+63.5 | 724 |
| 302 - LACROSSE (1400,0320,0000) | R+13.5 | 698 | - | - |
| 302 - Lacrosse | - | - | R+35.4 | 449 |
| 401 - American Legion Hall | - | - | D+21.6 | 624 |
| 401 - SOUTH HILL WEST (0000,2290C,1400,2290A) | D+14.4 | 1,532 | - | - |
| 402 - Park View Middle School | - | - | D+4.8 | 124 |
| 501 - SOUTH HILL EAST (0320-BRODNAX,0000,1400,2290B) | R+21.2 | 1,527 | - | - |
| 601 - BASKERVILLE | R+33.2 | 455 | - | - |
| 601 - Baskerville | - | - | R+55.4 | 287 |
| 602 - UNION LEVEL | R+58.5 | 347 | - | - |
| 602 - Union Level | - | - | R+71.3 | 251 |
| 603 - SMITH CROSSROADS | R+27.3 | 483 | - | - |
| 603 - Smith Crossroads | - | - | R+48.6 | 185 |
| 604 - LAKE GASTON | R+40.6 | 763 | - | - |
| 701 - MIDWAY | R+28.8 | 410 | - | - |
| 702 - Sunshine | - | - | R+49.0 | 351 |
| 702 - WILLIAMS GROVE | R+29.1 | 736 | - | - |
| 703 - CHASE CITY EAST | R+15.2 | 586 | - | - |
| 801 - BOYDTON (0001,0000) | R+18.0 | 473 | - | - |
| 802 - Bluestone | - | - | R+56.2 | 390 |
| 802 - CLARKSVILLE VFW | R+29.1 | 980 | - | - |
| 803 - CHASE CITY WEST | R+54.3 | 600 | - | - |
| 803 - Chase City Elementary School | - | - | R+35.1 | 333 |
| 901 - NELSON | R+70.0 | 287 | - | - |
| 902 - BUFFALO JUNCTION | R+49.9 | 513 | - | - |
| 902 - Buffalo Springs | - | - | R+53.3 | 257 |
| 903 - CLARKSVILLE NORTH (0001,0000) | R+30.0 | 1,317 | - | - |
| 903 - Clarksville | - | - | R+53.4 | 624 |
Fluvanna County: 10 precincts
| Precinct | 2024 President | 2020 President | ||
|---|---|---|---|---|
| Margin | Votes | Margin | Votes | |
| 101 - PALMYRA | D+2.3 | 3,216 | - | - |
| 101 - Palmyra | - | - | R+44.7 | 1,112 |
| 201 - COLUMBIA | R+14.5 | 3,039 | - | - |
| 201 - Columbia | - | - | R+49.3 | 1,033 |
| 301 - FORK UNION | R+10.3 | 3,211 | - | - |
| 301 - Fork Union | - | - | R+40.4 | 1,038 |
| 401 - CUNNINGHAM (0000,0001) | R+23.8 | 3,310 | - | - |
| 401 - Cunningham | - | - | R+64.9 | 1,264 |
| 501 - RIVANNA | D+12.1 | 3,719 | - | - |
| 501 - Rivanna | - | - | R+40.5 | 815 |
Hanover County: 13 precincts
| Precinct | 2024 President | 2020 President | ||
|---|---|---|---|---|
| Margin | Votes | Margin | Votes | |
| 201 - BEAVERDAM | R+48.6 | 2,588 | - | - |
| 201 - Beaverdam | - | - | R+72.2 | 1,180 |
| 202 - BLUNTS | R+27.5 | 1,156 | - | - |
| 202 - Blunts | - | - | R+46.6 | 684 |
| 203 - WILMINGTON PARISH | R+28.3 | 2,384 | - | - |
| 203 - Wilmington Parish | - | - | R+63.1 | 799 |
| 209 - West Hanover | - | - | R+58.0 | 305 |
| 702 - MONTPELIER | R+29.5 | 2,397 | - | - |
| 702 - Montpelier | - | - | R+42.9 | 980 |
| 703 - ROCKVILLE | R+32.6 | 2,162 | - | - |
| 703 - Rockville | - | - | R+55.7 | 1,098 |
| 705 - SOUTH ANNA | R+33.0 | 1,222 | - | - |
| 705 - South Anna | - | - | R+56.2 | 657 |
Appomattox County: 18 precincts
| Precinct | 2024 President | 2020 President | ||
|---|---|---|---|---|
| Margin | Votes | Margin | Votes | |
| 101 - VERA | R+58.3 | 674 | - | - |
| 101 - Vera | - | - | R+73.5 | 393 |
| 102 - PAMPLIN (1850,0000) | R+47.0 | 1,228 | - | - |
| 102 - Pamplin | - | - | R+60.5 | 643 |
| 201 - CHAP | R+30.8 | 402 | - | - |
| 201 - Chap | - | - | R+29.2 | 267 |
| 202 - SPOUT SPRING | R+63.9 | 1,556 | - | - |
| 202 - Spout Spring | - | - | R+73.5 | 720 |
| 301 - US 460 | R+60.5 | 945 | - | - |
| 301 - Us 460 | - | - | R+71.6 | 447 |
| 302 - STONEWALL | R+49.3 | 1,179 | - | - |
| 302 - Stonewall | - | - | R+73.4 | 583 |
| 401 - COURTHOUSE (0000,0090) | R+43.7 | 1,681 | - | - |
| 401 - Courthouse | - | - | R+51.4 | 638 |
| 501 - OAKVILLE | R+47.5 | 1,324 | - | - |
| 501 - Oakville | - | - | R+53.9 | 644 |
| 502 - AGEE | R+39.8 | 563 | - | - |
| 502 - Agee | - | - | R+46.6 | 305 |
Nelson County: 18 precincts
| Precinct | 2024 President | 2020 President | ||
|---|---|---|---|---|
| Margin | Votes | Margin | Votes | |
| 101 - ROCKFISH | R+0.2 | 1,770 | - | - |
| 101 - Rockfish | - | - | R+38.0 | 1,015 |
| 201 - LOVINGSTON | R+17.4 | 1,048 | - | - |
| 201 - Lovingston | - | - | R+50.9 | 501 |
| 202 - SCHUYLER | R+23.8 | 707 | - | - |
| 202 - Schuyler | - | - | R+47.9 | 374 |
| 301 - SHIPMAN | R+15.8 | 1,413 | - | - |
| 301 - Shipman | - | - | R+53.8 | 645 |
| 302 - GLADSTONE | R+38.4 | 242 | - | - |
| 302 - Gladstone | - | - | R+47.9 | 188 |
| 401 - ROSELAND | R+25.0 | 1,514 | - | - |
| 401 - Roseland | - | - | R+66.9 | 767 |
| 402 - MONTEBELLO | R+25.7 | 136 | - | - |
| 402 - Montebello | - | - | R+45.1 | 113 |
| 501 - FABER | D+6.4 | 676 | - | - |
| 501 - Faber | - | - | R+42.8 | 297 |
| 502 - NELLYSFORD | D+21.8 | 1,782 | - | - |
| 502 - Nellysford | - | - | R+35.8 | 597 |
Prince Edward County: 20 precincts
| Precinct | 2024 President | 2020 President | ||
|---|---|---|---|---|
| Margin | Votes | Margin | Votes | |
| 101 - FARMVILLE (0000,0950A,0950E,0950D) | D+2.3 | 1,216 | - | - |
| 101 - Farmville | - | - | R+14.1 | 417 |
| 201 - LOCKETT | R+14.4 | 1,481 | - | - |
| 201 - Lockett | - | - | R+19.0 | 731 |
| 301 - LEIGH | R+11.7 | 1,012 | - | - |
| 301 - Leigh | - | - | R+17.5 | 496 |
| 302 - MT PLEASANT | D+0.2 | 436 | - | - |
| 302 - Mt Pleasant | - | - | D+1.8 | 330 |
| 401 - HAMPDEN | R+8.0 | 995 | - | - |
| 401 - Hampden | - | - | R+22.0 | 542 |
| 501 - DARLINGTON HTS (1850,0000) | R+29.0 | 724 | - | - |
| 501 - Darlington Hts | - | - | R+42.7 | 478 |
| 502 - BUFFALO HTS (0000,0950A) | R+6.3 | 446 | - | - |
| 502 - Buffalo Hts | - | - | R+30.6 | 196 |
| 601 - PROSPECT | D+3.4 | 1,409 | - | - |
| 601 - Prospect | - | - | R+13.5 | 773 |
| 701 - WEST END (0950A,0950B,0000,0950C,0950E) | D+14.2 | 967 | - | - |
| 701 - West End | - | - | R+26.5 | 366 |
| 801 - CENTER (0950D,0950E,0950B,0950C) | D+54.0 | 457 | - | - |
| 801 - Center | - | - | D+48.3 | 290 |
Amelia County: 10 precincts
| Precinct | 2024 President | 2020 President | ||
|---|---|---|---|---|
| Margin | Votes | Margin | Votes | |
| 101 - NUMBER ONE | R+46.2 | 1,357 | - | - |
| 101 - Number One | - | - | R+65.6 | 689 |
| 201 - NUMBER TWO | R+41.2 | 1,615 | - | - |
| 201 - Number Two | - | - | R+59.8 | 702 |
| 301 - NUMBER THREE | R+52.1 | 1,627 | - | - |
| 301 - Number Three | - | - | R+63.3 | 694 |
| 401 - NUMBER FOUR | R+46.3 | 1,698 | - | - |
| 401 - Number Four | - | - | R+66.4 | 550 |
| 501 - NUMBER FIVE | R+36.7 | 1,633 | - | - |
| 501 - Number Five | - | - | R+49.8 | 861 |
Buckingham County: 18 precincts
| Precinct | 2024 President | 2020 President | ||
|---|---|---|---|---|
| Margin | Votes | Margin | Votes | |
| 101 - NEW CANTON | R+11.8 | 1,147 | - | - |
| 101 - New Canton | - | - | R+29.3 | 632 |
| 102 - Georgia Creek | - | - | R+52.4 | 206 |
| 201 - WHITE HALL (0000,0750) | R+26.5 | 1,054 | - | - |
| 301 - CURDSVILLE | R+37.2 | 751 | - | - |
| 302 - NEW STORE | R+44.8 | 444 | - | - |
| 302 - New Store | - | - | R+56.9 | 350 |
| 401 - MAYSVILLE | R+25.2 | 1,204 | - | - |
| 401 - Maysville | - | - | R+43.9 | 501 |
| 501 - WRIGHTS | R+53.2 | 395 | - | - |
| 501 - Wrights | - | - | R+50.8 | 309 |
| 502 - GLENMORE | R+8.7 | 750 | - | - |
| 502 - Glenmore | - | - | R+46.8 | 391 |
| 601 - SLATE RIVER | R+30.5 | 645 | - | - |
| 601 - Slate River | - | - | R+22.3 | 528 |
| 602 - GEORGIA CREEK | R+1.6 | 627 | - | - |
| 701 - GOLD HILL | R+17.2 | 829 | - | - |
| 701 - Gold Hill | - | - | R+33.3 | 333 |
Charlotte County: 14 precincts
| Precinct | 2024 President | 2020 President | ||
|---|---|---|---|---|
| Margin | Votes | Margin | Votes | |
| 101 - COUNTY SEAT (0001,0000) | R+27.4 | 932 | - | - |
| 101 - County Seat | - | - | R+48.5 | 404 |
| 201 - RED OAK WYLLIESBURG | R+29.0 | 878 | - | - |
| 201 - Red Oak Wylliesburg | - | - | R+42.6 | 563 |
| 302 - DRAKES BRANCH (0001,0000,0002) | R+33.7 | 734 | - | - |
| 302 - Drakes Branch | - | - | R+52.1 | 438 |
| 401 - KEYSVILLE (0001,0000) | R+32.6 | 803 | - | - |
| 401 - Keysville | - | - | R+50.4 | 557 |
| 501 - CULLEN/RED HOUSE | R+30.8 | 791 | - | - |
| 501 - Cullen/Red House | - | - | R+42.6 | 423 |
| 602 - PHENIX (0001,0000) | R+48.0 | 946 | - | - |
| 602 - Phenix | - | - | R+67.9 | 536 |
| 702 - BACON/SAXE (0001,0000) | R+26.3 | 844 | - | - |
| 702 - Bacon/Saxe | - | - | R+46.0 | 324 |
Nottoway County: 14 precincts
| Precinct | 2024 President | 2020 President | ||
|---|---|---|---|---|
| Margin | Votes | Margin | Votes | |
| 101 - PRECINCT 1-1 (0002,0000,0001) | R+32.7 | 1,185 | - | - |
| 101 - Precinct 1-1 | - | - | R+52.8 | 375 |
| 102 - Precinct 1-2 | - | - | R+43.3 | 307 |
| 201 - PRECINCT 2-1 (0001,0000) | R+49.7 | 1,481 | - | - |
| 202 - Precinct 2-2 | - | - | R+65.6 | 218 |
| 301 - PRECINCT 3-1 (0000,0001) | D+1.6 | 1,056 | - | - |
| 302 - PRECINCT 3-2 | R+19.9 | 332 | - | - |
| 302 - Precinct 3-2 | - | - | R+60.2 | 231 |
| 401 - PRECINCT 4-1 (0190D,0190A,0190B,0190E,0000) | D+44.6 | 708 | - | - |
| 401 - Precinct 4-1 | - | - | D+44.2 | 292 |
| 402 - PRECINCT 4-2 | R+41.5 | 568 | - | - |
| 402 - Precinct 4-2 | - | - | R+62.2 | 436 |
| 501 - PRECINCT 5-1 (0190A,0190E,0190B,0190C,0000,0190D) | R+29.4 | 1,420 | - | - |
| 501 - Precinct 5-1 | - | - | R+23.5 | 455 |
Lunenburg County: 22 precincts
| Precinct | 2024 President | 2020 President | ||
|---|---|---|---|---|
| Margin | Votes | Margin | Votes | |
| 101 - PLYMOUTH (0001,0000) | R+43.4 | 686 | - | - |
| 101 - Plymouth | - | - | R+62.0 | 334 |
| 201 - BROWNS STORE (0003,0001) | R+11.6 | 758 | - | - |
| 201 - Browns Store | - | - | R+51.1 | 333 |
| 301 - ROSEBUD | R+45.8 | 369 | - | - |
| 301 - Rosebud | - | - | R+66.7 | 288 |
| 302 - FLAT ROCK | R+34.4 | 503 | - | - |
| 302 - Flat Rock | - | - | R+53.4 | 352 |
| 401 - ARROWHEAD GUN CLUB | R+52.2 | 291 | - | - |
| 401 - Arrowhead Gun Club | - | - | R+75.7 | 206 |
| 402 - PLEASANT GROVE | R+35.0 | 574 | - | - |
| 402 - Pleasant Grove | - | - | R+59.5 | 336 |
| 501 - REEDY CREEK | R+8.9 | 462 | - | - |
| 501 - Reedy Creek | - | - | R+25.0 | 180 |
| 502 - PEOPLES COMMUNITY CENTER (0000,0001) | D+24.9 | 503 | - | - |
| 502 - Peoples Community Center | - | - | D+14.9 | 215 |
| 601 - HOUNDS CREEK | R+12.7 | 816 | - | - |
| 601 - Hounds Creek | - | - | D+0.8 | 397 |
| 701 - MEHERRIN FIRE DEPARTMENT | R+24.3 | 411 | - | - |
| 701 - Meherrin Fire Department | - | - | R+23.8 | 240 |
| 702 - VICTORIA PUBLIC LIBRARY (0000,0001) | R+30.1 | 425 | - | - |
| 702 - Victoria Public Library | - | - | R+39.0 | 231 |
Cumberland County: 10 precincts
| Precinct | 2024 President | 2020 President | ||
|---|---|---|---|---|
| Margin | Votes | Margin | Votes | |
| 101 - PRECINCT 1 | R+34.0 | 1,187 | - | - |
| 101 - Precinct 1 | - | - | R+46.7 | 745 |
| 201 - PRECINCT 2 | R+34.0 | 1,111 | - | - |
| 201 - Precinct 2 | - | - | R+54.7 | 569 |
| 301 - PRECINCT 3 | D+1.0 | 1,087 | - | - |
| 301 - Precinct 3 | - | - | R+17.6 | 398 |
| 401 - PRECINCT 4 | R+32.0 | 1,093 | - | - |
| 401 - Precinct 4 | - | - | R+50.1 | 575 |
| 501 - PRECINCT 5 (0950E,0000) | R+8.0 | 937 | - | - |
| 501 - Precinct 5 | - | - | R+29.1 | 530 |
2024 President (Kamala D. Harris vs. Donald J. Trump). Source: Virginia Department of Elections, official election results (Enhanced Voting media export, by locality and precinct). Official, Virginia Department of Elections ENR media export (created 2025-03-05, after State Board certification Dec 2 2024).
2020 President (Joseph Robinette Biden, Jr vs. Donald J. Trump). Source: Virginia Department of Elections, Historical Elections Database (historical.elections.virginia.gov). Certified, Virginia Department of Elections Historical Elections Database (official certified results by locality and precinct; State Board of Elections certification).
Precinct demographics
Demographics are Census American Community Survey (ACS) 2020-2024 5-year estimates for block groups, assigned to precincts by area share. They describe the resident population, not registered or likely voters, and include non-citizens. ACS margins of error are not shown; small precincts carry large error. Area weighting assumes people are spread evenly within each block group, so large rural precincts are the least reliable. Median income is a household-weighted average of block-group medians, an approximation.
| Area | Population | Voting-age pop. | % White non-Hisp. | % Hispanic | % Black | % Asian | Median income* | % Bachelor's+ | % 18-29 (of adults) | % 65+ | % Homeowners | % Below poverty | % Spanish at home (adults) |
|---|---|---|---|---|---|---|---|---|---|---|---|---|---|
| District | 797,537 | 644,074 | 68.8% | 4.6% | 19.8% | 2.0% | $79k | 34.2% | 21.0% | 20.8% | 70.0% | 12.9% | 2.9% |
| Albemarle County (in district) | 114,500 | 92,135 | 73.5% | 7.5% | 9.0% | 5.7% | $113k | 61.1% | 21.9% | 20.5% | 66.0% | 7.6% | 5.4% |
| Lynchburg city (in district) | 79,278 | 63,943 | 59.8% | 5.1% | 27.0% | 2.2% | $65k | 38.5% | 40.5% | 14.3% | 48.8% | 18.6% | 3.0% |
| Pittsylvania County (in district) | 59,911 | 49,171 | 73.1% | 3.1% | 20.4% | 0.3% | $57k | 16.1% | 15.3% | 24.5% | 78.6% | 14.6% | 1.9% |
| Campbell County (in district) | 55,411 | 44,725 | 76.8% | 3.5% | 14.2% | 1.1% | $65k | 26.1% | 17.8% | 21.3% | 74.9% | 10.8% | 2.6% |
| Charlottesville city (in district) | 45,394 | 37,964 | 63.8% | 6.9% | 15.7% | 7.1% | $84k | 62.4% | 34.6% | 13.4% | 44.2% | 19.4% | 3.8% |
| Danville city (in district) | 41,765 | 32,394 | 38.9% | 5.6% | 50.3% | 1.2% | $49k | 19.7% | 19.4% | 21.1% | 47.8% | 24.5% | 3.5% |
| Louisa County (in district) | 39,975 | 31,982 | 76.1% | 4.1% | 11.5% | 0.6% | $90k | 29.7% | 14.5% | 21.0% | 82.2% | 10.0% | 2.6% |
| Halifax County (in district) | 33,618 | 26,771 | 59.4% | 2.6% | 34.4% | 0.6% | $53k | 19.7% | 16.1% | 25.7% | 74.6% | 17.4% | 1.8% |
| Amherst County (in district) | 31,648 | 25,301 | 73.7% | 2.9% | 17.0% | 0.7% | $69k | 24.7% | 17.5% | 21.7% | 80.7% | 10.9% | 1.3% |
| Powhatan County (in district) | 31,505 | 25,744 | 84.7% | 2.9% | 7.2% | 0.3% | $106k | 35.0% | 14.7% | 19.8% | 93.2% | 4.6% | 2.4% |
| Mecklenburg County (in district) | 30,481 | 24,884 | 60.3% | 3.2% | 32.4% | 1.0% | $58k | 20.7% | 14.8% | 26.9% | 68.3% | 16.3% | 2.3% |
| Bedford County (in district) | 28,999 | 22,465 | 81.7% | 2.9% | 8.2% | 1.6% | $95k | 49.8% | 18.8% | 19.6% | 83.5% | 7.5% | 2.1% |
| Fluvanna County (in district) | 28,094 | 22,641 | 75.0% | 4.6% | 11.8% | 0.9% | $94k | 37.3% | 16.4% | 21.8% | 88.7% | 7.7% | 2.8% |
| Goochland County (in district) | 26,593 | 22,282 | 77.6% | 3.8% | 13.6% | 1.9% | $127k | 46.0% | 13.3% | 25.1% | 84.9% | 5.1% | 1.4% |
| Prince Edward County (in district) | 21,920 | 18,575 | 60.0% | 4.9% | 29.5% | 1.1% | $55k | 27.3% | 37.2% | 17.2% | 58.2% | 20.8% | 3.2% |
| Hanover County (in district) | 17,748 | 14,092 | 80.0% | 5.7% | 8.2% | 1.5% | $112k | 42.9% | 12.6% | 21.4% | 86.4% | 5.5% | 1.7% |
| Buckingham County (in district) | 16,986 | 13,966 | 60.9% | 2.6% | 30.6% | 0.4% | $64k | 14.5% | 15.5% | 20.8% | 77.3% | 12.5% | 1.6% |
| Appomattox County (in district) | 16,598 | 12,941 | 76.3% | 2.4% | 15.9% | 0.4% | $64k | 19.2% | 16.4% | 21.1% | 75.8% | 14.0% | 0.5% |
| Nottoway County (in district) | 15,579 | 12,577 | 54.1% | 4.9% | 36.2% | 0.8% | $68k | 14.1% | 18.7% | 18.8% | 66.6% | 18.4% | 2.8% |
| Nelson County (in district) | 14,746 | 12,177 | 79.8% | 4.8% | 11.0% | 0.9% | $81k | 36.2% | 13.2% | 29.6% | 79.7% | 12.5% | 2.2% |
| Amelia County (in district) | 13,490 | 10,768 | 72.1% | 3.9% | 19.4% | 0.2% | $82k | 18.7% | 16.0% | 22.2% | 82.5% | 9.7% | 3.0% |
| Lunenburg County (in district) | 12,024 | 9,675 | 57.4% | 6.1% | 32.4% | 0.2% | $59k | 11.6% | 14.0% | 23.3% | 71.4% | 15.9% | 3.1% |
| Charlotte County (in district) | 11,422 | 8,968 | 68.2% | 2.6% | 24.7% | 0.2% | $62k | 20.1% | 16.1% | 22.7% | 74.7% | 18.9% | 1.3% |
| Cumberland County (in district) | 9,852 | 7,932 | 64.0% | 2.1% | 29.4% | 0.0% | $58k | 20.8% | 14.5% | 23.5% | 75.7% | 8.6% | 2.2% |
Albemarle County: 30 precincts
| Precinct | Population | Voting-age pop. | % White non-Hisp. | % Hispanic | % Black | % Asian | Median income* | % Bachelor's+ | % 18-29 (of adults) | % 65+ | % Homeowners | % Below poverty | % Spanish at home (adults) |
|---|---|---|---|---|---|---|---|---|---|---|---|---|---|
| Agnor Hurt | 3,461 | 2,944 | 54.7% | 15.3% | 19.9% | 7.0% | $71k | 40.9% | 21.1% | 25.7% | 52.6% | 15.8% | 11.4% |
| Baker-Butler | 7,321 | 5,406 | 74.8% | 11.2% | 2.3% | 5.8% | $130k | 58.0% | 11.6% | 17.1% | 83.5% | 5.3% | 10.0% |
| Biscuit Run | 5,106 | 4,076 | 51.0% | 25.7% | 11.0% | 8.9% | $85k | 60.0% | 28.0% | 6.6% | 33.9% | 17.4% | 19.1% |
| Branchlands | 2,625 | 2,122 | 63.8% | 13.0% | 17.9% | 2.0% | $71k | 49.6% | 23.1% | 36.2% | 35.2% | 8.9% | 11.2% |
| Brownsville | 4,161 | 3,024 | 89.2% | 5.3% | 0.8% | 2.5% | $142k | 69.7% | 14.2% | 20.0% | 73.8% | 5.7% | 3.9% |
| Country Green | 3,681 | 2,732 | 74.9% | 2.8% | 8.9% | 10.2% | $139k | 70.7% | 15.9% | 12.6% | 74.8% | 9.5% | 2.7% |
| Crozet | 4,347 | 3,340 | 83.8% | 6.1% | 5.6% | 1.7% | $112k | 63.9% | 8.5% | 20.3% | 79.7% | 6.3% | 2.7% |
| Dunlora | 4,532 | 3,749 | 77.8% | 3.9% | 6.6% | 5.6% | $130k | 75.1% | 13.2% | 26.3% | 73.0% | 2.8% | 3.2% |
| Earlysville | 4,271 | 3,219 | 82.5% | 2.0% | 2.8% | 2.7% | $128k | 64.2% | 8.5% | 26.4% | 92.6% | 5.8% | 0.5% |
| East Ivy | 1,337 | 1,107 | 87.2% | 1.4% | 2.0% | 6.0% | $144k | 84.0% | 15.2% | 38.1% | 93.1% | 6.0% | 1.2% |
| Free Bridge | 2,579 | 2,072 | 65.1% | 3.1% | 16.7% | 9.0% | $116k | 69.7% | 16.4% | 25.4% | 43.2% | 2.2% | 1.0% |
| Free Union (part) | 2,062 | 1,687 | 88.5% | 0.6% | 3.2% | 1.1% | $125k | 65.1% | 8.6% | 28.4% | 89.5% | 5.0% | 1.0% |
| Georgetown | 5,749 | 4,895 | 52.2% | 14.1% | 17.8% | 12.5% | $59k | 41.2% | 35.9% | 14.3% | 23.2% | 17.3% | 9.3% |
| Hollymead | 2,446 | 1,946 | 71.8% | 7.8% | 5.4% | 8.9% | $111k | 69.3% | 20.9% | 21.3% | 73.6% | 2.6% | 3.3% |
| Ivy | 4,732 | 3,532 | 89.7% | 3.1% | 0.5% | 2.2% | $177k | 84.3% | 3.5% | 23.2% | 89.6% | 1.5% | 3.0% |
| Jack Jouett | 5,278 | 4,178 | 62.0% | 14.5% | 15.9% | 4.2% | $137k | 61.4% | 14.1% | 30.6% | 51.2% | 13.7% | 10.3% |
| Keswick | 2,450 | 1,923 | 72.0% | 3.7% | 23.0% | 0.7% | $83k | 57.3% | 9.4% | 27.6% | 74.2% | 3.1% | 6.6% |
| Mechums River | 3,906 | 2,868 | 84.6% | 1.7% | 4.0% | 4.6% | $118k | 71.3% | 10.6% | 13.0% | 80.9% | 7.3% | 0.3% |
| Monticello | 2,342 | 1,973 | 97.8% | 0.3% | 1.0% | 0.1% | $99k | 37.6% | 6.7% | 28.2% | 76.4% | 4.1% | 1.9% |
| Mountain View | 4,661 | 3,909 | 74.3% | 7.7% | 9.6% | 2.4% | $104k | 65.0% | 17.3% | 19.6% | 52.2% | 6.3% | 3.4% |
| Northside | 4,484 | 3,543 | 70.5% | 13.1% | 11.3% | 3.0% | $142k | 59.5% | 19.5% | 15.5% | 80.8% | 6.0% | 5.9% |
| Pantops | 2,761 | 2,223 | 75.5% | 1.0% | 1.9% | 15.9% | $140k | 70.4% | 16.9% | 22.0% | 80.6% | 0.9% | 1.3% |
| Porters | 2,647 | 2,134 | 71.5% | 4.8% | 17.2% | 0.0% | $99k | 37.7% | 15.7% | 25.7% | 86.1% | 6.3% | 3.3% |
| Red Hill | 3,951 | 3,184 | 88.1% | 2.2% | 6.9% | 0.8% | $97k | 54.9% | 8.0% | 22.7% | 82.1% | 5.7% | 4.2% |
| Scottsville | 2,437 | 2,026 | 72.0% | 5.4% | 18.9% | 0.3% | $86k | 35.3% | 15.9% | 20.5% | 69.4% | 9.9% | 3.9% |
| Stone Robinson | 3,823 | 3,046 | 80.2% | 4.7% | 8.9% | 2.8% | $129k | 68.6% | 8.0% | 32.4% | 82.0% | 3.9% | 3.8% |
| Stony Point | 2,158 | 1,869 | 84.6% | 6.8% | 2.3% | 1.1% | $131k | 52.9% | 12.5% | 33.7% | 70.9% | 1.4% | 5.0% |
| University | 9,001 | 8,579 | 58.4% | 6.1% | 12.8% | 18.1% | $58k | 68.3% | 84.7% | 3.2% | 20.8% | 22.5% | 3.2% |
| Woodbrook | 4,081 | 3,276 | 77.5% | 6.3% | 7.4% | 4.1% | $118k | 65.5% | 19.8% | 22.2% | 64.5% | 7.2% | 5.0% |
| Yellow Mountain | 2,108 | 1,555 | 90.9% | 6.1% | 0.8% | 0.7% | $113k | 53.3% | 11.5% | 22.7% | 79.6% | 7.7% | 5.0% |
Lynchburg city: 18 precincts
| Precinct | Population | Voting-age pop. | % White non-Hisp. | % Hispanic | % Black | % Asian | Median income* | % Bachelor's+ | % 18-29 (of adults) | % 65+ | % Homeowners | % Below poverty | % Spanish at home (adults) |
|---|---|---|---|---|---|---|---|---|---|---|---|---|---|
| Ward I Precinct 1 | 7,373 | 5,582 | 60.8% | 2.7% | 27.6% | 2.5% | $57k | 34.7% | 34.1% | 14.9% | 41.4% | 19.6% | 1.1% |
| Ward I Precinct 2 | 4,890 | 3,554 | 74.0% | 7.9% | 6.2% | 1.6% | $97k | 64.8% | 23.1% | 18.9% | 71.1% | 5.8% | 0.3% |
| Ward I Precinct 3 | 2,905 | 1,973 | 88.1% | 1.7% | 5.2% | 0.9% | $120k | 76.6% | 8.6% | 26.2% | 78.2% | 4.2% | 0.3% |
| Ward I Precinct 4 | 1,945 | 1,621 | 70.5% | 7.1% | 8.9% | 1.0% | $70k | 55.4% | 38.8% | 21.9% | 53.6% | 8.0% | 3.0% |
| Ward I Precinct 5 | 1,678 | 1,212 | 81.9% | 2.9% | 10.5% | 0.4% | $109k | 66.7% | 18.0% | 18.3% | 75.0% | 9.7% | 2.0% |
| Ward II Precinct 1 | 8,755 | 6,503 | 38.6% | 3.2% | 53.4% | 0.7% | $41k | 23.8% | 30.7% | 16.2% | 36.8% | 28.1% | 2.1% |
| Ward II Precinct 2 | 6,648 | 5,109 | 27.5% | 5.1% | 58.9% | 0.4% | $46k | 21.5% | 28.3% | 12.2% | 37.3% | 29.7% | 4.5% |
| Ward II Precinct 3 | 1,742 | 1,410 | 36.0% | 0.6% | 61.0% | 0.0% | $54k | 16.3% | 17.0% | 12.8% | 35.5% | 30.0% | 0.2% |
| Ward II Precinct 4 | 2,281 | 1,908 | 50.8% | 1.4% | 42.7% | 0.7% | $57k | 22.2% | 39.7% | 14.3% | 63.0% | 28.2% | 0.8% |
| Ward III Precinct 1 | 1,401 | 1,063 | 51.3% | 5.3% | 37.3% | 1.1% | $55k | 28.7% | 36.5% | 8.1% | 52.5% | 15.9% | 2.0% |
| Ward III Precinct 2 | 4,224 | 4,174 | 66.7% | 8.9% | 13.2% | 6.2% | $47k | 33.3% | 99.7% | 0.1% | 54.4% | 17.9% | 4.9% |
| Ward III Precinct 3 | 4,346 | 4,056 | 70.5% | 6.1% | 16.9% | 1.4% | $66k | 24.5% | 58.8% | 13.7% | 55.9% | 15.2% | 3.1% |
| Ward III Precinct 4 | 3,236 | 2,836 | 56.6% | 16.8% | 23.5% | 0.8% | $49k | 27.8% | 45.7% | 10.8% | 37.4% | 27.9% | 9.6% |
| Ward III Precinct 5 | 6,493 | 5,403 | 62.9% | 9.1% | 19.8% | 4.6% | $57k | 43.7% | 47.5% | 10.9% | 42.0% | 20.7% | 6.5% |
| Ward IV Precinct 2 | 3,096 | 2,257 | 70.0% | 0.5% | 16.1% | 2.2% | $70k | 44.8% | 16.4% | 19.0% | 63.3% | 12.8% | 2.0% |
| Ward IV Precinct 1 | 8,002 | 6,547 | 62.9% | 3.8% | 22.8% | 5.5% | $79k | 42.2% | 34.8% | 18.1% | 45.4% | 13.4% | 2.3% |
| Ward IV Precinct 3 | 5,805 | 5,107 | 68.1% | 5.3% | 17.9% | 2.9% | $65k | 41.0% | 62.2% | 7.0% | 46.4% | 22.2% | 3.2% |
| Ward IV Precinct 4 | 4,458 | 3,628 | 75.4% | 1.7% | 16.6% | 0.4% | $76k | 43.2% | 30.2% | 18.9% | 63.1% | 7.9% | 1.1% |
Pittsylvania County: 29 precincts
| Precinct | Population | Voting-age pop. | % White non-Hisp. | % Hispanic | % Black | % Asian | Median income* | % Bachelor's+ | % 18-29 (of adults) | % 65+ | % Homeowners | % Below poverty | % Spanish at home (adults) |
|---|---|---|---|---|---|---|---|---|---|---|---|---|---|
| Bachelors Hall | 1,965 | 1,511 | 88.1% | 0.2% | 2.2% | 1.1% | $68k | 13.8% | 16.0% | 22.3% | 80.6% | 12.6% | 1.4% |
| Bearskin | 1,113 | 979 | 68.7% | 0.6% | 27.1% | 0.7% | $44k | 11.8% | 11.9% | 35.1% | 83.3% | 23.5% | 0.7% |
| Brosville | 1,717 | 1,315 | 58.3% | 0.2% | 27.5% | 0.5% | $62k | 15.1% | 17.7% | 20.9% | 68.1% | 3.7% | 0.4% |
| Callands | 1,824 | 1,579 | 82.3% | 0.2% | 14.0% | 0.2% | $49k | 12.6% | 16.4% | 23.9% | 88.4% | 10.8% | 0.3% |
| Central | 1,766 | 1,483 | 66.5% | 4.3% | 26.0% | 0.1% | $47k | 20.9% | 12.8% | 22.3% | 67.5% | 15.6% | 2.7% |
| Chatham | 1,652 | 1,326 | 77.9% | 4.1% | 12.6% | 0.0% | $57k | 25.3% | 14.8% | 23.0% | 69.0% | 10.2% | 2.8% |
| Climax | 2,582 | 2,296 | 57.4% | 2.1% | 38.7% | 0.5% | $35k | 12.8% | 11.6% | 23.7% | 75.2% | 23.5% | 1.2% |
| Dry Fork | 1,120 | 906 | 71.4% | 5.6% | 20.7% | 0.0% | $53k | 19.4% | 5.8% | 26.5% | 74.2% | 12.6% | 5.2% |
| East Blairs | 2,094 | 1,718 | 59.4% | 3.6% | 33.8% | 0.6% | $60k | 15.7% | 16.9% | 22.0% | 86.2% | 10.8% | 2.0% |
| East Gretna | 747 | 596 | 66.2% | 11.9% | 20.9% | 0.0% | $51k | 16.7% | 12.1% | 24.4% | 66.1% | 20.7% | 3.4% |
| Ferry Road | 681 | 608 | 87.7% | 0.0% | 10.7% | 0.0% | $114k | 5.8% | 9.9% | 31.8% | 82.4% | 5.0% | 0.0% |
| Gretna | 3,463 | 2,753 | 66.0% | 6.7% | 25.3% | 0.7% | $42k | 16.3% | 13.7% | 29.7% | 68.7% | 24.1% | 1.5% |
| Hurt | 3,453 | 2,800 | 76.8% | 1.9% | 18.1% | 0.0% | $49k | 11.8% | 14.8% | 26.5% | 72.8% | 22.9% | 1.1% |
| Keeling | 1,626 | 1,317 | 82.1% | 2.0% | 7.2% | 0.0% | $74k | 10.0% | 10.5% | 23.2% | 97.4% | 4.6% | 1.1% |
| Kentuck | 3,206 | 2,536 | 67.7% | 2.4% | 26.2% | 0.1% | $51k | 15.6% | 17.8% | 19.8% | 85.2% | 14.5% | 0.8% |
| Motley Sycamore | 4,113 | 3,380 | 79.4% | 0.0% | 18.3% | 0.0% | $40k | 9.5% | 14.1% | 27.1% | 71.8% | 21.6% | 0.0% |
| Mt. Airy | 1,266 | 1,076 | 65.0% | 2.4% | 32.3% | 0.0% | $45k | 12.4% | 11.7% | 30.4% | 85.4% | 16.9% | 0.6% |
| Mt. Cross | 1,637 | 1,382 | 92.6% | 4.0% | 2.0% | 0.6% | $61k | 21.6% | 13.9% | 27.0% | 74.7% | 10.7% | 0.3% |
| Mt. Hermon | 4,707 | 4,026 | 73.4% | 1.1% | 21.2% | 1.4% | $73k | 22.4% | 22.8% | 18.9% | 76.2% | 9.1% | 0.4% |
| Renan | 1,209 | 1,093 | 72.3% | 1.9% | 25.5% | 0.0% | $44k | 14.5% | 11.9% | 34.4% | 89.7% | 19.9% | 0.5% |
| Riceville | 1,074 | 839 | 55.8% | 5.6% | 36.7% | 0.0% | $58k | 9.3% | 11.1% | 28.7% | 85.0% | 8.5% | 4.0% |
| Ringgold | 3,109 | 2,600 | 77.3% | 0.4% | 20.5% | 0.0% | $52k | 12.5% | 22.0% | 22.1% | 71.9% | 27.6% | 0.3% |
| Sandy Level | 1,350 | 1,141 | 79.9% | 1.0% | 17.6% | 0.0% | $54k | 8.8% | 20.7% | 18.9% | 74.7% | 14.9% | 0.0% |
| Stony Mill | 2,413 | 1,859 | 61.5% | 18.0% | 17.6% | 0.5% | $60k | 13.6% | 24.9% | 16.5% | 72.5% | 10.7% | 15.1% |
| Swansonville | 1,314 | 1,035 | 63.4% | 4.4% | 28.6% | 0.1% | $60k | 15.8% | 12.7% | 20.6% | 87.7% | 6.6% | 4.0% |
| Tunstall | 2,170 | 1,751 | 91.9% | 1.5% | 4.8% | 0.0% | $84k | 28.7% | 12.3% | 26.5% | 88.9% | 8.9% | 1.3% |
| Twin Springs | 3,727 | 3,075 | 80.3% | 3.5% | 13.7% | 0.0% | $67k | 25.8% | 10.4% | 31.9% | 86.3% | 10.0% | 2.8% |
| West Blairs | 949 | 759 | 63.2% | 3.3% | 31.4% | 0.1% | $66k | 15.8% | 9.3% | 23.7% | 89.1% | 9.9% | 3.7% |
| Whitmell | 1,865 | 1,436 | 72.5% | 4.1% | 19.2% | 0.0% | $60k | 16.4% | 14.0% | 21.9% | 86.9% | 8.4% | 3.8% |
Campbell County: 16 precincts
| Precinct | Population | Voting-age pop. | % White non-Hisp. | % Hispanic | % Black | % Asian | Median income* | % Bachelor's+ | % 18-29 (of adults) | % 65+ | % Homeowners | % Below poverty | % Spanish at home (adults) |
|---|---|---|---|---|---|---|---|---|---|---|---|---|---|
| ALTAVISTA | 3,184 | 2,474 | 64.9% | 3.5% | 28.3% | 0.5% | $49k | 27.4% | 29.3% | 19.7% | 54.9% | 12.2% | 0.4% |
| BEDFORD SPRINGS | 3,257 | 2,367 | 67.0% | 0.7% | 18.3% | 1.4% | $60k | 34.0% | 16.4% | 10.4% | 72.9% | 9.2% | 1.8% |
| BROOKNEAL | 680 | 565 | 60.5% | 0.4% | 29.9% | 0.0% | $45k | 9.5% | 14.5% | 25.2% | 70.5% | 24.1% | 0.6% |
| BROOKVILLE | 3,947 | 3,120 | 81.6% | 5.1% | 7.1% | 2.0% | $77k | 32.8% | 13.0% | 24.5% | 75.4% | 9.1% | 4.1% |
| CONCORD | 3,853 | 3,182 | 84.4% | 3.7% | 10.6% | 0.1% | $77k | 23.3% | 12.2% | 26.1% | 85.7% | 10.6% | 1.7% |
| COURT HOUSE | 4,923 | 3,985 | 82.9% | 0.3% | 12.0% | 1.1% | $60k | 24.2% | 16.4% | 21.1% | 75.0% | 10.0% | 0.9% |
| EVINGTON | 2,667 | 2,063 | 77.1% | 5.0% | 7.3% | 3.9% | $76k | 27.4% | 17.7% | 17.8% | 87.6% | 12.5% | 5.6% |
| GLADYS | 5,286 | 4,130 | 73.3% | 1.7% | 21.2% | 0.1% | $61k | 20.7% | 15.3% | 23.7% | 84.7% | 12.0% | 1.7% |
| KINGS | 2,550 | 2,095 | 86.4% | 5.5% | 6.0% | 0.2% | $62k | 24.4% | 17.1% | 28.0% | 72.2% | 14.0% | 4.5% |
| MORRIS CHURCH | 3,160 | 2,575 | 77.3% | 0.4% | 20.1% | 0.0% | $58k | 12.6% | 11.4% | 24.8% | 87.2% | 8.7% | 0.5% |
| NEW LONDON | 4,347 | 3,619 | 75.6% | 1.5% | 13.8% | 1.0% | $73k | 32.1% | 23.3% | 16.6% | 65.8% | 4.4% | 0.9% |
| OTTER RIVER | 2,513 | 2,027 | 77.7% | 3.4% | 11.8% | 0.8% | $55k | 18.8% | 11.9% | 26.1% | 86.2% | 13.5% | 3.0% |
| SPRING HILL | 5,551 | 4,763 | 76.4% | 6.4% | 13.0% | 1.7% | $61k | 33.7% | 22.7% | 25.3% | 69.9% | 12.5% | 3.6% |
| THREE FORKS | 2,962 | 2,444 | 84.8% | 0.6% | 10.5% | 0.7% | $67k | 24.0% | 17.8% | 18.9% | 80.9% | 17.2% | 1.1% |
| WALKER | 3,564 | 2,948 | 68.1% | 13.9% | 13.9% | 0.7% | $64k | 31.3% | 21.2% | 15.4% | 55.7% | 10.8% | 7.9% |
| YELLOW BRANCH | 2,968 | 2,369 | 78.5% | 1.3% | 11.8% | 2.7% | $73k | 23.3% | 18.9% | 17.5% | 81.5% | 6.6% | 2.3% |
Charlottesville city: 9 precincts
| Precinct | Population | Voting-age pop. | % White non-Hisp. | % Hispanic | % Black | % Asian | Median income* | % Bachelor's+ | % 18-29 (of adults) | % 65+ | % Homeowners | % Below poverty | % Spanish at home (adults) |
|---|---|---|---|---|---|---|---|---|---|---|---|---|---|
| Buford | 5,564 | 4,239 | 37.0% | 10.1% | 40.8% | 4.9% | $66k | 40.3% | 30.8% | 10.1% | 39.5% | 26.6% | 5.4% |
| CHS | 4,846 | 3,892 | 76.8% | 5.0% | 9.6% | 2.8% | $129k | 68.1% | 12.2% | 22.1% | 79.8% | 9.2% | 2.3% |
| Carver | 5,000 | 4,232 | 63.3% | 7.6% | 18.5% | 5.1% | $76k | 62.6% | 38.4% | 13.4% | 29.8% | 18.8% | 4.4% |
| Clark | 4,814 | 3,945 | 67.4% | 5.6% | 18.6% | 4.2% | $86k | 57.6% | 15.1% | 13.4% | 57.7% | 12.0% | 3.8% |
| Jackson-Via | 4,841 | 3,860 | 62.8% | 6.8% | 14.7% | 9.4% | $82k | 66.8% | 18.1% | 14.9% | 54.2% | 15.1% | 2.8% |
| Johnson | 5,322 | 4,749 | 58.9% | 12.0% | 5.1% | 18.8% | $66k | 71.4% | 59.5% | 7.7% | 28.8% | 31.5% | 4.6% |
| Key Rec. | 5,872 | 4,963 | 75.3% | 7.2% | 6.6% | 2.7% | $94k | 68.8% | 14.4% | 17.4% | 42.9% | 4.2% | 5.6% |
| Venable | 4,730 | 4,480 | 67.8% | 2.9% | 16.1% | 10.1% | $32k | 57.0% | 76.5% | 9.4% | 13.5% | 47.2% | 3.1% |
| Walker | 4,406 | 3,605 | 67.8% | 3.6% | 10.1% | 5.9% | $97k | 66.9% | 41.0% | 12.8% | 42.2% | 22.7% | 0.9% |
Danville city: 16 precincts
| Precinct | Population | Voting-age pop. | % White non-Hisp. | % Hispanic | % Black | % Asian | Median income* | % Bachelor's+ | % 18-29 (of adults) | % 65+ | % Homeowners | % Below poverty | % Spanish at home (adults) |
|---|---|---|---|---|---|---|---|---|---|---|---|---|---|
| Ward Eight | 1,846 | 1,418 | 28.5% | 6.4% | 59.3% | 0.0% | $43k | 10.4% | 18.6% | 19.5% | 44.5% | 25.5% | 4.9% |
| Ward Eleven | 3,726 | 2,709 | 32.5% | 8.4% | 52.4% | 4.3% | $43k | 14.5% | 16.8% | 21.9% | 47.8% | 26.1% | 8.6% |
| Ward Fifteen | 3,928 | 3,004 | 45.3% | 6.2% | 43.7% | 0.2% | $53k | 20.8% | 19.3% | 14.6% | 47.2% | 24.9% | 3.8% |
| Ward Four | 4,415 | 3,526 | 43.4% | 7.2% | 43.0% | 2.0% | $43k | 22.7% | 21.6% | 20.4% | 41.7% | 25.1% | 4.7% |
| Ward Fourteen | 596 | 389 | 37.6% | 5.1% | 55.3% | 0.8% | $38k | 15.6% | 9.0% | 21.0% | 32.8% | 36.3% | 0.2% |
| Ward Nine | 2,248 | 1,708 | 35.1% | 4.0% | 53.3% | 0.0% | $37k | 14.1% | 13.8% | 15.9% | 46.9% | 18.0% | 1.7% |
| Ward One | 1,638 | 1,418 | 25.4% | 3.5% | 64.1% | 1.9% | $43k | 15.5% | 23.4% | 27.1% | 25.9% | 26.6% | 1.3% |
| Ward Seven | 3,363 | 2,263 | 17.0% | 4.8% | 73.1% | 0.1% | $36k | 13.0% | 29.3% | 13.6% | 31.9% | 29.7% | 4.1% |
| Ward Seventeen | 2,152 | 1,894 | 72.8% | 1.5% | 22.5% | 1.5% | $86k | 28.9% | 9.5% | 34.2% | 75.7% | 10.4% | 1.4% |
| Ward Six | 1,787 | 1,284 | 21.0% | 0.1% | 77.1% | 0.4% | $20k | 10.0% | 11.8% | 32.2% | 52.9% | 51.8% | 0.4% |
| Ward Sixteen | 3,480 | 2,575 | 47.9% | 12.3% | 32.6% | 0.2% | $54k | 24.5% | 19.2% | 22.3% | 55.4% | 28.8% | 4.8% |
| Ward Ten | 1,860 | 1,556 | 41.7% | 7.2% | 43.8% | 3.7% | $31k | 12.1% | 12.4% | 38.5% | 38.7% | 23.2% | 7.1% |
| Ward Thirteen | 2,971 | 2,231 | 38.7% | 5.8% | 52.7% | 1.4% | $60k | 24.8% | 17.2% | 17.5% | 56.1% | 24.3% | 0.9% |
| Ward Three | 2,977 | 2,439 | 47.7% | 2.8% | 46.0% | 0.3% | $57k | 37.1% | 31.1% | 13.9% | 54.3% | 23.2% | 2.1% |
| Ward Twelve | 3,448 | 3,014 | 34.6% | 2.6% | 58.5% | 0.8% | $62k | 14.5% | 23.2% | 22.5% | 52.5% | 12.9% | 1.7% |
| Ward Two | 1,328 | 967 | 51.0% | 3.7% | 41.0% | 0.8% | $49k | 29.2% | 10.6% | 20.7% | 41.7% | 20.3% | 2.1% |
Louisa County: 14 precincts
| Precinct | Population | Voting-age pop. | % White non-Hisp. | % Hispanic | % Black | % Asian | Median income* | % Bachelor's+ | % 18-29 (of adults) | % 65+ | % Homeowners | % Below poverty | % Spanish at home (adults) |
|---|---|---|---|---|---|---|---|---|---|---|---|---|---|
| Bumpass | 5,591 | 4,391 | 82.0% | 3.1% | 3.9% | 0.5% | $102k | 25.7% | 17.9% | 16.6% | 87.1% | 13.6% | 1.2% |
| Cuckoo | 1,867 | 1,498 | 74.3% | 1.6% | 11.8% | 0.0% | $67k | 26.1% | 21.0% | 11.3% | 73.3% | 16.9% | 0.0% |
| Cuckoo | 2,080 | 1,674 | 86.8% | 2.7% | 2.1% | 2.5% | $103k | 34.2% | 8.3% | 27.0% | 96.1% | 7.2% | 0.9% |
| Fredericks Hall | 1,870 | 1,476 | 77.5% | 1.9% | 14.4% | 1.0% | $86k | 20.7% | 10.0% | 22.7% | 91.0% | 10.5% | 1.7% |
| Louisa #1 | 1,084 | 947 | 78.3% | 2.7% | 11.0% | 0.7% | $68k | 33.3% | 12.2% | 31.8% | 65.4% | 10.6% | 0.6% |
| Louisa #2 | 2,318 | 1,885 | 71.1% | 8.1% | 9.2% | 0.1% | $87k | 24.1% | 15.4% | 18.8% | 90.8% | 5.5% | 6.3% |
| Louisa #3 | 496 | 372 | 51.1% | 18.4% | 15.6% | 0.0% | $78k | 16.4% | 18.2% | 13.4% | 96.1% | 0.3% | 13.1% |
| Mechanicsville | 1,982 | 1,585 | 75.9% | 12.0% | 10.8% | 0.0% | $125k | 23.3% | 11.6% | 13.1% | 92.2% | 9.2% | 9.4% |
| Mineral | 7,013 | 5,622 | 75.3% | 5.5% | 11.6% | 0.5% | $87k | 24.6% | 12.0% | 24.5% | 85.0% | 7.4% | 3.6% |
| Patrick Henry #1 | 3,281 | 2,757 | 68.3% | 3.5% | 21.1% | 1.3% | $77k | 36.6% | 15.8% | 26.3% | 82.7% | 14.0% | 0.7% |
| Patrick Henry #2 | 3,028 | 2,231 | 58.1% | 2.2% | 26.8% | 0.4% | $75k | 23.1% | 21.1% | 15.2% | 62.3% | 11.8% | 1.2% |
| Sheltons Mill | 2,272 | 1,825 | 82.9% | 1.7% | 9.7% | 0.0% | $78k | 30.9% | 8.8% | 22.6% | 75.5% | 12.9% | 1.4% |
| South Anna | 3,461 | 2,818 | 81.5% | 2.6% | 8.7% | 0.4% | $70k | 31.3% | 14.5% | 20.1% | 72.7% | 11.5% | 1.1% |
| Zion | 3,633 | 2,903 | 81.2% | 3.3% | 10.8% | 0.8% | $124k | 51.9% | 15.5% | 25.2% | 84.7% | 3.7% | 3.9% |
Halifax County: 20 precincts
| Precinct | Population | Voting-age pop. | % White non-Hisp. | % Hispanic | % Black | % Asian | Median income* | % Bachelor's+ | % 18-29 (of adults) | % 65+ | % Homeowners | % Below poverty | % Spanish at home (adults) |
|---|---|---|---|---|---|---|---|---|---|---|---|---|---|
| Black Walnut | 1,512 | 1,242 | 79.6% | 3.5% | 13.5% | 0.0% | $61k | 15.2% | 15.8% | 24.1% | 74.5% | 17.4% | 1.6% |
| Center | 2,671 | 1,969 | 49.1% | 4.3% | 45.5% | 0.5% | $50k | 21.9% | 15.1% | 25.5% | 61.7% | 18.2% | 4.1% |
| Childrey | 1,367 | 1,074 | 52.2% | 0.2% | 39.1% | 0.0% | $50k | 9.8% | 10.7% | 23.0% | 88.5% | 12.2% | 0.2% |
| Clays Mill | 849 | 759 | 70.4% | 2.3% | 27.0% | 0.0% | $60k | 10.7% | 8.4% | 36.4% | 78.9% | 7.8% | 2.9% |
| Clover | 1,673 | 1,294 | 56.0% | 0.0% | 42.0% | 0.0% | $47k | 17.0% | 5.2% | 25.1% | 86.4% | 18.8% | 0.0% |
| Courthouse | 2,187 | 1,837 | 56.0% | 1.8% | 37.2% | 0.9% | $48k | 24.7% | 20.5% | 25.2% | 76.9% | 12.0% | 0.7% |
| Crossroads | 1,210 | 938 | 75.9% | 0.2% | 19.8% | 0.0% | $45k | 11.2% | 8.5% | 27.1% | 84.3% | 20.3% | 0.0% |
| Dan River | 3,209 | 2,246 | 52.4% | 6.7% | 37.3% | 2.2% | $57k | 29.0% | 23.9% | 18.2% | 70.6% | 21.0% | 2.8% |
| Hyco | 1,279 | 914 | 70.4% | 7.5% | 19.0% | 0.1% | $49k | 19.9% | 17.5% | 24.3% | 81.3% | 25.7% | 0.9% |
| Liberty | 833 | 691 | 76.2% | 1.3% | 22.2% | 0.0% | $54k | 14.9% | 17.3% | 27.4% | 88.9% | 14.0% | 0.9% |
| Meadville | 609 | 574 | 22.5% | 6.6% | 61.0% | 0.0% | $40k | 10.3% | 6.1% | 36.2% | 91.8% | 15.5% | 13.5% |
| Midway | 1,450 | 1,190 | 85.1% | 0.0% | 11.2% | 0.7% | $66k | 22.7% | 22.0% | 26.6% | 84.2% | 9.4% | 0.0% |
| Mt. Carmel | 2,503 | 2,130 | 73.0% | 1.2% | 23.9% | 0.1% | $53k | 24.4% | 20.0% | 25.6% | 74.6% | 18.1% | 0.6% |
| Republican Grove | 1,647 | 1,413 | 51.2% | 0.7% | 42.3% | 0.0% | $49k | 17.6% | 13.9% | 31.6% | 86.0% | 11.9% | 0.5% |
| Scottsburg | 1,368 | 1,158 | 67.3% | 0.6% | 27.4% | 0.0% | $80k | 27.4% | 15.2% | 36.2% | 81.2% | 3.0% | 0.4% |
| Sinai | 2,299 | 1,803 | 39.6% | 0.7% | 57.3% | 0.2% | $46k | 14.2% | 21.2% | 18.0% | 70.8% | 23.7% | 0.9% |
| South Boston | 3,280 | 2,659 | 46.4% | 3.8% | 45.5% | 2.0% | $40k | 16.2% | 16.1% | 29.6% | 47.7% | 23.6% | 3.1% |
| Union | 1,361 | 1,045 | 55.0% | 0.9% | 40.0% | 0.5% | $48k | 22.1% | 12.4% | 27.6% | 60.6% | 29.1% | 0.9% |
| Vernon Hill | 1,226 | 1,025 | 68.2% | 3.3% | 23.5% | 1.2% | $67k | 29.2% | 9.2% | 26.7% | 78.1% | 9.8% | 5.4% |
| Virgilina | 1,082 | 811 | 80.4% | 4.4% | 13.5% | 0.1% | $61k | 16.8% | 21.5% | 17.1% | 84.2% | 18.9% | 1.7% |
Amherst County: 12 precincts
| Precinct | Population | Voting-age pop. | % White non-Hisp. | % Hispanic | % Black | % Asian | Median income* | % Bachelor's+ | % 18-29 (of adults) | % 65+ | % Homeowners | % Below poverty | % Spanish at home (adults) |
|---|---|---|---|---|---|---|---|---|---|---|---|---|---|
| Amelon | 4,068 | 3,264 | 67.4% | 1.8% | 23.0% | 0.1% | $62k | 18.5% | 18.8% | 20.7% | 72.0% | 6.0% | 0.0% |
| COURT HOUSE | 3,173 | 2,573 | 84.9% | 1.9% | 9.3% | 0.4% | $78k | 32.1% | 22.7% | 22.5% | 76.8% | 9.3% | 1.7% |
| Coolwell | 1,034 | 847 | 73.0% | 9.4% | 13.6% | 0.0% | $64k | 19.5% | 16.7% | 15.3% | 92.5% | 18.5% | 8.1% |
| Elon | 3,111 | 2,431 | 85.7% | 2.2% | 7.6% | 1.2% | $74k | 30.0% | 9.8% | 27.6% | 94.3% | 6.6% | 1.0% |
| Lonco | 2,084 | 1,651 | 62.5% | 5.8% | 25.8% | 0.2% | $51k | 23.7% | 16.5% | 16.9% | 87.0% | 14.9% | 4.8% |
| Madison | 5,728 | 4,615 | 65.5% | 3.3% | 25.4% | 0.6% | $64k | 20.0% | 17.3% | 20.4% | 71.4% | 13.8% | 0.2% |
| Monroe | 1,544 | 1,243 | 79.9% | 1.2% | 9.3% | 7.0% | $83k | 33.7% | 17.1% | 28.0% | 91.6% | 6.0% | 0.9% |
| New Glasgow | 3,762 | 2,732 | 74.4% | 4.4% | 10.6% | 0.0% | $86k | 26.5% | 21.2% | 16.6% | 93.1% | 13.4% | 0.9% |
| Pleasant View | 1,334 | 1,081 | 84.0% | 1.6% | 8.8% | 0.0% | $85k | 39.0% | 13.2% | 23.0% | 86.3% | 9.3% | 1.2% |
| TOWN OF AMHERST | 1,461 | 1,253 | 78.7% | 2.9% | 14.4% | 1.0% | $61k | 31.4% | 28.7% | 26.0% | 65.9% | 10.1% | 1.4% |
| Temperance | 1,710 | 1,270 | 80.5% | 0.3% | 10.3% | 0.0% | $72k | 32.4% | 8.1% | 25.2% | 77.7% | 11.4% | 0.0% |
| Wright Shop | 2,639 | 2,342 | 65.3% | 2.2% | 28.1% | 0.1% | $66k | 10.9% | 16.1% | 22.5% | 82.2% | 12.5% | 1.8% |
Powhatan County: 12 precincts
| Precinct | Population | Voting-age pop. | % White non-Hisp. | % Hispanic | % Black | % Asian | Median income* | % Bachelor's+ | % 18-29 (of adults) | % 65+ | % Homeowners | % Below poverty | % Spanish at home (adults) |
|---|---|---|---|---|---|---|---|---|---|---|---|---|---|
| Bethesda | 3,378 | 2,904 | 85.6% | 1.3% | 10.0% | 0.0% | $109k | 37.6% | 9.1% | 26.7% | 92.5% | 6.8% | 2.3% |
| Flat Rock | 1,179 | 936 | 74.7% | 7.3% | 0.8% | 2.5% | $92k | 41.2% | 21.8% | 13.9% | 97.5% | 3.7% | 0.3% |
| Graceland | 3,158 | 2,461 | 90.5% | 0.1% | 3.0% | 0.1% | $115k | 26.9% | 16.3% | 14.7% | 98.7% | 5.3% | 0.4% |
| Lee's Landing | 2,480 | 1,996 | 89.8% | 2.6% | 4.6% | 0.1% | $127k | 42.8% | 16.1% | 21.0% | 95.8% | 2.0% | 0.8% |
| Manakin | 2,463 | 2,236 | 98.4% | 0.8% | 0.2% | 0.1% | $116k | 50.4% | 9.0% | 37.4% | 95.8% | 4.3% | 0.3% |
| Mt Zion | 2,115 | 1,625 | 91.7% | 0.1% | 7.1% | 0.0% | $85k | 41.4% | 4.6% | 15.9% | 92.1% | 5.9% | 3.5% |
| Pineville | 3,462 | 2,983 | 66.1% | 4.0% | 22.7% | 0.2% | $92k | 23.6% | 21.5% | 17.1% | 98.5% | 5.8% | 3.0% |
| Powhatan Courthouse | 4,871 | 3,869 | 85.3% | 4.9% | 7.3% | 0.1% | $113k | 36.9% | 19.0% | 16.2% | 84.8% | 4.8% | 3.5% |
| Powhatan Station | 1,846 | 1,420 | 90.4% | 2.2% | 1.6% | 1.6% | $82k | 18.6% | 17.4% | 15.6% | 94.1% | 5.5% | 0.2% |
| Smiths Crossroads | 2,296 | 2,000 | 71.6% | 1.0% | 14.4% | 0.0% | $86k | 19.6% | 8.6% | 19.8% | 89.9% | 6.0% | 1.0% |
| Subletts | 2,864 | 2,349 | 88.6% | 2.4% | 0.9% | 0.3% | $119k | 48.0% | 13.1% | 24.9% | 97.0% | 1.6% | 1.2% |
| Tobaccoville | 1,393 | 964 | 84.7% | 13.5% | 1.8% | 0.0% | $100k | 23.7% | 21.6% | 7.6% | 84.8% | 0.1% | 19.5% |
Mecklenburg County: 22 precincts
| Precinct | Population | Voting-age pop. | % White non-Hisp. | % Hispanic | % Black | % Asian | Median income* | % Bachelor's+ | % 18-29 (of adults) | % 65+ | % Homeowners | % Below poverty | % Spanish at home (adults) |
|---|---|---|---|---|---|---|---|---|---|---|---|---|---|
| Antioch Church | 515 | 473 | 72.2% | 0.0% | 27.2% | 0.0% | $101k | 24.1% | 14.9% | 33.8% | 87.7% | 8.4% | 0.0% |
| Baskerville | 659 | 523 | 50.3% | 5.3% | 41.7% | 0.0% | $52k | 7.7% | 17.5% | 21.1% | 67.5% | 24.8% | 4.2% |
| Bluestone | 962 | 799 | 63.7% | 2.0% | 28.2% | 0.0% | $60k | 19.9% | 16.9% | 30.5% | 78.8% | 14.8% | 2.5% |
| Bracey | 1,804 | 1,377 | 85.4% | 2.7% | 10.2% | 0.0% | $68k | 22.6% | 9.1% | 31.1% | 81.0% | 17.0% | 3.0% |
| Buffalo Junction | 824 | 720 | 70.8% | 0.5% | 25.9% | 0.3% | $62k | 22.0% | 21.4% | 22.4% | 70.3% | 8.9% | 0.3% |
| Chase City | 668 | 570 | 51.6% | 1.0% | 44.4% | 0.0% | $43k | 9.2% | 22.9% | 29.8% | 64.1% | 12.6% | 0.7% |
| Chase City East | 2,272 | 1,711 | 65.7% | 0.0% | 34.1% | 0.0% | $45k | 18.6% | 10.1% | 20.7% | 68.3% | 16.5% | 1.1% |
| Chase City West | 2,176 | 1,859 | 37.8% | 3.3% | 56.7% | 0.0% | $46k | 11.2% | 20.5% | 25.9% | 63.0% | 10.5% | 0.7% |
| Clarksville North | 1,734 | 1,396 | 69.7% | 3.0% | 22.8% | 0.8% | $67k | 28.5% | 8.8% | 35.6% | 69.7% | 12.5% | 1.7% |
| Clarksville South | 1,598 | 1,260 | 66.4% | 2.1% | 28.0% | 0.8% | $63k | 29.4% | 10.8% | 29.9% | 73.3% | 12.6% | 0.5% |
| Finchley | 829 | 701 | 58.8% | 0.0% | 40.2% | 0.2% | $73k | 25.1% | 10.4% | 32.1% | 77.2% | 14.2% | 0.9% |
| LaCrosse | 1,165 | 909 | 42.3% | 10.8% | 43.9% | 0.0% | $61k | 8.3% | 16.9% | 21.9% | 51.3% | 20.4% | 4.4% |
| Lake Gaston | 936 | 856 | 85.9% | 0.6% | 9.0% | 0.0% | $68k | 26.9% | 11.5% | 38.1% | 84.9% | 3.8% | 0.0% |
| Midway | 837 | 742 | 65.6% | 0.2% | 32.0% | 0.0% | $54k | 18.4% | 12.1% | 30.7% | 81.1% | 19.2% | 0.2% |
| Nelson | 733 | 565 | 63.6% | 1.8% | 31.3% | 1.6% | $57k | 26.2% | 6.9% | 28.4% | 76.2% | 11.8% | 0.2% |
| Palmer Springs | 1,044 | 885 | 69.1% | 0.8% | 27.7% | 0.0% | $85k | 20.2% | 16.0% | 27.9% | 84.1% | 10.1% | 0.9% |
| Skipwith | 1,170 | 974 | 76.3% | 2.0% | 20.0% | 0.0% | $55k | 28.0% | 9.7% | 35.7% | 76.7% | 17.6% | 2.3% |
| Smith Crossroads | 1,614 | 1,098 | 52.3% | 8.1% | 34.4% | 0.0% | $58k | 18.2% | 18.7% | 18.7% | 70.3% | 13.7% | 6.5% |
| South Hill East | 3,170 | 2,647 | 63.8% | 0.8% | 26.0% | 2.9% | $50k | 21.9% | 17.7% | 28.3% | 52.1% | 24.9% | 0.4% |
| South Hill West | 3,262 | 2,686 | 43.9% | 8.0% | 39.6% | 3.3% | $66k | 25.2% | 18.9% | 21.5% | 58.5% | 16.9% | 6.8% |
| Union Level | 835 | 675 | 41.5% | 6.9% | 48.0% | 1.3% | $52k | 8.4% | 17.3% | 21.6% | 62.0% | 28.9% | 5.0% |
| Williams Grove | 1,674 | 1,455 | 56.5% | 2.8% | 37.4% | 2.4% | $47k | 18.0% | 11.8% | 23.6% | 69.8% | 26.4% | 2.2% |
Bedford County: 11 precincts
| Precinct | Population | Voting-age pop. | % White non-Hisp. | % Hispanic | % Black | % Asian | Median income* | % Bachelor's+ | % 18-29 (of adults) | % 65+ | % Homeowners | % Below poverty | % Spanish at home (adults) |
|---|---|---|---|---|---|---|---|---|---|---|---|---|---|
| Boonsboro Elementary School | 2,741 | 1,994 | 83.3% | 0.4% | 8.8% | 1.4% | $87k | 59.8% | 11.0% | 28.9% | 79.8% | 3.0% | 4.5% |
| Boonsboro Ruritan Club | 6,555 | 4,937 | 90.1% | 2.6% | 3.0% | 1.0% | $122k | 57.7% | 17.2% | 15.4% | 92.6% | 9.3% | 1.5% |
| Forest Alliance Church | 1,580 | 1,261 | 74.0% | 2.1% | 12.7% | 1.5% | $104k | 50.3% | 13.6% | 22.0% | 92.1% | 1.3% | 1.4% |
| Forest Elementary School | 4,126 | 3,155 | 81.3% | 4.5% | 5.0% | 2.9% | $92k | 56.0% | 19.0% | 20.6% | 79.4% | 5.3% | 2.6% |
| Forest Fire Station #2 | 1,944 | 1,524 | 75.3% | 7.0% | 4.9% | 3.2% | $95k | 51.3% | 11.1% | 15.2% | 89.7% | 2.8% | 2.5% |
| Forest Recreation Center | 1,528 | 1,209 | 70.4% | 3.3% | 17.7% | 1.0% | $70k | 31.5% | 23.2% | 16.6% | 54.8% | 13.2% | 3.5% |
| Freedom Baptist Church | 1,181 | 1,002 | 89.5% | 0.3% | 4.7% | 1.0% | $65k | 32.8% | 18.5% | 25.2% | 92.7% | 7.7% | 3.5% |
| Mountain View Church | 448 | 381 | 82.7% | 1.2% | 5.3% | 3.0% | $101k | 35.8% | 15.1% | 26.8% | 92.3% | 5.7% | 1.9% |
| New London Academy | 2,894 | 2,163 | 90.7% | 4.0% | 3.2% | 0.5% | $109k | 40.8% | 21.4% | 15.3% | 89.8% | 5.6% | 0.4% |
| Pleasant View Baptist Church | 3,437 | 2,778 | 77.5% | 2.4% | 11.3% | 1.3% | $77k | 45.5% | 32.8% | 19.1% | 67.8% | 18.4% | 2.4% |
| Thomas Jefferson Elementary School | 2,565 | 2,061 | 67.1% | 1.8% | 23.3% | 1.5% | $88k | 45.8% | 15.8% | 23.9% | 90.8% | 2.7% | 0.8% |
Fluvanna County: 5 precincts
| Precinct | Population | Voting-age pop. | % White non-Hisp. | % Hispanic | % Black | % Asian | Median income* | % Bachelor's+ | % 18-29 (of adults) | % 65+ | % Homeowners | % Below poverty | % Spanish at home (adults) |
|---|---|---|---|---|---|---|---|---|---|---|---|---|---|
| Columbia | 4,428 | 3,672 | 75.1% | 4.3% | 18.6% | 0.5% | $69k | 30.5% | 13.3% | 20.6% | 87.8% | 13.2% | 1.2% |
| Cunningham | 5,074 | 4,003 | 80.9% | 4.1% | 6.5% | 0.1% | $90k | 34.8% | 16.2% | 26.2% | 89.8% | 9.1% | 2.0% |
| Fork Union | 7,749 | 6,150 | 73.0% | 2.3% | 15.8% | 1.6% | $94k | 33.2% | 18.6% | 20.9% | 81.7% | 5.7% | 1.8% |
| Palmyra | 6,646 | 5,395 | 70.7% | 7.7% | 8.9% | 1.3% | $106k | 37.9% | 18.6% | 15.0% | 91.5% | 7.4% | 6.0% |
| Rivanna | 4,196 | 3,419 | 78.2% | 4.7% | 8.2% | 0.3% | $111k | 53.2% | 12.8% | 30.1% | 96.6% | 4.1% | 2.0% |
Goochland County: 11 precincts
| Precinct | Population | Voting-age pop. | % White non-Hisp. | % Hispanic | % Black | % Asian | Median income* | % Bachelor's+ | % 18-29 (of adults) | % 65+ | % Homeowners | % Below poverty | % Spanish at home (adults) |
|---|---|---|---|---|---|---|---|---|---|---|---|---|---|
| Beaverdam | 3,411 | 2,841 | 70.9% | 7.2% | 15.5% | 0.5% | $138k | 40.6% | 9.5% | 17.8% | 90.3% | 10.0% | 5.0% |
| Blair | 3,361 | 3,006 | 88.6% | 1.2% | 3.9% | 5.9% | $166k | 72.3% | 11.4% | 40.3% | 84.4% | 3.2% | 0.1% |
| Centerville | 2,879 | 2,535 | 80.5% | 5.8% | 8.5% | 2.4% | $144k | 49.1% | 10.7% | 31.5% | 80.1% | 4.0% | 1.3% |
| Fife | 2,482 | 2,075 | 79.5% | 1.8% | 15.2% | 0.0% | $82k | 22.3% | 19.9% | 21.8% | 88.9% | 6.3% | 0.6% |
| Hadensville | 2,598 | 2,085 | 74.0% | 3.2% | 19.5% | 0.0% | $94k | 22.0% | 18.5% | 14.8% | 88.9% | 6.0% | 0.1% |
| Manakin | 3,000 | 2,624 | 82.5% | 2.4% | 7.9% | 5.7% | $139k | 62.4% | 13.2% | 32.7% | 79.4% | 3.1% | 0.5% |
| Randolph | 2,104 | 1,787 | 77.4% | 2.5% | 15.7% | 0.1% | $124k | 44.5% | 10.9% | 20.4% | 96.0% | 4.7% | 1.2% |
| Sandy Hook | 2,590 | 1,956 | 73.8% | 5.5% | 15.9% | 0.5% | $114k | 43.6% | 16.0% | 18.1% | 83.9% | 5.7% | 0.6% |
| Shallow Well | 1,126 | 963 | 81.7% | 2.8% | 11.9% | 1.1% | $126k | 48.6% | 10.1% | 30.3% | 84.9% | 2.8% | 0.5% |
| Three Square | 2,307 | 1,769 | 65.3% | 3.6% | 28.4% | 0.2% | $88k | 36.2% | 15.1% | 19.6% | 78.3% | 4.9% | 3.3% |
| West Creek | 737 | 642 | 78.1% | 6.0% | 8.4% | 4.3% | $144k | 53.8% | 11.1% | 30.2% | 79.5% | 4.0% | 1.5% |
Prince Edward County: 10 precincts
| Precinct | Population | Voting-age pop. | % White non-Hisp. | % Hispanic | % Black | % Asian | Median income* | % Bachelor's+ | % 18-29 (of adults) | % 65+ | % Homeowners | % Below poverty | % Spanish at home (adults) |
|---|---|---|---|---|---|---|---|---|---|---|---|---|---|
| BUFFALO HTS | 1,747 | 1,532 | 56.1% | 4.7% | 37.0% | 0.2% | $43k | 15.3% | 33.8% | 17.7% | 41.6% | 26.7% | 5.0% |
| CENTER | 1,976 | 1,867 | 67.3% | 3.0% | 25.4% | 1.4% | $35k | 23.9% | 77.8% | 7.0% | 30.4% | 24.4% | 0.7% |
| DARLINGTON HTS | 2,750 | 2,425 | 71.0% | 7.4% | 17.2% | 2.5% | $57k | 32.2% | 58.5% | 15.3% | 66.2% | 17.1% | 2.5% |
| FARMVILLE | 2,385 | 2,126 | 54.7% | 3.2% | 29.2% | 1.1% | $42k | 28.5% | 39.4% | 19.0% | 41.4% | 17.7% | 1.8% |
| HAMPDEN | 1,774 | 1,507 | 55.4% | 7.4% | 33.1% | 1.7% | $70k | 27.8% | 39.0% | 15.3% | 61.4% | 22.8% | 4.1% |
| LEIGH | 1,334 | 1,063 | 56.3% | 3.9% | 38.1% | 0.4% | $54k | 19.2% | 9.1% | 22.2% | 70.6% | 16.5% | 4.1% |
| LOCKETT | 3,455 | 2,849 | 62.4% | 7.9% | 24.5% | 0.2% | $59k | 27.0% | 21.4% | 19.3% | 54.9% | 15.0% | 4.3% |
| MT PLEASANT | 1,080 | 878 | 42.1% | 0.2% | 55.7% | 1.4% | $59k | 17.8% | 18.7% | 18.1% | 63.5% | 30.5% | 1.4% |
| PROSPECT | 3,247 | 2,436 | 51.2% | 3.8% | 36.3% | 0.0% | $53k | 19.1% | 25.2% | 15.4% | 72.6% | 24.9% | 0.8% |
| WEST END | 2,171 | 1,891 | 72.6% | 3.1% | 19.4% | 2.7% | $67k | 56.7% | 32.7% | 23.6% | 63.4% | 23.4% | 7.5% |
Hanover County: 6 precincts
| Precinct | Population | Voting-age pop. | % White non-Hisp. | % Hispanic | % Black | % Asian | Median income* | % Bachelor's+ | % 18-29 (of adults) | % 65+ | % Homeowners | % Below poverty | % Spanish at home (adults) |
|---|---|---|---|---|---|---|---|---|---|---|---|---|---|
| Beaverdam | 4,110 | 3,076 | 85.2% | 4.2% | 5.7% | 0.6% | $100k | 45.0% | 9.3% | 22.3% | 84.9% | 2.7% | 0.6% |
| Blunts | 1,252 | 1,083 | 75.0% | 11.1% | 8.9% | 1.2% | $89k | 46.2% | 8.4% | 36.2% | 92.1% | 0.4% | 0.0% |
| Montpelier | 3,598 | 2,962 | 76.4% | 7.7% | 11.7% | 1.0% | $116k | 33.6% | 11.9% | 15.5% | 84.4% | 5.8% | 4.7% |
| Rockville | 3,063 | 2,418 | 80.4% | 1.9% | 3.6% | 4.2% | $115k | 47.3% | 7.0% | 23.0% | 95.2% | 1.5% | 0.7% |
| South Anna | 1,660 | 1,313 | 73.9% | 8.6% | 15.4% | 0.4% | $126k | 37.8% | 16.4% | 19.7% | 86.9% | 8.9% | 4.7% |
| Wilmington Parish | 4,066 | 3,241 | 81.6% | 5.3% | 7.9% | 1.3% | $122k | 46.9% | 20.4% | 20.7% | 80.2% | 11.7% | 0.2% |
Buckingham County: 10 precincts
| Precinct | Population | Voting-age pop. | % White non-Hisp. | % Hispanic | % Black | % Asian | Median income* | % Bachelor's+ | % 18-29 (of adults) | % 65+ | % Homeowners | % Below poverty | % Spanish at home (adults) |
|---|---|---|---|---|---|---|---|---|---|---|---|---|---|
| Curdsville | 975 | 756 | 66.4% | 1.0% | 29.8% | 0.3% | $59k | 16.2% | 19.8% | 23.8% | 77.3% | 13.7% | 1.3% |
| Georgia Creek | 1,113 | 872 | 70.3% | 7.3% | 18.2% | 1.3% | $58k | 16.0% | 12.6% | 24.4% | 78.3% | 19.6% | 2.1% |
| Glenmore | 1,376 | 1,102 | 75.0% | 5.1% | 16.1% | 0.8% | $52k | 21.2% | 12.1% | 29.9% | 76.9% | 18.2% | 1.2% |
| Gold Hill | 4,005 | 3,593 | 49.1% | 3.9% | 40.8% | 0.2% | $76k | 9.4% | 13.8% | 12.1% | 78.8% | 10.0% | 3.0% |
| Maysville | 1,737 | 1,419 | 77.9% | 3.4% | 12.9% | 0.1% | $61k | 22.8% | 12.8% | 28.0% | 64.6% | 10.7% | 0.3% |
| New Canton | 2,405 | 1,947 | 41.8% | 1.7% | 47.7% | 0.0% | $59k | 8.5% | 19.8% | 24.7% | 66.6% | 16.3% | 1.6% |
| New Store | 1,263 | 987 | 65.7% | 1.5% | 28.9% | 0.5% | $66k | 18.0% | 20.0% | 20.5% | 81.0% | 4.9% | 0.0% |
| Slate River | 1,226 | 1,024 | 63.2% | 0.0% | 21.1% | 1.5% | $97k | 21.9% | 18.3% | 18.7% | 98.7% | 3.3% | 0.0% |
| White Hall | 1,857 | 1,469 | 66.6% | 0.5% | 31.0% | 0.0% | $62k | 15.1% | 16.4% | 21.6% | 81.5% | 12.9% | 1.8% |
| Wrights | 1,029 | 796 | 69.6% | 0.0% | 26.5% | 0.0% | $64k | 10.0% | 10.9% | 16.7% | 85.1% | 14.1% | 0.7% |
Appomattox County: 8 precincts
| Precinct | Population | Voting-age pop. | % White non-Hisp. | % Hispanic | % Black | % Asian | Median income* | % Bachelor's+ | % 18-29 (of adults) | % 65+ | % Homeowners | % Below poverty | % Spanish at home (adults) |
|---|---|---|---|---|---|---|---|---|---|---|---|---|---|
| Chap | 828 | 584 | 87.0% | 0.7% | 11.7% | 0.6% | $45k | 14.6% | 8.3% | 23.1% | 76.3% | 15.3% | 0.0% |
| Courthouse | 2,579 | 2,005 | 81.1% | 0.6% | 16.5% | 0.5% | $60k | 25.3% | 20.9% | 16.9% | 68.1% | 9.3% | 0.6% |
| Oakville | 4,395 | 3,573 | 70.7% | 3.3% | 19.6% | 0.1% | $64k | 13.4% | 20.4% | 23.0% | 70.1% | 12.9% | 0.3% |
| Pamplin | 2,285 | 1,655 | 75.3% | 2.1% | 12.3% | 0.1% | $57k | 17.4% | 8.1% | 18.9% | 79.2% | 19.8% | 2.2% |
| Spout Spring | 2,714 | 2,070 | 84.2% | 5.1% | 5.6% | 1.2% | $83k | 32.7% | 17.5% | 20.3% | 89.7% | 14.5% | 0.0% |
| Stonewall | 1,293 | 1,017 | 84.1% | 0.0% | 11.4% | 0.6% | $60k | 17.1% | 7.1% | 27.0% | 83.4% | 14.3% | 0.0% |
| US 460 | 1,216 | 1,033 | 78.5% | 2.2% | 15.5% | 0.2% | $69k | 16.4% | 19.9% | 26.2% | 79.7% | 7.8% | 0.0% |
| Vera | 1,289 | 1,005 | 54.7% | 1.5% | 37.6% | 0.0% | $52k | 12.6% | 14.7% | 17.0% | 65.8% | 20.3% | 1.2% |
Nottoway County: 7 precincts
| Precinct | Population | Voting-age pop. | % White non-Hisp. | % Hispanic | % Black | % Asian | Median income* | % Bachelor's+ | % 18-29 (of adults) | % 65+ | % Homeowners | % Below poverty | % Spanish at home (adults) |
|---|---|---|---|---|---|---|---|---|---|---|---|---|---|
| PRECINCT 1-1 | 2,135 | 1,772 | 74.1% | 5.8% | 18.4% | 0.5% | $86k | 17.2% | 19.3% | 23.4% | 76.7% | 13.6% | 2.1% |
| PRECINCT 2-1 | 2,208 | 1,608 | 76.2% | 2.9% | 15.0% | 1.4% | $54k | 9.7% | 12.4% | 24.3% | 79.7% | 11.7% | 0.3% |
| PRECINCT 3-1 | 4,381 | 3,787 | 50.7% | 1.6% | 42.8% | 1.5% | $73k | 13.3% | 18.9% | 10.7% | 56.8% | 27.5% | 0.4% |
| PRECINCT 3-2 | 1,174 | 1,005 | 50.4% | 1.6% | 42.3% | 0.6% | $89k | 17.4% | 23.8% | 9.3% | 65.6% | 14.9% | 1.0% |
| PRECINCT 4-1 | 1,945 | 1,356 | 19.8% | 5.7% | 68.5% | 0.0% | $63k | 11.0% | 34.6% | 7.1% | 43.2% | 26.5% | 5.8% |
| PRECINCT 4-2 | 730 | 613 | 65.4% | 2.2% | 31.4% | 0.0% | $69k | 9.4% | 9.7% | 40.9% | 89.8% | 12.7% | 0.0% |
| PRECINCT 5-1 | 3,006 | 2,435 | 49.5% | 11.8% | 32.8% | 0.3% | $60k | 17.5% | 13.7% | 29.2% | 64.3% | 14.4% | 8.6% |
Nelson County: 9 precincts
| Precinct | Population | Voting-age pop. | % White non-Hisp. | % Hispanic | % Black | % Asian | Median income* | % Bachelor's+ | % 18-29 (of adults) | % 65+ | % Homeowners | % Below poverty | % Spanish at home (adults) |
|---|---|---|---|---|---|---|---|---|---|---|---|---|---|
| Faber | 1,155 | 984 | 75.8% | 9.3% | 9.9% | 0.2% | $80k | 42.7% | 15.5% | 26.9% | 80.4% | 14.2% | 5.9% |
| Gladstone | 728 | 564 | 76.4% | 0.0% | 17.8% | 5.7% | $59k | 29.5% | 13.5% | 26.7% | 92.1% | 15.7% | 0.0% |
| Lovingston | 1,812 | 1,523 | 70.1% | 11.5% | 14.0% | 0.1% | $69k | 30.3% | 21.4% | 22.2% | 79.6% | 10.0% | 6.3% |
| Montebello | 291 | 272 | 80.4% | 3.0% | 12.0% | 0.0% | $34k | 28.9% | 3.4% | 59.4% | 69.0% | 33.0% | 1.7% |
| Nellysford | 2,162 | 1,753 | 87.8% | 0.6% | 8.4% | 0.9% | $115k | 59.3% | 6.7% | 31.2% | 72.3% | 8.0% | 0.4% |
| Rockfish | 2,741 | 2,377 | 93.4% | 2.3% | 1.7% | 0.3% | $95k | 43.6% | 9.2% | 41.2% | 82.6% | 11.6% | 1.5% |
| Roseland | 2,554 | 2,065 | 73.0% | 4.9% | 13.5% | 0.1% | $65k | 26.3% | 8.9% | 29.1% | 79.3% | 14.5% | 1.8% |
| Schuyler | 970 | 817 | 86.5% | 4.3% | 6.4% | 0.0% | $68k | 27.5% | 24.8% | 20.0% | 80.6% | 11.6% | 2.8% |
| Shipman | 2,334 | 1,820 | 71.3% | 5.9% | 19.7% | 2.5% | $69k | 23.4% | 17.6% | 23.0% | 81.7% | 13.3% | 0.2% |
Amelia County: 5 precincts
| Precinct | Population | Voting-age pop. | % White non-Hisp. | % Hispanic | % Black | % Asian | Median income* | % Bachelor's+ | % 18-29 (of adults) | % 65+ | % Homeowners | % Below poverty | % Spanish at home (adults) |
|---|---|---|---|---|---|---|---|---|---|---|---|---|---|
| Number Five | 3,346 | 2,898 | 59.5% | 3.8% | 34.5% | 0.1% | $82k | 16.4% | 17.2% | 29.9% | 85.7% | 8.5% | 2.7% |
| Number Four | 1,772 | 1,455 | 78.3% | 5.0% | 10.9% | 0.2% | $65k | 20.7% | 14.8% | 22.7% | 79.4% | 14.5% | 0.4% |
| Number One | 2,597 | 1,881 | 80.6% | 2.4% | 7.6% | 0.0% | $80k | 19.5% | 15.9% | 18.5% | 78.9% | 13.6% | 2.3% |
| Number Three | 2,669 | 2,205 | 75.9% | 4.4% | 18.5% | 0.1% | $79k | 20.0% | 21.2% | 19.8% | 86.1% | 7.1% | 4.5% |
| Number Two | 3,105 | 2,328 | 72.0% | 4.2% | 18.7% | 0.6% | $95k | 18.3% | 10.6% | 18.6% | 80.1% | 7.2% | 4.2% |
Lunenburg County: 11 precincts
| Precinct | Population | Voting-age pop. | % White non-Hisp. | % Hispanic | % Black | % Asian | Median income* | % Bachelor's+ | % 18-29 (of adults) | % 65+ | % Homeowners | % Below poverty | % Spanish at home (adults) |
|---|---|---|---|---|---|---|---|---|---|---|---|---|---|
| ARROWHEAD GUN CLUB | 402 | 327 | 55.8% | 0.0% | 22.4% | 0.0% | $65k | 6.7% | 14.0% | 18.8% | 41.6% | 10.2% | 0.0% |
| BROWN'S STORE | 1,168 | 854 | 62.9% | 2.9% | 30.6% | 1.4% | $61k | 28.7% | 17.8% | 22.5% | 76.9% | 9.6% | 0.9% |
| COURTHOUSE | 1,009 | 814 | 58.2% | 5.2% | 32.5% | 0.2% | $56k | 6.6% | 11.2% | 23.9% | 71.8% | 15.9% | 4.9% |
| HOUND'S CREEK | 2,895 | 2,287 | 56.8% | 11.1% | 31.1% | 0.0% | $58k | 12.7% | 15.6% | 20.4% | 69.6% | 19.1% | 4.6% |
| MCCOY GHEE'S STORE | 911 | 775 | 61.2% | 0.9% | 29.4% | 0.2% | $68k | 12.3% | 16.9% | 27.4% | 68.3% | 15.3% | 0.0% |
| MEHERRIN FIRE DEPARTMENT | 1,502 | 1,225 | 59.8% | 6.0% | 29.6% | 0.3% | $64k | 5.8% | 9.5% | 24.8% | 77.0% | 15.3% | 5.7% |
| PEOPLE'S COMMUNITY CENTER | 790 | 656 | 56.1% | 2.6% | 38.5% | 0.0% | $46k | 10.5% | 16.5% | 22.6% | 64.8% | 17.0% | 1.0% |
| PLEASANT GROVE | 994 | 838 | 53.0% | 1.1% | 40.9% | 0.0% | $63k | 9.4% | 9.8% | 27.0% | 80.7% | 18.1% | 0.4% |
| PLYMOUTH | 600 | 501 | 57.3% | 4.5% | 35.8% | 0.1% | $45k | 8.7% | 15.4% | 21.1% | 64.0% | 15.0% | 3.0% |
| REEDY CREEK | 1,050 | 923 | 51.3% | 0.9% | 42.4% | 0.0% | $57k | 10.6% | 12.5% | 24.5% | 77.8% | 13.0% | 0.6% |
| ROSEBUD BAPTIST CHURCH | 703 | 476 | 57.5% | 23.0% | 19.4% | 0.0% | $58k | 13.7% | 15.1% | 24.7% | 72.2% | 20.9% | 10.3% |
Charlotte County: 7 precincts
| Precinct | Population | Voting-age pop. | % White non-Hisp. | % Hispanic | % Black | % Asian | Median income* | % Bachelor's+ | % 18-29 (of adults) | % 65+ | % Homeowners | % Below poverty | % Spanish at home (adults) |
|---|---|---|---|---|---|---|---|---|---|---|---|---|---|
| Bacon/Saxe | 2,286 | 1,745 | 67.5% | 1.7% | 27.4% | 0.1% | $66k | 19.1% | 15.1% | 18.4% | 78.9% | 20.6% | 0.2% |
| County Seat | 1,625 | 1,281 | 69.9% | 3.4% | 22.9% | 0.0% | $72k | 27.9% | 12.8% | 22.4% | 75.1% | 20.8% | 2.6% |
| Cullen/Red House | 1,498 | 1,167 | 71.3% | 0.7% | 23.1% | 0.0% | $72k | 30.2% | 6.2% | 26.9% | 78.1% | 21.1% | 0.6% |
| Drakes Branch | 1,862 | 1,416 | 57.9% | 4.1% | 31.9% | 0.9% | $47k | 12.5% | 20.3% | 16.4% | 57.1% | 22.1% | 2.6% |
| Keysville | 819 | 660 | 70.8% | 6.4% | 20.4% | 0.3% | $62k | 18.0% | 20.0% | 19.7% | 70.3% | 16.3% | 4.9% |
| Phenix | 1,601 | 1,260 | 69.6% | 3.4% | 22.5% | 0.0% | $71k | 17.2% | 13.8% | 27.5% | 87.6% | 16.9% | 0.1% |
| Red Oak Wylliesburg | 1,733 | 1,438 | 73.5% | 0.4% | 20.3% | 0.0% | $49k | 15.9% | 24.5% | 29.0% | 74.2% | 13.3% | 0.1% |
Cumberland County: 5 precincts
| Precinct | Population | Voting-age pop. | % White non-Hisp. | % Hispanic | % Black | % Asian | Median income* | % Bachelor's+ | % 18-29 (of adults) | % 65+ | % Homeowners | % Below poverty | % Spanish at home (adults) |
|---|---|---|---|---|---|---|---|---|---|---|---|---|---|
| Precinct 1 | 1,960 | 1,604 | 62.2% | 3.9% | 30.8% | 0.0% | $54k | 24.5% | 15.1% | 25.2% | 75.4% | 10.3% | 2.5% |
| Precinct 2 | 2,369 | 1,963 | 63.0% | 3.8% | 31.5% | 0.0% | $59k | 14.8% | 15.3% | 22.4% | 72.2% | 8.4% | 3.2% |
| Precinct 3 | 1,391 | 1,186 | 65.6% | 0.2% | 32.3% | 0.0% | $58k | 14.0% | 10.3% | 29.3% | 79.2% | 10.0% | 1.7% |
| Precinct 4 | 1,944 | 1,544 | 72.7% | 1.0% | 20.8% | 0.0% | $65k | 18.0% | 12.7% | 24.4% | 80.8% | 9.1% | 2.4% |
| Precinct 5 | 2,187 | 1,635 | 58.1% | 0.7% | 31.7% | 0.0% | $56k | 31.9% | 17.6% | 18.6% | 72.5% | 6.1% | 0.9% |
*Median income is approximate (see note above). ACS 2020-2024 5-year.
Nonpartisan voter information. GOTV Polling does not endorse any candidate.