
Virginia's 6th Congressional District
U.S. House · Virginia · District 6 · General election: Tuesday, November 3, 2026
Candidates on the November 3 ballot
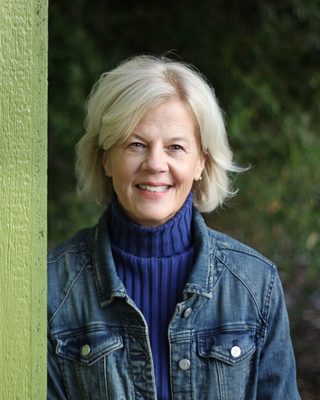 Beth A. MacyDemocraticPhoto: bethmacyforcongress.com
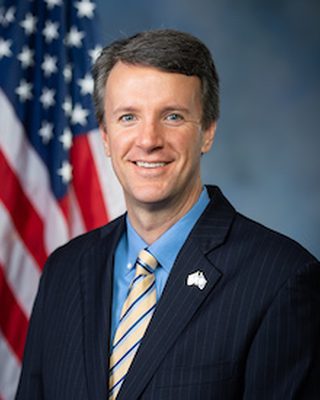 Ben L. ClineRepublicanIncumbentPhoto: U.S. Congress
Source: Virginia Department of Elections, candidate list, November 3, 2026 General Election, federal offices, certified list (list retrieved 2026-10-30; retrieved 2026-10-30). Order of names does not reflect ballot order. Incumbent tags appear only where the official list marks incumbents. Photos come from the Candidate Alerts database where one is on file; otherwise initials are shown.
Federal campaign finance filings for this seat: FEC election page (FEC registration is not the same as ballot qualification).
Certified candidates
- Ben Cline RepublicanIncumbent @RepBenCline Website
- Beth Macy Democratic Website
Certified candidate list from Candidate Alerts, as of 2026-09-24, based on Virginia Department of Elections. Includes candidates the database marks as on the November 3 ballot. Incumbent tags here follow the database.
Past election results
| Candidate | Party | Votes | Share |
|---|---|---|---|
| Ben L. Cline | Republican | 256,933 | 63.1% |
| Ken L. Mitchell | Democratic | 141,612 | 34.8% |
| Robert C. "Robby" Wells, Jr. | Independent | 7,980 | 2.0% |
| Write-In | 510 | 0.1% | |
| Total | 407,035 |
Source: Virginia Department of Elections, official election results (Enhanced Voting media export, by locality and precinct). Status: Official, Virginia Department of Elections ENR media export (created 2025-03-05, after State Board certification Dec 2 2024)
| Candidate | Party | Votes | Share |
|---|---|---|---|
| Ben L. Cline | Republican | 173,352 | 64.4% |
| Jennifer Lynn Lewis | Democratic | 95,410 | 35.4% |
| Write In | Wri | 472 | 0.2% |
| Total | 269,234 |
Source: Virginia Department of Elections, official results site (results.elections.virginia.gov), results by precinct JSON. Status: Official results (all reporting stages 'Certified'), Virginia Department of Elections official results site
Held under the district lines in effect at the time. Those boundaries differ from the 2026 district.
| Candidate | Party | Votes | Share |
|---|---|---|---|
| Benjamin Lee Cline | Republican | 246,606 | 64.6% |
| Nicholas Anthony Betts | Democratic | 134,729 | 35.3% |
| Write-Ins | 478 | 0.1% | |
| Total | 381,813 |
Source: Virginia Department of Elections, Historical Elections Database (historical.elections.virginia.gov). Status: Certified, Virginia Department of Elections Historical Elections Database (official certified results by locality and precinct; State Board of Elections certification)
Certified results from state or county election authorities, as compiled in the Candidate Alerts precinct results database (public API candidatealerts.com/api/district-results). Totals are sums of certified precinct and county-level rows.
Demographics
2020 Census demographics by district are not yet published in this data set.
0 of 249 precincts are above 50%, and 3 are above 25%. Source: Census American Community Survey 2020-2024 5-year block groups, allocated to current precinct shapes by area.
Poll status
Map
Share of adults (18+) who speak Spanish at home, by precinct. Census ACS 2020-2024 5-year estimates on the current precinct layer. Hover a precinct for its value.
District shown in red: U.S. Census Bureau cartographic boundary file for the 119th Congress (cb_2024_us_cd119_500k). These are the lines in effect for 2026 in this state per the Candidate Alerts district registry.
Precinct map: past elections and demographics
Choose a layer above. Hover a precinct for its values.
Precinct results
Certified precinct results on current precinct shapes, grouped by county. 488 precincts. "(part)" marks a precinct only partly inside this district; its full vote is shown, so district sums are approximate and are not the official district total. Elections were held under older lines and are shown on the 2026 district.
| County | 2024 President | 2020 President | ||
|---|---|---|---|---|
| Margin | Votes | Margin | Votes | |
| Rockingham County | R+36.9 | 47,753 | R+66.0 | 24,626 |
| Frederick County | R+28.3 | 51,332 | R+58.2 | 17,672 |
| Augusta County | R+47.2 | 43,582 | R+71.1 | 19,466 |
| Roanoke city | D+23.7 | 41,309 | R+9.1 | 14,866 |
| Roanoke County | R+29.0 | 32,079 | R+56.3 | 10,954 |
| Shenandoah County | R+41.9 | 24,103 | R+65.6 | 12,595 |
| Warren County | R+37.2 | 22,203 | R+63.9 | 9,599 |
| Botetourt County | R+44.8 | 21,709 | R+67.6 | 9,499 |
| Harrisonburg city | D+27.4 | 14,990 | R+0.2 | 5,638 |
| Page County | R+53.8 | 13,038 | R+75.9 | 7,363 |
| Rockbridge County | R+33.4 | 12,609 | R+63.7 | 6,703 |
| Staunton city | D+13.2 | 13,237 | R+37.2 | 3,921 |
| Salem city | R+18.8 | 12,951 | R+50.7 | 4,009 |
| Winchester city | D+9.6 | 11,588 | R+22.8 | 3,961 |
| Waynesboro city | R+5.5 | 11,064 | R+38.3 | 3,881 |
| Alleghany County | R+47.9 | 8,131 | R+62.4 | 5,475 |
| Clarke County | R+16.5 | 9,663 | R+52.1 | 3,531 |
| Bath County | R+53.5 | 2,532 | R+65.9 | 1,734 |
| Covington city | R+32.7 | 2,416 | R+45.9 | 1,491 |
| Buena Vista city | R+43.8 | 2,731 | R+56.3 | 971 |
| Lexington city | D+30.8 | 2,639 | R+28.2 | 631 |
| Highland County | R+43.8 | 1,523 | R+63.7 | 1,051 |
| All counties (approx.) | R+23.9 | 403,182 | R+54.8 | 169,637 |
Rockingham County: 58 precincts
| Precinct | 2024 President | 2020 President | ||
|---|---|---|---|---|
| Margin | Votes | Margin | Votes | |
| 101 - BROADWAY | R+32.6 | 2,294 | - | - |
| 101 - Broadway | - | - | R+62.9 | 1,376 |
| 102 - TIMBERVILLE | R+50.0 | 1,345 | - | - |
| 102 - Timberville | - | - | R+60.5 | 879 |
| 103 - FULKS RUN | R+73.6 | 1,264 | - | - |
| 103 - Fulks Run | - | - | R+85.7 | 922 |
| 104 - BERGTON | R+70.5 | 434 | - | - |
| 104 - Bergton | - | - | R+74.7 | 368 |
| 105 - LACEY SPRING | R+57.2 | 1,907 | - | - |
| 106 - LONE PINE | R+53.0 | 1,774 | - | - |
| 106 - Tenth Legion | - | - | R+72.3 | 625 |
| 107 - Plains | - | - | R+76.5 | 643 |
| 108 - Little North Mountain | - | - | R+76.5 | 456 |
| 201 - SINGERS GLEN | R+51.0 | 1,419 | - | - |
| 201 - Singers Glen | - | - | R+79.4 | 907 |
| 202 - EDOM | R+31.7 | 2,380 | - | - |
| 202 - Edom | - | - | R+66.7 | 1,202 |
| 203 - DAYTON | R+27.1 | 963 | - | - |
| 203 - Dayton | - | - | R+50.2 | 596 |
| 204 - MT CLINTON | R+42.5 | 1,586 | - | - |
| 204 - Mt Clinton | - | - | R+71.9 | 877 |
| 205 - SILVER LAKE | R+23.1 | 2,304 | - | - |
| 205 - Silver Lake | - | - | R+59.0 | 826 |
| 301 - KEEZLETOWN | R+35.6 | 1,019 | - | - |
| 301 - Keezletown | - | - | R+57.8 | 659 |
| 302 - PORT REPUBLIC | R+39.2 | 1,218 | - | - |
| 302 - Port Republic | - | - | R+74.0 | 926 |
| 303 - MELROSE | R+44.4 | 890 | - | - |
| 303 - Melrose | - | - | R+71.2 | 490 |
| 304 - GROTTOES | R+45.9 | 1,817 | - | - |
| 304 - Grottoes | - | - | R+60.4 | 1,084 |
| 305 - MASSANETTA SPRINGS | R+1.2 | 2,913 | - | - |
| 305 - Massanetta Springs | - | - | R+40.5 | 921 |
| 306 - CROSSROADS | R+5.2 | 2,871 | - | - |
| 307 - Crossroads | - | - | R+45.5 | 837 |
| 401 - WEST BRIDGEWATER | R+22.6 | 1,328 | - | - |
| 401 - West Bridgewater | - | - | R+55.8 | 624 |
| 402 - MONTEZUMA | R+49.5 | 1,561 | - | - |
| 402 - Montezuma | - | - | R+75.5 | 825 |
| 403 - MT CRAWFORD | R+27.3 | 242 | - | - |
| 403 - Mt Crawford | - | - | R+41.5 | 195 |
| 404 - NORTH RIVER | R+21.5 | 2,086 | - | - |
| 404 - North River | - | - | R+59.7 | 818 |
| 405 - OTTOBINE | R+68.0 | 1,734 | - | - |
| 405 - Ottobine | - | - | R+83.5 | 1,267 |
| 406 - EAST BRIDGEWATER | R+5.9 | 2,018 | - | - |
| 406 - East Bridgewater | - | - | R+43.6 | 761 |
| 501 - ELKTON | R+43.1 | 1,813 | - | - |
| 501 - Elkton | - | - | R+65.2 | 1,137 |
| 502 - SWIFT RUN | R+70.7 | 2,415 | - | - |
| 502 - Swift Run | - | - | R+78.8 | 1,661 |
| 503 - MCGAHEYSVILLE | R+40.5 | 2,289 | - | - |
| 503 - Mcgaheysville | - | - | R+65.3 | 1,134 |
| 504 - SOUTH FORK | R+64.5 | 1,129 | - | - |
| 504 - South Fork | - | - | R+79.2 | 689 |
| 505 - STONY RUN | R+10.9 | 1,739 | - | - |
| 505 - Stony Run | - | - | R+51.9 | 921 |
| 506 - DEEP RUN | R+49.6 | 1,001 | - | - |
Frederick County: 48 precincts
| Precinct | 2024 President | 2020 President | ||
|---|---|---|---|---|
| Margin | Votes | Margin | Votes | |
| 101 - RUSSELLS | R+47.7 | 2,485 | - | - |
| 101 - Russells | - | - | R+77.7 | 826 |
| 102 - GORE | R+51.7 | 2,506 | - | - |
| 102 - Gore | - | - | R+71.5 | 1,374 |
| 103 - KERNSTOWN | R+27.1 | 2,460 | - | - |
| 103 - Kernstown | - | - | R+61.9 | 925 |
| 104 - CEDAR CREEK | R+52.5 | 890 | - | - |
| 104 - Cedar Creek | - | - | R+58.4 | 847 |
| 105 - MIDDLETOWN | R+21.1 | 902 | - | - |
| 201 - GAINESBOROUGH | R+58.0 | 1,597 | - | - |
| 201 - Gainesborough | - | - | R+81.4 | 677 |
| 202 - ALBIN | R+39.7 | 1,975 | - | - |
| 202 - Albin | - | - | R+73.6 | 617 |
| 203 - REDLAND | R+40.1 | 2,925 | - | - |
| 203 - Redland | - | - | R+71.8 | 1,077 |
| 204 - NAIN | R+37.1 | 1,668 | - | - |
| 204 - Nain | - | - | R+71.7 | 604 |
| 205 - WHITE HALL | R+41.3 | 1,261 | - | - |
| 301 - CLEAR BROOK | R+54.6 | 1,943 | - | - |
| 301 - Clear Brook | - | - | R+72.5 | 641 |
| 302 - NEFF'S TOWN | R+23.6 | 576 | - | - |
| 302 - Neff's Town | - | - | R+41.2 | 1,247 |
| 303 - JORDAN SPRINGS | R+6.0 | 2,686 | - | - |
| 303 - White Hall | - | - | R+64.6 | 956 |
| 304 - GIBSON SCHOOL | R+5.7 | 669 | - | - |
| 305 - SUNNYSIDE | R+5.8 | 1,088 | - | - |
| 401 - ARMEL | R+24.6 | 1,786 | - | - |
| 401 - Carpers Valley | - | - | R+49.9 | 829 |
| 402 - SHENANDOAH | R+15.4 | 2,765 | - | - |
| 402 - Shenandoah | - | - | R+57.0 | 597 |
| 403 - PARKIN'S MILL | R+22.6 | 2,189 | - | - |
| 404 - WHITE OAK SCHOOL | R+20.0 | 2,015 | - | - |
| 501 - STEPHENS CITY | R+21.1 | 1,271 | - | - |
| 501 - Stephens City | - | - | R+47.2 | 926 |
| 502 - BASS-HOOVER | R+27.1 | 1,778 | - | - |
| 502 - Newtown | - | - | R+54.4 | 1,342 |
| 503 - CANTERBURG | R+10.7 | 2,734 | - | - |
| 503 - Canterburg | - | - | R+50.8 | 1,176 |
| 504 - VAUCLUSE SPRING | R+29.9 | 2,212 | - | - |
| 505 - AYLOR | R+21.1 | 1,258 | - | - |
| 601 - MILLBROOK | R+24.4 | 2,001 | - | - |
| 601 - Millbrook | - | - | R+47.4 | 740 |
| 602 - ASH HOLLOW | R+13.8 | 2,123 | - | - |
| 602 - Ash Hollow | - | - | R+37.0 | 859 |
| 603 - GREENWOOD | R+14.2 | 2,671 | - | - |
| 603 - Greenwood | - | - | R+42.4 | 1,412 |
| 604 - CARPERS VALLEY | R+35.4 | 676 | - | - |
| 605 - SULPHUR SPRING | R+43.7 | 222 | - | - |
Augusta County: 51 precincts
| Precinct | 2024 President | 2020 President | ||
|---|---|---|---|---|
| Margin | Votes | Margin | Votes | |
| 101 - JOLIVUE | R+28.9 | 1,216 | - | - |
| 101 - Jolivue | - | - | R+61.2 | 523 |
| 102 - STUARTS DRAFT ELEMENTARY | R+34.1 | 698 | - | - |
| 102 - Stuarts Draft Elementary | - | - | R+56.2 | 811 |
| 103 - VERONA | R+44.5 | 1,677 | - | - |
| 103 - Verona | - | - | R+67.4 | 674 |
| 104 - WILSON | R+29.1 | 1,697 | - | - |
| 201 - CRIMORA | R+56.6 | 2,578 | - | - |
| 201 - Crimora | - | - | R+74.2 | 1,209 |
| 202 - NEW HOPE | R+59.2 | 1,266 | - | - |
| 202 - New Hope | - | - | R+72.8 | 823 |
| 203 - WEYERS CAVE | R+42.6 | 2,155 | - | - |
| 203 - Weyers Cave | - | - | R+62.3 | 1,169 |
| 301 - FORT DEFIANCE | R+44.5 | 1,640 | - | - |
| 301 - Fort Defiance | - | - | R+69.8 | 1,164 |
| 302 - NORTH RIVER | R+57.0 | 1,312 | - | - |
| 302 - North River | - | - | R+73.2 | 541 |
| 303 - MOUNT SOLON | R+67.8 | 1,203 | - | - |
| 303 - Mount Solon | - | - | R+82.8 | 890 |
| 304 - Churchville Fire Station | - | - | R+79.2 | 602 |
| 304 - ROLLA | R+36.3 | 2,210 | - | - |
| 401 - BUFFALO GAP | R+56.1 | 1,382 | - | - |
| 401 - Buffalo Gap | - | - | R+77.7 | 712 |
| 402 - CHURCHVILLE ELEMENTARY | R+56.5 | 1,729 | - | - |
| 403 - CRAIGSVILLE (0001,0000) | R+75.9 | 871 | - | - |
| 403 - Craigsville | - | - | R+75.2 | 709 |
| 404 - DEERFIELD | R+63.7 | 413 | - | - |
| 404 - Deerfield | - | - | R+70.6 | 323 |
| 405 - CEDAR GREEN | R+36.3 | 1,682 | - | - |
| 405 - Cedar Green | - | - | R+68.2 | 616 |
| 501 - GREENVILLE | R+58.7 | 1,928 | - | - |
| 501 - Greenville | - | - | R+77.1 | 1,052 |
| 502 - MIDDLEBROOK | R+53.1 | 765 | - | - |
| 502 - Middlebrook | - | - | R+75.4 | 639 |
| 503 - SPOTTSWOOD | R+62.6 | 1,060 | - | - |
| 503 - Spottswood | - | - | R+72.3 | 752 |
| 504 - WHITE HILL | R+55.7 | 2,575 | - | - |
| 504 - White Hill | - | - | R+73.4 | 1,072 |
| 601 - SHERANDO | R+54.7 | 1,516 | - | - |
| 601 - Sherando | - | - | R+74.0 | 946 |
| 602 - RIDGEVIEW | R+54.3 | 2,203 | - | - |
| 602 - Ridgeview | - | - | R+70.6 | 1,352 |
| 603 - LYNDHURST | R+41.1 | 1,183 | - | - |
| 603 - Lyndhurst | - | - | R+66.1 | 986 |
| 604 - MOUNT VERNON | R+42.1 | 1,729 | - | - |
| 801 - DOOMS | R+48.4 | 1,597 | - | - |
| 801 - Dooms | - | - | R+71.4 | 839 |
| 802 - FISHERSVILLE | R+25.7 | 3,044 | - | - |
| 802 - Fishersville | - | - | R+65.5 | 1,062 |
| 803 - LADD | R+35.0 | 943 | - | - |
| 804 - GOOSE CREEK | R+34.7 | 1,310 | - | - |
Roanoke city: 40 precincts
| Precinct | 2024 President | 2020 President | ||
|---|---|---|---|---|
| Margin | Votes | Margin | Votes | |
| 001 -Peters Creek | D+48.5 | 1,896 | - | - |
| 002 - Grandview | D+36.4 | 1,757 | - | - |
| 003 -Preston Park | R+7.4 | 1,915 | - | - |
| 004 - Williamson Road | D+11.9 | 1,940 | - | - |
| 005 - East Gate | R+16.2 | 2,367 | - | - |
| 006 - Hollins Road | R+1.7 | 1,828 | - | - |
| 007 - Southeast | R+0.7 | 1,761 | - | - |
| 008 - Lincoln Terrace | D+75.3 | 1,387 | - | - |
| 009 - Highland | D+43.3 | 2,072 | - | - |
| 010 - Old Southwest-Wasena | D+41.0 | 2,426 | - | - |
| 011 - RALEIGH COURT | D+34.2 | 2,638 | - | - |
| 012 - SOUTH ROANOKE | D+8.9 | 2,157 | - | - |
| 013 - GARDEN CITY | R+18.1 | 2,147 | - | - |
| 014 - Crystal Spring | D+21.8 | 2,400 | - | - |
| 015 - Grandin Court | D+23.3 | 2,219 | - | - |
| 016 - Deyerle | D+8.1 | 2,428 | - | - |
| 017 - LEE-HI | D+31.0 | 2,594 | - | - |
| 018 - Summit Hills | D+21.1 | 1,925 | - | - |
| 019 - Forest Park | D+63.6 | 1,669 | - | - |
| 020 - EUREKA PARK | D+78.6 | 1,783 | - | - |
| 1 -Peters Creek | - | - | D+24.7 | 551 |
| 10 - Old Southwest-Wasena | - | - | D+1.7 | 846 |
| 11 - Raleigh Court | - | - | R+14.4 | 850 |
| 12 - South Roanoke | - | - | R+29.0 | 656 |
| 13 - Garden City | - | - | R+42.4 | 973 |
| 14 - Crystal Spring | - | - | R+28.9 | 729 |
| 15 - Grandin Court | - | - | R+18.9 | 715 |
| 16 - Deyerle | - | - | R+47.5 | 724 |
| 17 - Lee-Hi | - | - | R+9.2 | 969 |
| 18 - Summit Hills | - | - | R+8.8 | 811 |
| 19 - Forest Park | - | - | D+61.1 | 612 |
| 2 - Grandview | - | - | R+3.1 | 711 |
| 20 - Eureka Park | - | - | D+64.8 | 611 |
| 3 -Preston Park | - | - | R+28.4 | 855 |
| 4 - Williamson Road | - | - | R+14.2 | 752 |
| 5 - East Gate | - | - | R+49.6 | 816 |
| 6 - Hollins Road | - | - | R+22.8 | 746 |
| 7 - Southeast | - | - | R+34.3 | 732 |
| 8 - Lincoln Terrace | - | - | D+69.4 | 468 |
| 9 - Highland | - | - | D+23.4 | 739 |
Roanoke County: 35 precincts
| Precinct | 2024 President | 2020 President | ||
|---|---|---|---|---|
| Margin | Votes | Margin | Votes | |
| 101 - CATAWBA | R+48.2 | 2,083 | - | - |
| 102 - RICHFIELD | R+35.8 | 1,791 | - | - |
| 103 - Glenvar | - | - | R+63.3 | 1,049 |
| 103 - NORTH GLENVAR (0000,0001) | R+39.5 | 1,807 | - | - |
| 104 - NORTHSIDE | R+12.8 | 1,910 | - | - |
| 104 - Northside | - | - | R+42.8 | 514 |
| 105 - HANGING ROCK | R+14.6 | 2,019 | - | - |
| 105 - Peters Creek | - | - | R+51.3 | 916 |
| 108 - Wildwood | - | - | R+62.7 | 660 |
| 201 - PLANTATION | R+21.0 | 1,745 | - | - |
| 201 - Plantation | - | - | R+47.3 | 747 |
| 202 - BURLINGTON | R+3.3 | 1,203 | - | - |
| 202 - Burlington | - | - | R+31.3 | 578 |
| 203 - MOUNTAIN VIEW | R+24.4 | 2,553 | - | - |
| 203 - Mountain View | - | - | R+60.4 | 981 |
| 204 - Botetourt Springs | - | - | R+54.1 | 754 |
| 204 - GREEN RIDGE | R+14.9 | 1,870 | - | - |
| 205 - ORCHARDS | R+27.9 | 2,441 | - | - |
| 205 - Orchards | - | - | R+67.3 | 704 |
| 206 - HOLLINS | R+19.0 | 952 | - | - |
| 206 - Hollins | - | - | R+47.4 | 426 |
| 401 - BONSACK | R+37.3 | 1,183 | - | - |
| 401 - South Lindenwood | - | - | R+63.0 | 368 |
| 402 - Bonsack | - | - | R+54.8 | 197 |
| 402 - NORTH LINDENWOOD | R+37.9 | 1,794 | - | - |
| 403 - NORTH VINTON | R+28.2 | 1,888 | - | - |
| 403 - North Vinton | - | - | R+49.4 | 650 |
| 404 - SOUTH VINTON | R+29.5 | 1,823 | - | - |
| 404 - South Vinton | - | - | R+51.8 | 633 |
| 405 - North Lindenwood | - | - | R+70.0 | 400 |
| 405 - SOUTH LINDENWOOD | R+35.3 | 1,592 | - | - |
| 406 - MOUNT PLEASANT | R+46.0 | 2,215 | - | - |
| 406 - Mount Pleasant | - | - | R+67.9 | 838 |
| 505 - CLEARBROOK | R+38.8 | 1,210 | - | - |
| 505 - Clearbrook | - | - | R+64.6 | 539 |
Shenandoah County: 26 precincts
| Precinct | 2024 President | 2020 President | ||
|---|---|---|---|---|
| Margin | Votes | Margin | Votes | |
| 101 - ORKNEY SPRINGS | R+27.3 | 1,238 | - | - |
| 101 - Orkney Springs | - | - | R+55.1 | 686 |
| 103 - NEW MARKET (1710,0000) | R+42.5 | 2,715 | - | - |
| 103 - New Market | - | - | R+66.1 | 1,666 |
| 201 - CONICVILLE | R+58.4 | 2,319 | - | - |
| 201 - Conicville | - | - | R+75.6 | 1,178 |
| 202 - MT JACKSON (0000,1680) | R+48.6 | 1,631 | - | - |
| 202 - Mt Jackson | - | - | R+63.3 | 1,034 |
| 302 - EDINBURG (0000,0850) | R+44.4 | 1,530 | - | - |
| 302 - Edinburg | - | - | R+62.0 | 919 |
| 303 - ST LUKE | R+53.5 | 2,090 | - | - |
| 303 - St Luke | - | - | R+78.6 | 981 |
| 304 - FORT VALLEY | R+42.9 | 972 | - | - |
| 304 - Fort Valley | - | - | R+73.5 | 631 |
| 401 - WOODSTOCK NORTH (0000,2670) | R+28.5 | 1,945 | - | - |
| 401 - Woodstock | - | - | R+55.3 | 1,323 |
| 402 - WOODSTOCK SOUTH (0000,0001) | R+25.9 | 1,494 | - | - |
| 501 - CEDAR CREEK | R+50.3 | 173 | - | - |
| 501 - Cedar Creek | - | - | R+56.5 | 124 |
| 503 - TOMS BROOK (2460,0000) | R+44.9 | 2,502 | - | - |
| 503 - Toms Brook | - | - | R+71.8 | 1,140 |
| 504 - LEBANON CHURCH | R+54.2 | 1,793 | - | - |
| 504 - Lebanon Church | - | - | R+67.6 | 1,099 |
| 601 - STRASBURG WEST (2370,0000) | R+30.4 | 1,790 | - | - |
| 601 - Strasburg | - | - | R+59.0 | 1,814 |
| 602 - STRASBURG EAST (0000,0001) | R+30.5 | 1,911 | - | - |
Warren County: 22 precincts
| Precinct | 2024 President | 2020 President | ||
|---|---|---|---|---|
| Margin | Votes | Margin | Votes | |
| 101 - FORK TOWN | R+31.1 | 1,435 | - | - |
| 101 - Fork Town | - | - | R+49.2 | 575 |
| 102 - OTTERBURN | R+48.8 | 2,871 | - | - |
| 102 - Otterburn | - | - | R+74.9 | 1,257 |
| 201 - HAPPY CREEK (0000,1040B) | R+33.2 | 2,382 | - | - |
| 201 - Happy Creek | - | - | R+62.8 | 908 |
| 202 - LINDEN | R+27.0 | 2,524 | - | - |
| 202 - Linden | - | - | R+54.6 | 1,087 |
| 301 - NORTH RIVER | R+30.2 | 1,842 | - | - |
| 301 - North River | - | - | R+55.5 | 715 |
| 302 - RIVERTON | R+46.4 | 2,453 | - | - |
| 302 - Riverton | - | - | R+70.9 | 991 |
| 401 - EAST SHENANDOAH | R+44.1 | 3,150 | - | - |
| 401 - East Shenandoah | - | - | R+68.3 | 1,492 |
| 402 - TOWN - WEST SHENANDOAH (1040D,0000) | R+35.2 | 1,402 | - | - |
| 402 - Town - West Shenandoah | - | - | R+59.7 | 536 |
| 501 - SOUTH RIVER (0000,1040E) | R+26.7 | 2,499 | - | - |
| 501 - South River | - | - | R+58.2 | 1,040 |
| 502 - BENTONVILLE | R+47.3 | 940 | - | - |
| 502 - Bentonville | - | - | R+72.5 | 567 |
| 504 - BROWNTOWN | R+35.9 | 705 | - | - |
| 504 - Browntown | - | - | R+66.8 | 431 |
Botetourt County: 20 precincts
| Precinct | 2024 President | 2020 President | ||
|---|---|---|---|---|
| Margin | Votes | Margin | Votes | |
| 101 - DALEVILLE | R+31.7 | 2,831 | - | - |
| 101 - Daleville | - | - | R+57.0 | 901 |
| 102 - GREENFIELD | R+41.3 | 2,084 | - | - |
| 102 - Greenfield | - | - | R+72.8 | 989 |
| 201 - BLUE RIDGE | R+48.2 | 2,166 | - | - |
| 201 - Blue Ridge | - | - | R+67.0 | 1,116 |
| 202 - RAINBOW FOREST | R+46.8 | 2,212 | - | - |
| 202 - Rainbow Forest | - | - | R+63.7 | 1,060 |
| 301 - BUCHANAN (0000,0001) | R+57.5 | 1,919 | - | - |
| 301 - Buchanan | - | - | R+66.8 | 1,087 |
| 302 - MILL CREEK | R+49.6 | 2,097 | - | - |
| 302 - Mill Creek | - | - | R+65.6 | 969 |
| 403 - EAGLE ROCK | R+54.4 | 1,366 | - | - |
| 403 - Eagle Rock | - | - | R+74.4 | 800 |
| 406 - FINCASTLE (0000,0001) | R+47.0 | 2,933 | - | - |
| 406 - Fincastle | - | - | R+77.0 | 991 |
| 501 - TROUTVILLE (0000,0002) | R+48.2 | 1,284 | - | - |
| 501 - Troutville | - | - | R+70.0 | 634 |
| 502 - CLOVERDALE | R+35.8 | 2,817 | - | - |
| 502 - Cloverdale | - | - | R+62.9 | 952 |
Harrisonburg city: 16 precincts
| Precinct | 2024 President | 2020 President | ||
|---|---|---|---|---|
| Margin | Votes | Margin | Votes | |
| 101 - NORTHEAST | D+23.6 | 2,184 | - | - |
| 101 - Northeast | - | - | D+13.7 | 924 |
| 102 - EAST CENTRAL | D+43.8 | 1,581 | - | - |
| 102 - East Central | - | - | D+9.7 | 401 |
| 103 - SOUTHEAST | D+25.1 | 1,645 | - | - |
| 103 - Southeast | - | - | D+3.8 | 910 |
| 104 - EAST | D+17.5 | 1,875 | - | - |
| 104 - East | - | - | R+4.3 | 876 |
| 105 - SOUTH EAST CENTRAL | D+56.2 | 349 | - | - |
| 105 - South East Central | - | - | D+29.3 | 266 |
| 201 - NORTHWEST | D+27.1 | 2,707 | - | - |
| 201 - Northwest | - | - | R+14.1 | 785 |
| 202 - SOUTHWEST | D+18.4 | 2,154 | - | - |
| 202 - Southwest | - | - | R+8.0 | 786 |
| 203 - WEST | D+33.3 | 2,495 | - | - |
| 203 - West | - | - | R+11.7 | 690 |
Page County: 10 precincts
| Precinct | 2024 President | 2020 President | ||
|---|---|---|---|---|
| Margin | Votes | Margin | Votes | |
| 101 - WEST LURAY (0000,0001) | R+35.6 | 2,636 | - | - |
| 101 - West Luray | - | - | R+69.4 | 1,201 |
| 201 - EAST LURAY (0001,0000) | R+41.7 | 2,671 | - | - |
| 201 - East Luray | - | - | R+70.4 | 1,327 |
| 301 - MARKSVILLE (0000,0002) | R+64.3 | 2,919 | - | - |
| 301 - Marksville | - | - | R+80.5 | 1,690 |
| 401 - NEWPORT | R+62.5 | 2,291 | - | - |
| 401 - Newport | - | - | R+77.8 | 1,299 |
| 501 - SHENANDOAH (0001,0000) | R+65.5 | 2,521 | - | - |
| 501 - Shenandoah | - | - | R+78.6 | 1,846 |
Rockbridge County: 33 precincts
| Precinct | 2024 President | 2020 President | ||
|---|---|---|---|---|
| Margin | Votes | Margin | Votes | |
| 101 - AIRPORT | D+3.2 | 1,372 | - | - |
| 101 - Airport | - | - | R+50.7 | 446 |
| 102 - BEN SALEM | R+37.8 | 521 | - | - |
| 102 - Ben Salem | - | - | R+63.4 | 415 |
| 103 - PLANK ROAD | R+44.5 | 436 | - | - |
| 103 - Plank Road | - | - | R+75.5 | 282 |
| 104 - EFFINGER | R+40.9 | 492 | - | - |
| 104 - Effinger | - | - | R+62.9 | 315 |
| 201 - COLLIERSTOWN | R+37.5 | 536 | - | - |
| 201 - Collierstown | - | - | R+62.3 | 416 |
| 202 - HIGHLAND BELLE | R+22.7 | 1,592 | - | - |
| 202 - Highland Belle | - | - | R+64.6 | 748 |
| 203 - VO-TECH | R+3.1 | 286 | - | - |
| 203 - Vo-tech | - | - | R+43.3 | 180 |
| 301 - MAURY RIVER (0001,0000) | R+36.0 | 947 | - | - |
| 301 - Maury River | - | - | R+48.7 | 491 |
| 302 - NATURAL BRIDGE | R+56.1 | 791 | - | - |
| 302 - Natural Bridge | - | - | R+69.3 | 544 |
| 303 - FALLING SPRING | R+49.4 | 405 | - | - |
| 303 - Falling Spring | - | - | R+79.0 | 233 |
| 401 - FAIRFIELD | R+41.8 | 856 | - | - |
| 402 - MOUNTAIN VIEW | R+45.8 | 1,297 | - | - |
| 402 - Mountain View | - | - | R+76.9 | 733 |
| 403 - VESUVIUS | R+58.4 | 401 | - | - |
| 403 - Vesuvius | - | - | R+69.1 | 288 |
| 501 - GOSHEN (0001,0000) | R+72.2 | 435 | - | - |
| 501 - Goshen | - | - | R+81.0 | 342 |
| 502 - MEADOWVIEW | R+15.2 | 846 | - | - |
| 502 - Meadowview | - | - | R+44.2 | 425 |
| 503 - ROCKBRIDGE BATHS | R+32.9 | 502 | - | - |
| 503 - Rockbridge Baths | - | - | R+56.7 | 337 |
| 504 - ROCKBRIDGE | R+34.9 | 894 | - | - |
| 504 - Rockbridge | - | - | R+64.8 | 508 |
Staunton city: 10 precincts
| Precinct | 2024 President | 2020 President | ||
|---|---|---|---|---|
| Margin | Votes | Margin | Votes | |
| 101 - WARD NO 1 | D+8.8 | 2,786 | - | - |
| 101 - Ward No 1 | - | - | R+36.4 | 938 |
| 201 - WARD NO 2 | R+6.1 | 3,054 | - | - |
| 201 - Ward No 2 | - | - | R+41.7 | 1,028 |
| 301 - WARD NO 3 | D+10.2 | 2,589 | - | - |
| 301 - Ward No 3 | - | - | R+42.9 | 750 |
| 401 - WARD NO 4 | D+19.8 | 2,271 | - | - |
| 401 - Ward No 4 | - | - | R+40.0 | 608 |
| 501 - WARD NO 5 | D+38.4 | 2,537 | - | - |
| 501 - Ward No 5 | - | - | R+20.6 | 597 |
Salem city: 20 precincts
| Precinct | 2024 President | 2020 President | ||
|---|---|---|---|---|
| Margin | Votes | Margin | Votes | |
| 001 - NORTH SALEM NO 2 | R+7.4 | 1,591 | - | - |
| 002 - CONEHURST | R+18.0 | 877 | - | - |
| 003 - BEVERLY HEIGHTS | R+35.5 | 849 | - | - |
| 004 - WEST SALEM | R+20.4 | 1,301 | - | - |
| 005 - NORTH SALEM NO 1 | R+9.1 | 1,799 | - | - |
| 006 - SOUTH SALEM NO 1 | R+20.2 | 1,013 | - | - |
| 007 - SOUTH SALEM NO 2 | R+31.3 | 1,163 | - | - |
| 008 - EAST SALEM | R+21.7 | 561 | - | - |
| 009 - SOUTH SIDE HILLS | R+28.3 | 1,823 | - | - |
| 010 - HIDDEN VALLEY | R+11.7 | 1,974 | - | - |
| 1 - North Salem No 2 | - | - | R+47.6 | 368 |
| 10 - Hidden Valley | - | - | R+54.3 | 565 |
| 2 - Conehurst | - | - | R+40.1 | 372 |
| 3 - Beverly Heights | - | - | R+55.9 | 236 |
| 4 - West Salem | - | - | R+57.0 | 356 |
| 5 - North Salem No 1 | - | - | R+51.3 | 556 |
| 6 - South Salem No 1 | - | - | R+49.9 | 401 |
| 7 - South Salem No 2 | - | - | R+48.6 | 469 |
| 8 - East Salem | - | - | R+34.7 | 222 |
| 9 - South Side Hills | - | - | R+59.9 | 464 |
Winchester city: 12 precincts
| Precinct | 2024 President | 2020 President | ||
|---|---|---|---|---|
| Margin | Votes | Margin | Votes | |
| 101 - MERRIMANS | D+17.9 | 2,607 | - | - |
| 101 - Merrimans | - | - | R+34.2 | 655 |
| 102 - OLD TOWN | D+12.3 | 1,900 | - | - |
| 102 - Old Town | - | - | R+31.2 | 487 |
| 201 - VIRGINIA AVENUE | D+19.6 | 1,951 | - | - |
| 201 - Virginia Avenue | - | - | R+1.7 | 765 |
| 301 - WAR MEMORIAL | D+3.6 | 2,027 | - | - |
| 301 - War Memorial | - | - | R+18.9 | 836 |
| 401 - FREDERICK DOUGLASS | R+3.6 | 1,108 | - | - |
| 401 - Frederick Douglass | - | - | R+19.9 | 493 |
| 402 - ROLLING HILLS | R+0.1 | 1,995 | - | - |
| 402 - Rolling Hills | - | - | R+35.7 | 725 |
Waynesboro city: 8 precincts
| Precinct | 2024 President | 2020 President | ||
|---|---|---|---|---|
| Margin | Votes | Margin | Votes | |
| 001 - WARD A | R+9.8 | 1,930 | - | - |
| 002 - WARD B | D+1.1 | 3,293 | - | - |
| 003 - WARD C | R+5.3 | 2,703 | - | - |
| 004 - WARD D | R+9.9 | 3,138 | - | - |
| 1 - Ward A | - | - | R+34.1 | 824 |
| 2 - Ward B | - | - | R+41.7 | 985 |
| 3 - Ward C | - | - | R+30.7 | 967 |
| 4 - Ward D | - | - | R+45.1 | 1,105 |
Alleghany County: 24 precincts
| Precinct | 2024 President | 2020 President | ||
|---|---|---|---|---|
| Margin | Votes | Margin | Votes | |
| 101 - ARRITT | R+64.8 | 890 | - | - |
| 101 - Arritt | - | - | R+77.5 | 612 |
| 103 - DAMERON | R+66.3 | 309 | - | - |
| 103 - Dameron | - | - | R+76.4 | 242 |
| 201 - HUMPBACK BRIDGE | R+53.1 | 497 | - | - |
| 201 - Humpback Bridge | - | - | R+71.7 | 336 |
| 202 - DOLLY ANN | R+47.6 | 729 | - | - |
| 202 - Dolly Ann | - | - | R+66.3 | 412 |
| 301 - CALLAGHAN | R+76.3 | 456 | - | - |
| 301 - Callaghan | - | - | R+84.4 | 379 |
| 302 - GRIFFITH | R+60.6 | 742 | - | - |
| 302 - Griffith | - | - | R+64.1 | 537 |
| 401 - LOW MOOR | R+43.0 | 546 | - | - |
| 401 - Low Moor | - | - | R+69.8 | 358 |
| 402 - JACKSON HEIGHTS | R+54.1 | 776 | - | - |
| 402 - Jackson Heights | - | - | R+68.1 | 408 |
| 501 - IRON GATE (0000,0001) | R+39.6 | 265 | - | - |
| 501 - Iron Gate | - | - | R+44.3 | 230 |
| 502 - PETERS SWITCH | R+58.9 | 983 | - | - |
| 502 - Peters Switch | - | - | R+64.3 | 714 |
| 601 - DISTRICT 1 (0001,0000) | R+21.2 | 1,005 | - | - |
| 601 - District 1 | - | - | R+44.0 | 725 |
| 701 - DISTRICT 2 (0001,0000) | R+15.9 | 933 | - | - |
| 701 - District 2 | - | - | R+32.8 | 522 |
Clarke County: 14 precincts
| Precinct | 2024 President | 2020 President | ||
|---|---|---|---|---|
| Margin | Votes | Margin | Votes | |
| 101 - RUSSELL (0160D,0000) | R+28.9 | 2,061 | - | - |
| 101 - Russell | - | - | R+66.6 | 670 |
| 201 - BERRYVILLE (0160C,0160B,0160A,0160D) | R+2.6 | 1,820 | - | - |
| 201 - Berryville | - | - | R+37.2 | 527 |
| 301 - MILLWOOD (0000,0160C,0160B) | R+14.0 | 1,532 | - | - |
| 301 - Millwood | - | - | R+56.2 | 479 |
| 302 - PINE GROVE | R+11.7 | 634 | - | - |
| 302 - Pine Grove | - | - | R+39.1 | 284 |
| 401 - WHITE POST (0003,0002) | R+18.4 | 1,833 | - | - |
| 401 - White Post | - | - | R+50.3 | 791 |
| 501 - BUCKMARSH (0160B,0160A,0000) | R+18.9 | 1,278 | - | - |
| 501 - Buckmarsh | - | - | R+56.9 | 480 |
| 502 - BLUE RIDGE | R+17.2 | 505 | - | - |
| 502 - Blue Ridge | - | - | R+49.3 | 300 |
Bath County: 14 precincts
| Precinct | 2024 President | 2020 President | ||
|---|---|---|---|---|
| Margin | Votes | Margin | Votes | |
| 101 - WARM SPRINGS | R+42.9 | 452 | - | - |
| 101 - Warm Springs | - | - | R+65.0 | 263 |
| 102 - MOUNTAIN GROVE | R+58.3 | 72 | - | - |
| 102 - Mountain Grove | - | - | R+70.1 | 67 |
| 201 - HOT SPRINGS | R+41.8 | 426 | - | - |
| 201 - Hot Springs | - | - | R+45.4 | 238 |
| 301 - FAIRVIEW | R+71.2 | 413 | - | - |
| 301 - Fairview | - | - | R+81.7 | 300 |
| 302 - BURNSVILLE | R+62.2 | 90 | - | - |
| 302 - Burnsville | - | - | R+88.3 | 94 |
| 401 - MILLBORO | R+62.7 | 549 | - | - |
| 401 - Millboro | - | - | R+66.3 | 424 |
| 501 - HEALING SPRINGS | R+46.4 | 530 | - | - |
| 501 - Healing Springs | - | - | R+59.8 | 348 |
Covington city: 10 precincts
| Precinct | 2024 President | 2020 President | ||
|---|---|---|---|---|
| Margin | Votes | Margin | Votes | |
| 101 - PRECINCT 1-1 | R+31.6 | 408 | - | - |
| 101 - Precinct 1-1 | - | - | R+37.6 | 266 |
| 201 - PRECINCT 2-1 | R+22.3 | 471 | - | - |
| 201 - Precinct 2-1 | - | - | R+44.5 | 247 |
| 301 - PRECINCT 3-1 | R+3.3 | 365 | - | - |
| 301 - Precinct 3-1 | - | - | R+17.5 | 228 |
| 401 - PRECINCT 4-1 | R+42.0 | 600 | - | - |
| 401 - Precinct 4-1 | - | - | R+56.3 | 366 |
| 501 - PRECINCT 5-1 | R+51.2 | 572 | - | - |
| 501 - Precinct 5-1 | - | - | R+59.4 | 384 |
Buena Vista city: 4 precincts
| Precinct | 2024 President | 2020 President | ||
|---|---|---|---|---|
| Margin | Votes | Margin | Votes | |
| 001 - FIRST WARD | R+50.5 | 1,555 | - | - |
| 002 - SECOND WARD | R+35.0 | 1,176 | - | - |
| 1 - First Ward | - | - | R+58.5 | 542 |
| 2 - Second Ward | - | - | R+53.6 | 429 |
Lexington city: 2 precincts
| Precinct | 2024 President | 2020 President | ||
|---|---|---|---|---|
| Margin | Votes | Margin | Votes | |
| 001 - LEXINGTON | D+30.8 | 2,639 | - | - |
| 1 - Lexington | - | - | R+28.2 | 631 |
Highland County: 11 precincts
| Precinct | 2024 President | 2020 President | ||
|---|---|---|---|---|
| Margin | Votes | Margin | Votes | |
| 001 - MONTEREY (0001,0000) | R+36.9 | 501 | - | - |
| 003 - WILSONS MILL | R+62.8 | 113 | - | - |
| 005 - BLUE GRASS | R+37.0 | 303 | - | - |
| 007 - MILL GAP | R+32.2 | 171 | - | - |
| 008 - MCDOWELL | R+56.1 | 435 | - | - |
| 1 - Monterey | - | - | R+57.2 | 285 |
| 10 - Headwaters | - | - | R+85.7 | 84 |
| 3 - Wilsons Mill | - | - | R+75.3 | 85 |
| 5 - Blue Grass | - | - | R+52.0 | 200 |
| 7 - Mill Gap | - | - | R+52.7 | 129 |
| 8 - Mcdowell | - | - | R+73.9 | 268 |
2024 President (Kamala D. Harris vs. Donald J. Trump). Source: Virginia Department of Elections, official election results (Enhanced Voting media export, by locality and precinct). Official, Virginia Department of Elections ENR media export (created 2025-03-05, after State Board certification Dec 2 2024).
2020 President (Joseph Robinette Biden, Jr vs. Donald J. Trump). Source: Virginia Department of Elections, Historical Elections Database (historical.elections.virginia.gov). Certified, Virginia Department of Elections Historical Elections Database (official certified results by locality and precinct; State Board of Elections certification).
Precinct demographics
Demographics are Census American Community Survey (ACS) 2020-2024 5-year estimates for block groups, assigned to precincts by area share. They describe the resident population, not registered or likely voters, and include non-citizens. ACS margins of error are not shown; small precincts carry large error. Area weighting assumes people are spread evenly within each block group, so large rural precincts are the least reliable. Median income is a household-weighted average of block-group medians, an approximation.
| Area | Population | Voting-age pop. | % White non-Hisp. | % Hispanic | % Black | % Asian | Median income* | % Bachelor's+ | % 18-29 (of adults) | % 65+ | % Homeowners | % Below poverty | % Spanish at home (adults) |
|---|---|---|---|---|---|---|---|---|---|---|---|---|---|
| District | 788,219 | 627,143 | 77.6% | 8.6% | 8.0% | 1.7% | $77k | 28.7% | 20.1% | 20.0% | 68.9% | 11.9% | 5.7% |
| Roanoke city (in district) | 97,822 | 75,714 | 55.2% | 8.9% | 27.6% | 3.2% | $59k | 30.0% | 19.3% | 17.7% | 52.3% | 18.3% | 5.7% |
| Frederick County (in district) | 94,762 | 73,289 | 77.4% | 12.6% | 4.4% | 2.0% | $103k | 31.9% | 16.8% | 18.8% | 79.4% | 6.8% | 8.1% |
| Rockingham County (in district) | 86,502 | 67,382 | 84.3% | 9.4% | 2.2% | 1.1% | $81k | 29.2% | 19.2% | 20.0% | 75.0% | 9.9% | 6.5% |
| Augusta County (in district) | 78,212 | 63,822 | 87.9% | 4.0% | 4.3% | 0.4% | $84k | 25.0% | 16.0% | 22.6% | 80.1% | 6.7% | 2.1% |
| Roanoke County (in district) | 57,349 | 46,329 | 82.1% | 3.5% | 8.9% | 2.3% | $79k | 29.3% | 17.0% | 23.8% | 75.3% | 8.6% | 2.0% |
| Harrisonburg city (in district) | 50,110 | 41,511 | 60.8% | 23.6% | 7.2% | 3.6% | $70k | 37.3% | 47.3% | 10.4% | 39.3% | 25.8% | 17.7% |
| Shenandoah County (in district) | 44,876 | 35,387 | 83.9% | 9.2% | 2.9% | 1.2% | $69k | 21.6% | 16.3% | 22.4% | 73.3% | 11.8% | 6.6% |
| Warren County (in district) | 41,482 | 32,524 | 81.3% | 7.4% | 5.0% | 1.3% | $91k | 24.9% | 17.2% | 17.2% | 75.9% | 11.6% | 4.4% |
| Botetourt County (in district) | 33,963 | 27,647 | 90.4% | 2.5% | 2.6% | 0.7% | $82k | 28.5% | 14.0% | 24.3% | 85.5% | 6.2% | 1.7% |
| Winchester city (in district) | 27,516 | 21,335 | 61.4% | 20.9% | 7.8% | 2.1% | $75k | 31.1% | 23.8% | 16.6% | 43.5% | 21.7% | 13.6% |
| Staunton city (in district) | 25,561 | 20,615 | 78.2% | 4.8% | 10.3% | 1.4% | $69k | 37.6% | 19.6% | 21.2% | 60.6% | 12.6% | 3.3% |
| Salem city (in district) | 24,994 | 20,156 | 81.4% | 4.8% | 8.9% | 2.0% | $72k | 33.2% | 23.8% | 19.7% | 63.1% | 10.2% | 2.1% |
| Page County (in district) | 23,656 | 19,014 | 92.0% | 2.5% | 2.1% | 0.4% | $57k | 15.3% | 15.7% | 22.3% | 71.7% | 11.3% | 2.0% |
| Rockbridge County (in district) | 22,784 | 18,896 | 89.3% | 2.3% | 2.6% | 0.9% | $67k | 32.8% | 14.7% | 27.4% | 79.0% | 7.6% | 1.5% |
| Waynesboro city (in district) | 22,641 | 17,595 | 71.8% | 9.5% | 10.9% | 1.8% | $65k | 25.8% | 18.7% | 17.9% | 60.0% | 11.2% | 6.4% |
| Clarke County (in district) | 15,269 | 12,271 | 82.0% | 7.8% | 5.3% | 0.9% | $111k | 39.8% | 13.8% | 23.0% | 81.5% | 7.0% | 6.1% |
| Alleghany County (in district) | 15,044 | 12,254 | 90.8% | 1.6% | 5.4% | 0.4% | $58k | 14.6% | 15.9% | 26.2% | 82.0% | 11.8% | 1.0% |
| Lexington city (in district) | 7,260 | 6,739 | 78.6% | 6.1% | 5.6% | 3.5% | $90k | 51.3% | 56.8% | 16.9% | 54.5% | 13.8% | 6.0% |
| Buena Vista city (in district) | 6,499 | 5,070 | 84.7% | 0.2% | 2.0% | 0.9% | $53k | 23.3% | 28.3% | 18.7% | 56.5% | 18.8% | 0.0% |
| Covington city (in district) | 5,527 | 4,246 | 79.2% | 3.4% | 12.7% | 1.3% | $43k | 9.4% | 17.9% | 19.8% | 70.1% | 25.9% | 2.8% |
| Bath County (in district) | 4,097 | 3,388 | 91.9% | 3.1% | 3.4% | 0.2% | $67k | 16.7% | 11.5% | 27.2% | 71.3% | 23.7% | 1.9% |
| Highland County (in district) | 2,293 | 1,960 | 94.9% | 0.0% | 0.0% | 2.4% | $69k | 30.8% | 12.5% | 34.7% | 88.9% | 9.5% | 0.5% |
Roanoke city: 20 precincts
| Precinct | Population | Voting-age pop. | % White non-Hisp. | % Hispanic | % Black | % Asian | Median income* | % Bachelor's+ | % 18-29 (of adults) | % 65+ | % Homeowners | % Below poverty | % Spanish at home (adults) |
|---|---|---|---|---|---|---|---|---|---|---|---|---|---|
| Crystal Spring | 4,451 | 3,812 | 85.1% | 3.6% | 5.6% | 2.5% | $80k | 48.7% | 16.2% | 22.4% | 44.4% | 10.5% | 1.7% |
| Deyerle | 3,161 | 2,761 | 90.4% | 4.3% | 0.9% | 1.1% | $84k | 51.7% | 7.7% | 44.0% | 76.7% | 3.9% | 0.9% |
| East Gate | 5,198 | 4,072 | 73.7% | 2.3% | 16.6% | 1.7% | $63k | 21.7% | 23.2% | 19.7% | 68.2% | 17.4% | 2.7% |
| Eureka Park | 5,822 | 4,316 | 18.4% | 12.5% | 65.9% | 0.1% | $46k | 18.1% | 21.4% | 18.4% | 58.7% | 30.0% | 8.0% |
| Forest Park | 6,826 | 4,833 | 24.2% | 3.2% | 59.6% | 10.0% | $31k | 13.1% | 20.6% | 15.3% | 36.6% | 30.6% | 1.7% |
| Garden City | 3,706 | 3,033 | 80.0% | 3.3% | 10.3% | 0.0% | $60k | 23.9% | 23.3% | 16.5% | 72.4% | 15.7% | 1.2% |
| Grandin Court | 3,656 | 2,924 | 89.2% | 2.2% | 3.6% | 2.9% | $72k | 60.7% | 17.4% | 21.8% | 68.1% | 9.9% | 2.4% |
| Grandview | 3,874 | 3,051 | 29.9% | 11.1% | 50.3% | 2.5% | $51k | 17.6% | 24.5% | 15.0% | 44.7% | 18.5% | 6.9% |
| Highland | 5,687 | 4,467 | 54.9% | 7.1% | 23.7% | 5.1% | $53k | 36.8% | 28.9% | 8.4% | 15.0% | 23.0% | 3.8% |
| Hollins Road | 5,979 | 4,507 | 53.0% | 8.8% | 27.8% | 3.1% | $56k | 24.3% | 19.9% | 13.0% | 41.1% | 14.5% | 7.8% |
| Lee Hi | 5,048 | 3,884 | 75.5% | 8.0% | 10.6% | 3.8% | $67k | 45.3% | 19.8% | 18.1% | 60.8% | 8.7% | 2.4% |
| Lincoln Terrace | 5,290 | 3,662 | 15.2% | 5.7% | 73.0% | 0.1% | $44k | 11.0% | 22.9% | 19.6% | 32.5% | 25.3% | 4.3% |
| Old Southwest-Wasena | 5,921 | 4,374 | 70.2% | 7.6% | 13.7% | 1.2% | $55k | 40.9% | 16.4% | 10.6% | 47.7% | 17.7% | 4.3% |
| Peters Creek | 5,514 | 4,311 | 29.9% | 14.5% | 49.3% | 3.9% | $66k | 27.7% | 20.3% | 19.6% | 54.6% | 17.2% | 12.6% |
| Preston Park | 6,387 | 4,727 | 47.9% | 25.7% | 13.1% | 10.2% | $50k | 22.4% | 18.9% | 16.6% | 57.0% | 32.4% | 16.8% |
| Raleigh Court | 4,529 | 3,518 | 81.3% | 3.2% | 7.7% | 2.5% | $78k | 49.4% | 11.6% | 19.4% | 65.8% | 6.9% | 0.6% |
| South Roanoke | 3,158 | 2,661 | 81.9% | 8.5% | 1.6% | 2.9% | $105k | 57.7% | 11.5% | 30.6% | 75.6% | 8.9% | 4.6% |
| Southeast | 5,604 | 4,336 | 65.1% | 7.1% | 20.0% | 0.2% | $55k | 10.3% | 16.2% | 13.9% | 45.8% | 14.5% | 4.0% |
| Summit Hills | 3,184 | 2,568 | 48.9% | 9.7% | 39.2% | 0.4% | $70k | 19.6% | 16.9% | 19.3% | 84.9% | 17.1% | 5.9% |
| Williamson Road | 4,827 | 3,896 | 45.8% | 23.2% | 19.9% | 3.6% | $47k | 17.8% | 21.7% | 12.2% | 46.5% | 19.6% | 16.0% |
Frederick County: 29 precincts
| Precinct | Population | Voting-age pop. | % White non-Hisp. | % Hispanic | % Black | % Asian | Median income* | % Bachelor's+ | % 18-29 (of adults) | % 65+ | % Homeowners | % Below poverty | % Spanish at home (adults) |
|---|---|---|---|---|---|---|---|---|---|---|---|---|---|
| Albin | 2,941 | 2,398 | 88.0% | 9.0% | 0.5% | 0.1% | $112k | 31.0% | 6.2% | 24.1% | 92.9% | 2.2% | 4.7% |
| Armel | 2,700 | 2,110 | 77.0% | 4.3% | 9.4% | 1.6% | $114k | 35.8% | 14.9% | 19.0% | 90.3% | 6.0% | 3.4% |
| Ash Hollow | 5,242 | 3,918 | 73.6% | 10.6% | 9.5% | 0.7% | $91k | 24.5% | 24.2% | 13.9% | 59.7% | 8.3% | 5.6% |
| Aylor | 2,214 | 1,588 | 78.1% | 13.3% | 4.2% | 1.2% | $157k | 54.7% | 12.1% | 14.0% | 96.1% | 1.0% | 0.9% |
| Bass-Hoover | 4,544 | 3,529 | 72.6% | 13.9% | 9.9% | 0.2% | $80k | 15.6% | 22.2% | 13.9% | 72.5% | 8.9% | 5.9% |
| Canterburg | 2,932 | 2,493 | 73.4% | 19.2% | 2.2% | 4.6% | $115k | 41.5% | 11.8% | 33.9% | 89.2% | 6.6% | 7.4% |
| Carpers Valley | 780 | 714 | 86.0% | 0.2% | 12.0% | 0.3% | $87k | 30.0% | 18.3% | 22.5% | 88.4% | 11.9% | 0.1% |
| Cedar Creek | 3,018 | 2,330 | 79.2% | 16.1% | 1.2% | 0.8% | $91k | 27.0% | 16.7% | 13.8% | 75.6% | 7.8% | 13.2% |
| Clear Brook | 4,948 | 3,790 | 87.1% | 6.1% | 2.1% | 2.8% | $97k | 36.0% | 25.8% | 15.1% | 85.1% | 4.9% | 4.2% |
| Gainesborough | 2,571 | 2,060 | 92.1% | 4.3% | 0.4% | 0.0% | $109k | 32.4% | 12.6% | 14.9% | 93.3% | 1.8% | 4.4% |
| Gibson School | 3,358 | 2,662 | 52.0% | 32.3% | 12.3% | 1.4% | $55k | 7.3% | 29.1% | 6.2% | 71.7% | 19.6% | 24.1% |
| Gore | 5,319 | 3,988 | 90.8% | 1.8% | 1.6% | 1.0% | $90k | 22.9% | 18.8% | 12.5% | 88.5% | 8.8% | 1.5% |
| Greenwood | 4,499 | 3,258 | 87.3% | 4.2% | 3.8% | 2.7% | $141k | 39.2% | 17.8% | 10.9% | 95.4% | 5.1% | 3.5% |
| Jordan Springs | 3,420 | 2,602 | 68.4% | 13.4% | 6.0% | 9.8% | $106k | 54.7% | 16.6% | 14.7% | 78.9% | 4.3% | 11.9% |
| Kernstown | 3,649 | 2,901 | 85.0% | 7.4% | 1.7% | 1.8% | $119k | 38.7% | 10.2% | 28.1% | 83.7% | 3.1% | 6.3% |
| Middletown | 129 | 99 | 85.8% | 9.6% | 1.6% | 0.8% | $67k | 27.9% | 15.9% | 16.9% | 70.0% | 10.8% | 8.6% |
| Millbrook | 3,755 | 2,903 | 75.0% | 19.9% | 2.9% | 1.0% | $87k | 20.4% | 17.9% | 18.3% | 77.5% | 12.6% | 11.4% |
| Nain | 2,901 | 2,553 | 85.7% | 2.7% | 2.1% | 0.6% | $113k | 25.1% | 7.5% | 45.9% | 66.5% | 6.0% | 3.2% |
| Neffs Town | 2,209 | 1,558 | 41.8% | 51.6% | 4.4% | 0.8% | $56k | 19.4% | 6.8% | 26.4% | 60.0% | 9.0% | 36.4% |
| Parkins Mill | 3,670 | 2,768 | 70.0% | 18.6% | 5.8% | 1.8% | $93k | 32.8% | 20.6% | 16.4% | 65.1% | 8.5% | 12.9% |
| Redland | 4,100 | 3,492 | 92.5% | 2.7% | 2.9% | 0.0% | $95k | 28.6% | 14.2% | 23.4% | 82.9% | 10.3% | 0.3% |
| Russells | 4,878 | 3,787 | 73.9% | 21.8% | 2.2% | 0.9% | $121k | 30.2% | 16.8% | 19.7% | 84.6% | 3.9% | 14.0% |
| Shenandoah | 5,361 | 3,756 | 74.1% | 11.2% | 2.8% | 5.6% | $119k | 49.8% | 17.6% | 16.6% | 79.2% | 6.5% | 4.5% |
| Stephens City | 1,024 | 845 | 77.7% | 8.5% | 10.5% | 0.9% | $76k | 28.4% | 20.4% | 16.2% | 56.0% | 5.3% | 8.8% |
| Sulphur Spring | 1,420 | 986 | 66.0% | 15.9% | 7.3% | 2.2% | $79k | 32.3% | 15.0% | 19.9% | 64.0% | 9.4% | 10.1% |
| Sunnyside | 2,565 | 2,207 | 72.4% | 14.3% | 4.2% | 3.3% | $105k | 43.4% | 18.8% | 31.0% | 64.4% | 8.2% | 13.1% |
| Vaucluse Spring | 5,436 | 4,148 | 73.5% | 12.9% | 2.7% | 3.0% | $118k | 32.0% | 14.6% | 16.8% | 83.0% | 6.8% | 9.5% |
| White Hall | 1,849 | 1,436 | 85.3% | 6.4% | 5.0% | 1.3% | $106k | 38.0% | 14.6% | 25.7% | 89.9% | 3.6% | 3.4% |
| White Oak School | 3,330 | 2,410 | 75.2% | 16.1% | 5.2% | 0.7% | $117k | 31.4% | 13.8% | 18.3% | 84.5% | 3.2% | 11.2% |
Rockingham County: 29 precincts
| Precinct | Population | Voting-age pop. | % White non-Hisp. | % Hispanic | % Black | % Asian | Median income* | % Bachelor's+ | % 18-29 (of adults) | % 65+ | % Homeowners | % Below poverty | % Spanish at home (adults) |
|---|---|---|---|---|---|---|---|---|---|---|---|---|---|
| Bergton | 561 | 449 | 97.4% | 2.3% | 0.0% | 0.0% | $51k | 5.6% | 12.5% | 34.4% | 76.1% | 20.0% | 0.0% |
| Broadway | 748 | 571 | 85.8% | 10.8% | 0.6% | 0.6% | $63k | 26.0% | 19.8% | 21.6% | 62.5% | 13.9% | 9.2% |
| Crossroads | 3,353 | 2,816 | 89.9% | 4.0% | 0.7% | 3.9% | $105k | 55.5% | 8.3% | 34.9% | 77.3% | 5.8% | 2.9% |
| Dayton | 679 | 524 | 71.6% | 20.8% | 2.1% | 1.3% | $82k | 37.8% | 15.9% | 20.7% | 73.4% | 4.3% | 11.3% |
| Deep Run | 2,945 | 2,289 | 89.4% | 4.8% | 1.3% | 0.1% | $79k | 16.2% | 18.7% | 22.6% | 84.1% | 11.8% | 4.2% |
| East Bridgewater | 3,507 | 3,081 | 81.8% | 7.0% | 6.3% | 1.5% | $78k | 54.0% | 45.6% | 21.5% | 56.7% | 2.4% | 4.8% |
| Edom | 6,577 | 4,809 | 78.7% | 16.0% | 2.1% | 1.6% | $76k | 32.7% | 17.1% | 16.1% | 76.1% | 16.2% | 13.2% |
| Elkton | 1,102 | 877 | 92.7% | 3.6% | 1.4% | 0.0% | $60k | 13.5% | 16.6% | 21.4% | 58.2% | 9.2% | 1.7% |
| Fulks Run | 2,275 | 1,748 | 93.1% | 4.0% | 0.2% | 0.0% | $60k | 15.7% | 18.9% | 20.1% | 87.2% | 15.9% | 1.4% |
| Grottoes | 1,065 | 823 | 79.0% | 9.0% | 2.0% | 0.0% | $86k | 17.7% | 26.4% | 15.3% | 83.4% | 10.6% | 4.4% |
| Keezletown | 1,781 | 1,294 | 83.3% | 9.7% | 2.9% | 0.1% | $79k | 19.7% | 24.9% | 14.7% | 77.3% | 8.6% | 4.3% |
| Lacey Spring | 4,920 | 3,899 | 88.0% | 8.8% | 0.2% | 0.2% | $68k | 18.4% | 17.9% | 19.2% | 68.0% | 10.2% | 8.6% |
| Lone Pine | 7,011 | 5,291 | 85.5% | 11.0% | 0.9% | 1.2% | $72k | 20.5% | 18.8% | 20.1% | 72.0% | 11.9% | 7.4% |
| Massanetta Springs | 5,026 | 3,970 | 73.8% | 9.7% | 7.5% | 0.9% | $99k | 49.4% | 29.9% | 12.5% | 57.5% | 15.9% | 4.1% |
| McGaheysville | 4,072 | 2,973 | 76.8% | 16.7% | 0.9% | 3.4% | $81k | 35.8% | 11.1% | 22.8% | 83.4% | 6.4% | 9.2% |
| Melrose | 1,689 | 1,228 | 84.9% | 9.8% | 3.7% | 0.0% | $75k | 19.2% | 23.5% | 16.4% | 78.9% | 3.4% | 4.8% |
| Montezuma | 4,004 | 3,188 | 84.7% | 8.9% | 3.5% | 0.5% | $101k | 33.8% | 24.2% | 18.5% | 80.5% | 4.2% | 6.5% |
| Mt Clinton | 4,513 | 3,262 | 88.5% | 3.4% | 2.2% | 0.8% | $89k | 29.3% | 11.8% | 16.3% | 77.6% | 8.5% | 3.7% |
| Mt Crawford | 103 | 81 | 82.9% | 12.1% | 1.6% | 0.0% | $88k | 30.7% | 22.1% | 17.8% | 64.6% | 8.2% | 5.7% |
| North River | 3,542 | 3,155 | 85.3% | 8.9% | 1.4% | 2.2% | $62k | 31.1% | 32.5% | 22.8% | 58.2% | 23.6% | 7.6% |
| Ottobine | 3,410 | 2,503 | 90.9% | 5.7% | 2.8% | 0.0% | $90k | 14.8% | 16.3% | 16.4% | 87.5% | 6.7% | 4.9% |
| Port Republic | 2,652 | 2,181 | 83.8% | 8.4% | 0.9% | 2.3% | $90k | 31.8% | 19.8% | 24.1% | 84.9% | 5.4% | 6.3% |
| Silver Lake | 6,025 | 4,623 | 75.5% | 18.1% | 1.2% | 1.5% | $79k | 34.7% | 13.8% | 21.7% | 73.9% | 7.7% | 12.3% |
| Singers Glen | 2,534 | 1,903 | 92.3% | 2.2% | 0.9% | 0.7% | $82k | 29.3% | 13.4% | 19.3% | 81.8% | 8.6% | 2.1% |
| South Fork | 2,500 | 2,041 | 85.1% | 8.0% | 5.4% | 0.3% | $76k | 17.6% | 11.5% | 19.4% | 77.4% | 5.3% | 6.0% |
| Stony Run | 3,103 | 2,620 | 83.3% | 12.7% | 2.1% | 0.5% | $94k | 46.4% | 12.7% | 21.4% | 89.6% | 5.0% | 12.3% |
| Swift Run | 5,439 | 4,227 | 89.7% | 4.5% | 2.3% | 0.5% | $71k | 11.9% | 15.7% | 21.3% | 79.9% | 7.5% | 1.4% |
| Timberville | 270 | 202 | 85.0% | 11.2% | 0.5% | 1.1% | $75k | 14.7% | 19.3% | 15.1% | 67.8% | 12.4% | 8.5% |
| West Bridgewater | 1,097 | 756 | 84.9% | 7.1% | 0.0% | 0.1% | $73k | 30.7% | 6.9% | 19.9% | 62.4% | 11.5% | 2.1% |
Augusta County: 28 precincts
| Precinct | Population | Voting-age pop. | % White non-Hisp. | % Hispanic | % Black | % Asian | Median income* | % Bachelor's+ | % 18-29 (of adults) | % 65+ | % Homeowners | % Below poverty | % Spanish at home (adults) |
|---|---|---|---|---|---|---|---|---|---|---|---|---|---|
| Buffalo Gap | 2,226 | 1,767 | 92.9% | 2.4% | 1.1% | 0.0% | $69k | 28.5% | 9.3% | 25.6% | 83.5% | 5.5% | 1.9% |
| Cedar Green | 2,590 | 2,142 | 86.1% | 2.5% | 4.3% | 0.0% | $96k | 23.8% | 23.9% | 19.6% | 90.8% | 5.1% | 2.0% |
| Churchville Elem. | 3,196 | 2,870 | 92.7% | 0.8% | 4.1% | 0.5% | $102k | 27.4% | 16.5% | 27.6% | 83.1% | 2.6% | 0.3% |
| Craigsville | 3,072 | 2,646 | 69.8% | 4.6% | 24.1% | 0.2% | $47k | 6.1% | 15.8% | 15.5% | 58.0% | 18.9% | 3.9% |
| Crimora | 4,971 | 4,077 | 94.9% | 0.8% | 1.6% | 0.0% | $83k | 9.1% | 12.4% | 19.9% | 86.5% | 5.0% | 0.1% |
| Deerfield | 594 | 578 | 99.9% | 0.0% | 0.0% | 0.0% | $74k | 26.2% | 29.7% | 21.6% | 95.9% | 2.5% | 0.0% |
| Dooms | 2,240 | 1,858 | 79.8% | 16.0% | 0.6% | 0.0% | $105k | 26.2% | 17.9% | 24.4% | 91.8% | 3.0% | 0.2% |
| Fishersville | 3,983 | 3,419 | 88.7% | 4.3% | 3.1% | 0.1% | $90k | 41.1% | 14.0% | 27.1% | 70.9% | 7.7% | 0.6% |
| Fort Defiance | 1,871 | 1,555 | 86.4% | 5.2% | 0.1% | 1.6% | $90k | 31.6% | 26.3% | 21.7% | 81.5% | 4.9% | 1.8% |
| Goose Creek | 1,956 | 1,513 | 74.7% | 19.2% | 3.1% | 0.2% | $113k | 36.9% | 11.2% | 32.5% | 88.7% | 20.9% | 9.8% |
| Greenville | 2,753 | 2,196 | 93.4% | 1.6% | 2.8% | 0.2% | $56k | 21.7% | 9.5% | 20.6% | 74.6% | 8.3% | 1.2% |
| Jolivue | 2,259 | 1,995 | 95.6% | 0.5% | 1.6% | 0.0% | $60k | 32.9% | 21.5% | 30.0% | 64.7% | 6.7% | 0.3% |
| Ladd | 1,198 | 962 | 86.2% | 1.0% | 0.7% | 2.3% | $106k | 36.2% | 18.0% | 23.8% | 88.2% | 5.6% | 0.2% |
| Lyndhurst | 1,709 | 1,478 | 92.5% | 1.4% | 0.8% | 1.3% | $69k | 23.2% | 8.7% | 40.3% | 70.4% | 4.8% | 0.1% |
| Middlebrook | 1,309 | 1,133 | 95.6% | 1.6% | 0.8% | 0.2% | $69k | 33.3% | 8.5% | 30.5% | 92.5% | 9.3% | 1.3% |
| Mount Solon | 2,170 | 1,717 | 91.2% | 6.2% | 2.0% | 0.0% | $85k | 19.6% | 17.0% | 14.9% | 79.7% | 4.8% | 7.5% |
| Mount Vernon | 2,540 | 1,921 | 70.4% | 18.3% | 8.3% | 0.0% | $66k | 21.3% | 5.4% | 27.3% | 82.8% | 7.5% | 11.7% |
| New Hope | 2,003 | 1,611 | 91.8% | 4.5% | 0.1% | 1.3% | $86k | 25.9% | 10.9% | 23.4% | 83.9% | 1.9% | 3.0% |
| North River | 2,980 | 2,356 | 88.1% | 3.8% | 3.7% | 0.1% | $95k | 25.1% | 17.5% | 24.0% | 88.8% | 2.3% | 2.7% |
| Ridgeview | 4,201 | 3,421 | 93.3% | 0.1% | 2.8% | 0.0% | $98k | 21.9% | 14.0% | 22.4% | 93.2% | 3.4% | 0.2% |
| Rolla | 3,786 | 3,278 | 91.7% | 1.7% | 3.9% | 0.8% | $105k | 30.7% | 20.1% | 24.7% | 84.2% | 3.9% | 1.9% |
| Sherando | 2,600 | 2,139 | 93.7% | 1.6% | 1.2% | 0.3% | $97k | 18.9% | 20.7% | 18.9% | 93.5% | 3.8% | 1.1% |
| Spottswood | 1,706 | 1,405 | 95.2% | 0.0% | 1.9% | 0.5% | $65k | 21.5% | 9.9% | 33.2% | 97.2% | 10.8% | 0.0% |
| Stuarts Draft Elem. | 1,697 | 1,549 | 89.9% | 1.6% | 1.4% | 0.6% | $82k | 18.4% | 25.5% | 17.2% | 48.4% | 13.3% | 1.8% |
| Verona | 4,143 | 3,162 | 89.7% | 1.4% | 5.0% | 0.7% | $80k | 22.4% | 16.2% | 19.5% | 80.3% | 4.3% | 1.1% |
| Weyers Cave | 5,189 | 4,073 | 78.0% | 8.9% | 5.4% | 0.4% | $96k | 30.5% | 20.9% | 15.9% | 81.7% | 3.1% | 4.0% |
| White Hill | 4,817 | 3,443 | 94.0% | 1.3% | 2.8% | 0.8% | $64k | 30.2% | 10.9% | 19.0% | 77.3% | 9.3% | 0.8% |
| Wilson | 4,452 | 3,557 | 79.3% | 4.8% | 13.2% | 1.0% | $72k | 24.9% | 20.4% | 19.0% | 57.0% | 15.8% | 1.9% |
Roanoke County: 18 precincts
| Precinct | Population | Voting-age pop. | % White non-Hisp. | % Hispanic | % Black | % Asian | Median income* | % Bachelor's+ | % 18-29 (of adults) | % 65+ | % Homeowners | % Below poverty | % Spanish at home (adults) |
|---|---|---|---|---|---|---|---|---|---|---|---|---|---|
| Bonsack | 1,561 | 1,241 | 95.0% | 0.2% | 2.8% | 0.2% | $73k | 40.4% | 12.5% | 26.4% | 95.2% | 16.6% | 0.4% |
| Burlington | 2,657 | 2,081 | 65.0% | 5.7% | 19.6% | 3.4% | $63k | 23.3% | 18.6% | 17.7% | 43.2% | 20.1% | 2.6% |
| Catawba | 3,681 | 2,865 | 89.4% | 6.1% | 3.4% | 0.3% | $93k | 27.8% | 12.5% | 21.0% | 90.5% | 6.4% | 0.6% |
| Clearbrook | 2,422 | 2,003 | 82.0% | 1.5% | 16.1% | 0.1% | $43k | 35.7% | 10.2% | 28.3% | 68.3% | 10.2% | 1.5% |
| Green Ridge | 2,623 | 2,182 | 70.0% | 7.6% | 15.0% | 6.0% | $103k | 30.4% | 18.9% | 23.0% | 74.4% | 8.8% | 4.5% |
| Hanging Rock | 2,560 | 2,044 | 83.4% | 2.3% | 9.5% | 2.4% | $86k | 36.8% | 21.5% | 18.8% | 76.6% | 5.8% | 1.7% |
| Hollins | 3,474 | 2,797 | 73.3% | 6.3% | 8.2% | 8.7% | $98k | 29.3% | 26.6% | 19.4% | 72.8% | 6.6% | 5.6% |
| Mount Pleasant | 3,745 | 3,442 | 92.0% | 4.3% | 0.6% | 0.5% | $69k | 20.9% | 18.1% | 28.2% | 90.0% | 7.4% | 3.4% |
| Mountain View | 4,641 | 3,980 | 78.0% | 2.1% | 15.1% | 1.0% | $91k | 37.9% | 16.5% | 26.1% | 92.5% | 1.9% | 1.5% |
| North Glenvar | 3,932 | 3,305 | 83.4% | 6.4% | 5.4% | 0.5% | $105k | 26.8% | 14.8% | 25.0% | 88.0% | 11.8% | 3.7% |
| North Lindenwood | 2,885 | 1,990 | 84.2% | 1.5% | 7.3% | 2.1% | $87k | 40.3% | 12.7% | 14.1% | 85.8% | 7.3% | 1.5% |
| North Vinton | 3,815 | 2,980 | 91.8% | 1.4% | 2.1% | 0.9% | $75k | 22.3% | 19.0% | 15.6% | 63.0% | 7.9% | 0.1% |
| Northside | 3,653 | 3,132 | 69.2% | 3.8% | 21.6% | 1.1% | $88k | 33.4% | 20.4% | 25.5% | 80.8% | 5.1% | 1.8% |
| Orchards | 2,938 | 2,462 | 89.6% | 1.2% | 6.2% | 1.8% | $80k | 51.8% | 11.1% | 30.8% | 74.2% | 7.6% | 0.3% |
| Plantation | 4,080 | 3,211 | 79.6% | 1.0% | 7.8% | 6.6% | $55k | 17.0% | 14.8% | 31.8% | 46.3% | 7.7% | 0.9% |
| Richfield | 2,123 | 1,719 | 77.8% | 3.7% | 14.4% | 0.2% | $93k | 22.2% | 13.4% | 24.4% | 88.8% | 7.5% | 1.8% |
| South Lindenwood | 2,329 | 1,795 | 86.4% | 0.3% | 8.9% | 4.1% | $71k | 29.5% | 9.3% | 31.9% | 93.2% | 11.5% | 0.1% |
| South Vinton | 4,230 | 3,100 | 88.5% | 5.3% | 1.9% | 1.2% | $56k | 14.9% | 25.8% | 21.1% | 53.7% | 12.9% | 3.3% |
Harrisonburg city: 8 precincts
| Precinct | Population | Voting-age pop. | % White non-Hisp. | % Hispanic | % Black | % Asian | Median income* | % Bachelor's+ | % 18-29 (of adults) | % 65+ | % Homeowners | % Below poverty | % Spanish at home (adults) |
|---|---|---|---|---|---|---|---|---|---|---|---|---|---|
| East | 4,908 | 4,501 | 66.4% | 18.9% | 5.4% | 5.6% | $71k | 40.6% | 65.7% | 6.2% | 28.6% | 40.6% | 12.5% |
| East Central | 6,898 | 5,303 | 50.0% | 35.4% | 9.3% | 1.3% | $88k | 40.3% | 34.1% | 11.1% | 42.4% | 19.5% | 29.0% |
| Northeast | 6,912 | 5,119 | 46.6% | 31.2% | 12.5% | 5.3% | $64k | 26.5% | 26.0% | 8.3% | 36.8% | 21.5% | 20.8% |
| Northwest | 6,805 | 5,607 | 56.6% | 35.7% | 2.9% | 1.7% | $63k | 33.8% | 22.8% | 26.3% | 43.1% | 17.1% | 29.4% |
| South East Central | 5,749 | 5,532 | 72.7% | 6.8% | 8.0% | 6.0% | $56k | 60.4% | 96.1% | 0.7% | 26.2% | 59.6% | 4.7% |
| Southeast | 7,140 | 6,254 | 69.5% | 13.1% | 5.7% | 5.1% | $58k | 41.9% | 65.2% | 4.1% | 24.2% | 46.2% | 8.3% |
| Southwest | 6,074 | 4,730 | 61.7% | 25.5% | 4.6% | 1.5% | $69k | 34.5% | 37.3% | 9.7% | 44.3% | 21.6% | 22.8% |
| West | 5,624 | 4,466 | 67.1% | 18.2% | 8.7% | 2.5% | $88k | 46.5% | 25.0% | 15.1% | 59.5% | 8.5% | 15.4% |
Shenandoah County: 14 precincts
| Precinct | Population | Voting-age pop. | % White non-Hisp. | % Hispanic | % Black | % Asian | Median income* | % Bachelor's+ | % 18-29 (of adults) | % 65+ | % Homeowners | % Below poverty | % Spanish at home (adults) |
|---|---|---|---|---|---|---|---|---|---|---|---|---|---|
| Cedar Creek | 1,328 | 1,100 | 93.0% | 3.3% | 0.0% | 1.5% | $64k | 19.3% | 19.3% | 24.8% | 83.9% | 12.7% | 3.2% |
| Conicville | 4,160 | 3,349 | 85.2% | 5.4% | 2.5% | 1.0% | $61k | 22.3% | 15.6% | 23.7% | 80.6% | 15.5% | 3.2% |
| Edinburg | 3,289 | 2,588 | 77.3% | 14.2% | 4.2% | 0.6% | $73k | 23.2% | 22.8% | 18.4% | 69.3% | 16.4% | 11.1% |
| Fort Valley | 1,526 | 1,165 | 94.9% | 2.5% | 0.0% | 0.0% | $89k | 32.4% | 10.3% | 27.9% | 77.3% | 11.5% | 1.5% |
| Lebanon Church | 3,812 | 2,983 | 92.3% | 1.9% | 0.1% | 1.4% | $66k | 22.9% | 14.0% | 22.9% | 83.3% | 7.5% | 1.7% |
| Mount Jackson | 3,875 | 2,961 | 75.1% | 22.1% | 1.0% | 0.7% | $56k | 12.4% | 17.1% | 24.4% | 73.3% | 14.9% | 13.1% |
| New Market | 5,454 | 4,647 | 91.1% | 5.6% | 1.7% | 0.3% | $74k | 24.0% | 15.8% | 30.0% | 68.4% | 7.9% | 5.6% |
| Orkney Springs | 1,768 | 1,529 | 94.1% | 0.0% | 2.2% | 0.3% | $84k | 29.8% | 10.4% | 37.0% | 94.3% | 7.2% | 0.4% |
| Saint Luke | 3,069 | 2,503 | 87.6% | 6.8% | 1.3% | 1.3% | $64k | 23.7% | 12.6% | 22.9% | 76.2% | 9.3% | 6.0% |
| Strasburg East | 3,314 | 2,532 | 82.3% | 6.4% | 6.7% | 0.7% | $65k | 16.8% | 19.5% | 14.3% | 74.1% | 6.1% | 2.6% |
| Strasburg West | 2,880 | 2,192 | 84.3% | 4.6% | 6.2% | 0.8% | $66k | 17.0% | 19.1% | 16.8% | 70.2% | 8.5% | 1.6% |
| Toms Brook | 3,157 | 2,588 | 88.5% | 5.0% | 1.8% | 1.7% | $79k | 19.8% | 14.5% | 22.8% | 89.5% | 8.2% | 5.0% |
| Woodstock North | 4,170 | 2,974 | 78.7% | 14.2% | 2.7% | 3.2% | $84k | 20.6% | 13.7% | 13.9% | 61.2% | 18.7% | 11.8% |
| Woodstock South | 3,073 | 2,277 | 61.6% | 25.8% | 9.2% | 3.0% | $59k | 24.5% | 22.3% | 21.2% | 40.5% | 19.4% | 20.3% |
Warren County: 11 precincts
| Precinct | Population | Voting-age pop. | % White non-Hisp. | % Hispanic | % Black | % Asian | Median income* | % Bachelor's+ | % 18-29 (of adults) | % 65+ | % Homeowners | % Below poverty | % Spanish at home (adults) |
|---|---|---|---|---|---|---|---|---|---|---|---|---|---|
| Bentonville | 1,765 | 1,357 | 96.7% | 1.2% | 0.0% | 1.0% | $86k | 25.7% | 10.5% | 23.3% | 94.8% | 6.8% | 0.0% |
| Browntown | 1,704 | 1,529 | 95.7% | 2.2% | 0.0% | 1.1% | $109k | 24.4% | 15.8% | 24.9% | 79.6% | 5.9% | 0.9% |
| East Shenandoah | 5,583 | 4,162 | 83.5% | 10.7% | 1.7% | 1.2% | $84k | 23.7% | 22.7% | 8.4% | 83.1% | 21.2% | 7.1% |
| Fork Town | 3,882 | 2,896 | 77.7% | 6.6% | 11.4% | 0.1% | $72k | 20.7% | 13.9% | 16.4% | 52.9% | 9.5% | 2.9% |
| Happy Creek | 4,481 | 3,533 | 81.4% | 7.3% | 3.8% | 4.1% | $95k | 26.6% | 23.8% | 15.4% | 76.5% | 11.7% | 4.9% |
| Linden | 3,860 | 3,064 | 76.3% | 11.3% | 2.7% | 1.5% | $120k | 39.8% | 10.1% | 16.0% | 85.4% | 3.3% | 5.7% |
| North River | 3,882 | 3,087 | 63.0% | 18.0% | 10.3% | 1.2% | $73k | 11.6% | 20.0% | 15.8% | 66.4% | 9.9% | 12.1% |
| Otterburn | 4,784 | 3,986 | 93.5% | 0.1% | 3.2% | 1.5% | $81k | 27.8% | 13.0% | 24.3% | 86.8% | 5.4% | 0.0% |
| Riverton | 4,836 | 3,554 | 84.7% | 2.0% | 6.6% | 0.3% | $128k | 28.8% | 16.0% | 19.8% | 88.4% | 14.8% | 1.4% |
| South River | 4,118 | 3,279 | 72.1% | 11.1% | 8.4% | 0.6% | $68k | 19.9% | 15.3% | 18.3% | 56.1% | 18.9% | 6.1% |
| Town - West Shenandoah | 2,586 | 2,077 | 83.1% | 5.3% | 2.5% | 1.9% | $104k | 23.3% | 24.9% | 16.4% | 76.2% | 10.5% | 2.7% |
Botetourt County: 10 precincts
| Precinct | Population | Voting-age pop. | % White non-Hisp. | % Hispanic | % Black | % Asian | Median income* | % Bachelor's+ | % 18-29 (of adults) | % 65+ | % Homeowners | % Below poverty | % Spanish at home (adults) |
|---|---|---|---|---|---|---|---|---|---|---|---|---|---|
| Blue Ridge | 3,238 | 2,529 | 85.0% | 3.8% | 2.8% | 2.0% | $85k | 27.7% | 15.3% | 19.7% | 93.8% | 2.8% | 1.2% |
| Buchanan | 2,888 | 2,368 | 92.9% | 2.5% | 1.5% | 0.2% | $59k | 17.0% | 14.9% | 26.2% | 89.3% | 17.5% | 0.7% |
| Cloverdale | 3,081 | 2,687 | 87.9% | 0.4% | 5.7% | 1.6% | $80k | 35.7% | 12.8% | 29.4% | 76.5% | 6.3% | 0.0% |
| Daleville | 2,246 | 1,906 | 87.4% | 5.7% | 2.8% | 0.8% | $107k | 29.7% | 13.8% | 25.6% | 88.7% | 4.1% | 4.7% |
| Eagle Rock | 1,832 | 1,589 | 90.0% | 3.2% | 5.6% | 0.0% | $52k | 10.1% | 12.4% | 24.7% | 92.4% | 9.4% | 0.3% |
| Fincastle | 4,898 | 3,916 | 91.4% | 1.1% | 2.3% | 0.6% | $85k | 31.8% | 14.2% | 26.1% | 89.5% | 7.0% | 1.1% |
| Greenfield | 5,201 | 4,216 | 91.1% | 1.4% | 1.0% | 1.1% | $97k | 37.3% | 13.7% | 29.1% | 78.3% | 4.9% | 0.7% |
| Mill Creek | 4,190 | 3,413 | 89.8% | 4.7% | 3.2% | 0.4% | $80k | 25.0% | 13.1% | 20.6% | 80.6% | 5.3% | 3.9% |
| Rainbow Forest | 3,421 | 2,609 | 92.1% | 3.1% | 1.4% | 0.0% | $81k | 30.7% | 13.5% | 22.3% | 92.9% | 3.2% | 4.2% |
| Troutville | 2,969 | 2,414 | 95.5% | 0.8% | 1.5% | 0.3% | $78k | 26.1% | 16.4% | 17.5% | 80.8% | 3.9% | 0.0% |
Winchester city: 6 precincts
| Precinct | Population | Voting-age pop. | % White non-Hisp. | % Hispanic | % Black | % Asian | Median income* | % Bachelor's+ | % 18-29 (of adults) | % 65+ | % Homeowners | % Below poverty | % Spanish at home (adults) |
|---|---|---|---|---|---|---|---|---|---|---|---|---|---|
| Frederick Douglass | 3,256 | 2,319 | 59.5% | 23.0% | 13.5% | 0.0% | $55k | 17.3% | 20.7% | 10.7% | 20.1% | 22.6% | 16.6% |
| Merrimans | 3,813 | 3,223 | 74.4% | 11.3% | 3.5% | 3.0% | $100k | 61.2% | 19.4% | 22.3% | 61.1% | 9.7% | 6.4% |
| Old Town | 2,575 | 2,185 | 76.1% | 7.7% | 1.8% | 4.6% | $79k | 40.6% | 18.6% | 27.6% | 55.1% | 16.0% | 5.2% |
| Rolling Hills | 3,524 | 2,738 | 68.2% | 20.0% | 1.9% | 5.2% | $99k | 44.3% | 21.4% | 17.6% | 49.5% | 20.7% | 12.4% |
| Virginia Avenue | 7,893 | 5,539 | 52.0% | 27.7% | 11.1% | 1.7% | $63k | 18.0% | 21.0% | 13.2% | 34.6% | 35.4% | 18.3% |
| War Memorial | 6,455 | 5,330 | 56.7% | 22.9% | 9.1% | 0.4% | $67k | 20.4% | 34.1% | 15.3% | 45.6% | 13.5% | 15.7% |
Staunton city: 5 precincts
| Precinct | Population | Voting-age pop. | % White non-Hisp. | % Hispanic | % Black | % Asian | Median income* | % Bachelor's+ | % 18-29 (of adults) | % 65+ | % Homeowners | % Below poverty | % Spanish at home (adults) |
|---|---|---|---|---|---|---|---|---|---|---|---|---|---|
| Ward 1 | 6,624 | 5,176 | 72.8% | 6.0% | 15.4% | 0.8% | $59k | 29.7% | 22.2% | 13.7% | 49.3% | 14.8% | 3.4% |
| Ward 2 | 4,813 | 3,982 | 79.6% | 0.4% | 11.0% | 3.4% | $69k | 32.4% | 10.9% | 25.6% | 70.4% | 14.3% | 0.2% |
| Ward 3 | 4,301 | 3,491 | 80.1% | 3.6% | 5.8% | 1.8% | $61k | 33.0% | 16.1% | 24.5% | 73.4% | 8.5% | 1.5% |
| Ward 4 | 3,835 | 2,781 | 86.9% | 5.6% | 3.7% | 0.1% | $80k | 53.9% | 15.7% | 28.7% | 61.7% | 9.6% | 6.7% |
| Ward 5 | 5,988 | 5,185 | 76.1% | 7.4% | 11.6% | 1.1% | $80k | 45.1% | 28.1% | 18.9% | 53.4% | 13.7% | 5.1% |
Salem city: 10 precincts
| Precinct | Population | Voting-age pop. | % White non-Hisp. | % Hispanic | % Black | % Asian | Median income* | % Bachelor's+ | % 18-29 (of adults) | % 65+ | % Homeowners | % Below poverty | % Spanish at home (adults) |
|---|---|---|---|---|---|---|---|---|---|---|---|---|---|
| Beverly Heights | 1,264 | 818 | 92.6% | 0.0% | 1.3% | 0.0% | $76k | 23.7% | 10.6% | 15.5% | 86.8% | 8.3% | 0.0% |
| Conehurst | 1,376 | 1,130 | 74.7% | 3.5% | 18.2% | 0.1% | $65k | 24.1% | 31.7% | 12.8% | 53.2% | 9.3% | 0.5% |
| East Salem | 2,296 | 1,912 | 63.9% | 13.8% | 12.5% | 7.0% | $50k | 15.4% | 26.1% | 26.2% | 39.7% | 11.0% | 6.7% |
| Hidden Valley | 2,925 | 2,371 | 86.1% | 3.5% | 2.5% | 4.2% | $71k | 44.1% | 16.8% | 25.9% | 54.3% | 14.4% | 1.4% |
| North Salem #1 | 4,147 | 3,192 | 73.0% | 5.5% | 14.8% | 2.1% | $68k | 31.7% | 17.9% | 14.8% | 60.9% | 12.8% | 2.4% |
| North Salem #2 | 3,588 | 3,185 | 85.5% | 2.3% | 10.2% | 0.7% | $95k | 46.0% | 48.0% | 16.1% | 82.4% | 9.5% | 1.7% |
| South Salem #1 | 2,188 | 1,745 | 74.0% | 5.6% | 17.0% | 1.6% | $67k | 29.1% | 22.3% | 17.5% | 46.0% | 12.2% | 2.9% |
| South Salem #2 | 1,945 | 1,424 | 86.6% | 7.2% | 2.5% | 0.5% | $68k | 25.3% | 18.0% | 10.4% | 67.1% | 6.8% | 3.0% |
| Southside Hills | 3,476 | 2,834 | 89.3% | 4.7% | 2.1% | 1.2% | $69k | 34.5% | 16.9% | 27.3% | 75.8% | 7.7% | 0.9% |
| West Salem | 1,789 | 1,546 | 92.6% | 0.0% | 6.3% | 0.5% | $101k | 45.0% | 14.6% | 26.8% | 75.2% | 5.9% | 0.5% |
Page County: 5 precincts
| Precinct | Population | Voting-age pop. | % White non-Hisp. | % Hispanic | % Black | % Asian | Median income* | % Bachelor's+ | % 18-29 (of adults) | % 65+ | % Homeowners | % Below poverty | % Spanish at home (adults) |
|---|---|---|---|---|---|---|---|---|---|---|---|---|---|
| East Luray | 4,232 | 3,596 | 90.7% | 1.1% | 2.2% | 0.7% | $55k | 21.1% | 15.5% | 27.0% | 68.3% | 11.3% | 1.6% |
| Marksville | 5,286 | 4,228 | 94.8% | 1.6% | 0.9% | 0.3% | $55k | 14.8% | 19.4% | 20.2% | 70.2% | 13.8% | 1.7% |
| Newport | 5,135 | 3,953 | 94.4% | 0.8% | 2.8% | 0.0% | $52k | 11.4% | 12.4% | 22.1% | 70.8% | 9.2% | 0.6% |
| Shenandoah | 5,160 | 4,020 | 89.1% | 6.7% | 0.9% | 0.0% | $70k | 7.9% | 21.5% | 14.3% | 72.6% | 12.4% | 4.9% |
| West Luray | 3,842 | 3,218 | 90.3% | 1.9% | 4.4% | 1.2% | $53k | 23.2% | 8.0% | 31.2% | 77.6% | 9.4% | 0.9% |
Rockbridge County: 14 precincts
| Precinct | Population | Voting-age pop. | % White non-Hisp. | % Hispanic | % Black | % Asian | Median income* | % Bachelor's+ | % 18-29 (of adults) | % 65+ | % Homeowners | % Below poverty | % Spanish at home (adults) |
|---|---|---|---|---|---|---|---|---|---|---|---|---|---|
| Airport | 2,064 | 1,681 | 92.1% | 2.7% | 0.9% | 2.0% | $81k | 47.8% | 12.1% | 32.1% | 78.5% | 2.7% | 1.8% |
| Collierstown | 1,576 | 1,182 | 91.2% | 3.8% | 0.8% | 2.6% | $101k | 54.2% | 10.9% | 30.7% | 76.6% | 1.8% | 1.8% |
| Effinger | 930 | 854 | 98.0% | 0.0% | 0.6% | 0.0% | $65k | 36.2% | 10.8% | 32.8% | 84.1% | 4.3% | 0.0% |
| Fairfield | 2,712 | 2,315 | 86.1% | 1.6% | 0.9% | 0.4% | $70k | 31.6% | 17.4% | 26.2% | 81.8% | 9.5% | 1.0% |
| Goshen | 1,401 | 1,223 | 93.7% | 0.6% | 0.0% | 0.3% | $52k | 24.2% | 11.9% | 28.8% | 89.4% | 12.1% | 0.0% |
| Highland Belle | 2,734 | 2,236 | 90.1% | 1.0% | 0.6% | 1.5% | $75k | 39.2% | 16.1% | 28.7% | 85.7% | 5.6% | 1.1% |
| Maury River | 2,362 | 1,788 | 70.0% | 9.9% | 9.3% | 0.1% | $68k | 21.4% | 14.3% | 16.5% | 78.7% | 10.2% | 5.3% |
| Meadowview | 1,721 | 1,407 | 83.5% | 1.2% | 10.8% | 0.4% | $67k | 28.6% | 16.7% | 21.4% | 57.8% | 3.8% | 0.9% |
| Mountain View | 2,148 | 1,753 | 94.7% | 1.4% | 0.6% | 1.9% | $51k | 35.2% | 20.3% | 19.3% | 72.6% | 10.2% | 1.6% |
| Natural Bridge Station | 1,933 | 1,626 | 91.8% | 2.0% | 2.1% | 0.4% | $55k | 15.2% | 19.5% | 31.3% | 77.7% | 11.6% | 2.2% |
| Plank Road | 809 | 714 | 97.5% | 0.2% | 0.8% | 0.0% | $47k | 31.5% | 8.5% | 40.4% | 72.0% | 14.3% | 0.3% |
| Rockbridge | 1,147 | 1,019 | 98.6% | 0.2% | 0.0% | 0.0% | $59k | 36.5% | 8.2% | 38.4% | 90.0% | 5.7% | 0.0% |
| Rockbridge Baths | 822 | 756 | 98.1% | 0.6% | 0.0% | 0.0% | $54k | 26.9% | 10.0% | 32.2% | 89.9% | 9.8% | 0.0% |
| Vo-Tech | 427 | 342 | 82.1% | 1.1% | 12.9% | 0.4% | $65k | 26.1% | 16.3% | 19.2% | 51.0% | 3.8% | 0.7% |
Waynesboro city: 4 precincts
| Precinct | Population | Voting-age pop. | % White non-Hisp. | % Hispanic | % Black | % Asian | Median income* | % Bachelor's+ | % 18-29 (of adults) | % 65+ | % Homeowners | % Below poverty | % Spanish at home (adults) |
|---|---|---|---|---|---|---|---|---|---|---|---|---|---|
| WARD A | 4,813 | 3,354 | 52.0% | 23.7% | 18.5% | 0.0% | $44k | 13.5% | 12.4% | 13.2% | 57.9% | 16.3% | 18.5% |
| WARD B | 7,377 | 5,952 | 77.1% | 6.2% | 10.8% | 0.2% | $67k | 39.5% | 20.3% | 19.7% | 57.2% | 7.4% | 4.3% |
| WARD C | 5,428 | 4,271 | 76.4% | 6.6% | 10.9% | 0.2% | $60k | 18.2% | 16.2% | 16.7% | 65.1% | 13.9% | 5.4% |
| WARD D | 5,023 | 4,018 | 78.0% | 4.1% | 3.6% | 7.7% | $88k | 24.3% | 24.4% | 21.2% | 60.4% | 8.9% | 0.3% |
Clarke County: 7 precincts
| Precinct | Population | Voting-age pop. | % White non-Hisp. | % Hispanic | % Black | % Asian | Median income* | % Bachelor's+ | % 18-29 (of adults) | % 65+ | % Homeowners | % Below poverty | % Spanish at home (adults) |
|---|---|---|---|---|---|---|---|---|---|---|---|---|---|
| Berryville | 1,593 | 1,249 | 74.1% | 7.8% | 10.5% | 1.2% | $99k | 33.4% | 15.4% | 21.7% | 68.2% | 11.0% | 9.3% |
| Blue Ridge | 415 | 344 | 93.4% | 4.3% | 0.0% | 0.0% | $96k | 38.8% | 6.7% | 32.7% | 92.7% | 0.1% | 0.0% |
| Buckmarsh | 2,072 | 1,568 | 81.8% | 6.7% | 3.8% | 2.1% | $86k | 40.5% | 10.4% | 21.4% | 73.4% | 9.6% | 8.4% |
| Millwood | 3,578 | 2,897 | 82.5% | 4.9% | 5.5% | 1.2% | $111k | 38.5% | 11.7% | 25.1% | 78.7% | 7.4% | 5.3% |
| Pine Grove | 1,302 | 1,083 | 92.8% | 4.0% | 0.0% | 0.3% | $96k | 39.1% | 6.8% | 32.3% | 92.4% | 0.5% | 0.2% |
| Russell | 3,412 | 2,757 | 81.5% | 14.8% | 2.1% | 0.2% | $157k | 43.8% | 23.4% | 15.7% | 86.7% | 7.7% | 8.0% |
| White Post | 2,897 | 2,374 | 80.1% | 5.9% | 10.3% | 0.6% | $100k | 40.5% | 10.9% | 25.2% | 85.4% | 5.8% | 5.3% |
Alleghany County: 12 precincts
| Precinct | Population | Voting-age pop. | % White non-Hisp. | % Hispanic | % Black | % Asian | Median income* | % Bachelor's+ | % 18-29 (of adults) | % 65+ | % Homeowners | % Below poverty | % Spanish at home (adults) |
|---|---|---|---|---|---|---|---|---|---|---|---|---|---|
| Arritt | 1,549 | 1,265 | 99.7% | 0.0% | 0.1% | 0.0% | $59k | 9.0% | 10.7% | 30.8% | 93.3% | 15.0% | 0.0% |
| Callaghan | 1,103 | 917 | 96.9% | 1.2% | 1.6% | 0.3% | $63k | 12.0% | 9.5% | 25.3% | 89.4% | 5.6% | 0.7% |
| Clifton Forge East | 1,871 | 1,535 | 85.5% | 1.2% | 10.0% | 0.1% | $57k | 22.2% | 17.9% | 28.3% | 82.2% | 11.3% | 0.6% |
| Clifton Forge West | 1,613 | 1,175 | 78.0% | 2.4% | 18.4% | 0.0% | $37k | 16.9% | 17.5% | 20.4% | 44.5% | 18.4% | 6.0% |
| Dameron | 653 | 543 | 96.2% | 0.0% | 2.5% | 0.0% | $66k | 8.2% | 6.8% | 27.3% | 77.3% | 12.7% | 0.0% |
| Dolly Ann | 770 | 642 | 92.3% | 0.8% | 6.4% | 0.0% | $50k | 15.2% | 15.4% | 23.7% | 72.1% | 12.8% | 0.1% |
| Griffith | 1,866 | 1,444 | 93.1% | 6.6% | 0.3% | 0.0% | $70k | 14.6% | 17.3% | 25.1% | 94.0% | 5.1% | 0.1% |
| Humpback Bridge | 703 | 596 | 94.0% | 1.0% | 3.4% | 0.4% | $64k | 9.6% | 8.8% | 27.3% | 88.0% | 12.8% | 0.7% |
| Iron Gate | 202 | 160 | 91.8% | 0.6% | 5.3% | 0.0% | $32k | 10.2% | 9.6% | 27.4% | 86.1% | 23.4% | 0.2% |
| Jackson Heights | 860 | 732 | 84.0% | 0.5% | 9.5% | 5.9% | $61k | 14.7% | 21.0% | 24.4% | 86.7% | 5.6% | 0.2% |
| Low Moor | 1,703 | 1,453 | 94.3% | 1.3% | 4.3% | 0.1% | $52k | 9.4% | 17.5% | 27.1% | 75.3% | 10.7% | 1.5% |
| Peters Switch | 2,152 | 1,793 | 89.7% | 0.4% | 2.1% | 0.0% | $65k | 20.3% | 21.2% | 26.7% | 91.2% | 15.4% | 0.1% |
Lexington city: 1 precincts
| Precinct | Population | Voting-age pop. | % White non-Hisp. | % Hispanic | % Black | % Asian | Median income* | % Bachelor's+ | % 18-29 (of adults) | % 65+ | % Homeowners | % Below poverty | % Spanish at home (adults) |
|---|---|---|---|---|---|---|---|---|---|---|---|---|---|
| Lexington | 7,260 | 6,739 | 78.6% | 6.1% | 5.6% | 3.5% | $90k | 51.3% | 56.8% | 16.9% | 54.5% | 13.8% | 6.0% |
Buena Vista city: 2 precincts
| Precinct | Population | Voting-age pop. | % White non-Hisp. | % Hispanic | % Black | % Asian | Median income* | % Bachelor's+ | % 18-29 (of adults) | % 65+ | % Homeowners | % Below poverty | % Spanish at home (adults) |
|---|---|---|---|---|---|---|---|---|---|---|---|---|---|
| First Ward | 3,380 | 2,366 | 83.3% | 0.0% | 1.8% | 0.7% | $63k | 21.5% | 21.5% | 18.5% | 64.3% | 12.6% | 0.0% |
| Second Ward | 3,119 | 2,705 | 86.3% | 0.5% | 2.3% | 1.2% | $43k | 25.2% | 34.1% | 19.0% | 49.1% | 26.6% | 0.0% |
Covington city: 5 precincts
| Precinct | Population | Voting-age pop. | % White non-Hisp. | % Hispanic | % Black | % Asian | Median income* | % Bachelor's+ | % 18-29 (of adults) | % 65+ | % Homeowners | % Below poverty | % Spanish at home (adults) |
|---|---|---|---|---|---|---|---|---|---|---|---|---|---|
| Precinct 1-1 | 826 | 733 | 69.4% | 7.5% | 13.0% | 3.9% | $52k | 12.1% | 22.9% | 19.7% | 62.4% | 15.3% | 7.3% |
| Precinct 2-1 | 1,622 | 1,195 | 73.6% | 0.8% | 19.2% | 0.9% | $31k | 7.7% | 13.2% | 18.9% | 72.1% | 40.0% | 0.8% |
| Precinct 3-1 | 571 | 469 | 75.2% | 2.4% | 19.2% | 2.7% | $62k | 17.1% | 18.1% | 22.3% | 79.4% | 15.6% | 3.1% |
| Precinct 4-1 | 1,396 | 1,045 | 84.4% | 4.3% | 9.1% | 0.7% | $48k | 9.7% | 18.1% | 20.7% | 72.2% | 20.4% | 2.6% |
| Precinct 5-1 | 1,111 | 805 | 90.3% | 3.6% | 4.3% | 0.0% | $40k | 5.0% | 19.9% | 18.7% | 65.5% | 24.8% | 1.7% |
Bath County: 7 precincts
| Precinct | Population | Voting-age pop. | % White non-Hisp. | % Hispanic | % Black | % Asian | Median income* | % Bachelor's+ | % 18-29 (of adults) | % 65+ | % Homeowners | % Below poverty | % Spanish at home (adults) |
|---|---|---|---|---|---|---|---|---|---|---|---|---|---|
| Burnsville | 162 | 138 | 94.1% | 0.4% | 2.1% | 0.0% | $47k | 17.1% | 10.7% | 27.9% | 74.4% | 16.7% | 0.5% |
| Fairview | 1,314 | 1,096 | 91.0% | 5.6% | 2.1% | 0.0% | $79k | 17.9% | 9.2% | 22.7% | 71.8% | 20.0% | 3.5% |
| Healing Springs | 470 | 394 | 96.9% | 0.2% | 2.2% | 0.3% | $81k | 20.2% | 22.9% | 18.1% | 70.2% | 16.4% | 0.0% |
| Hot Springs | 518 | 411 | 87.9% | 6.5% | 4.3% | 0.5% | $85k | 16.9% | 10.7% | 29.8% | 67.7% | 31.6% | 4.1% |
| Millboro | 516 | 444 | 94.7% | 0.1% | 4.5% | 0.0% | $45k | 12.9% | 7.5% | 27.2% | 75.1% | 22.4% | 0.1% |
| Mountain Grove | 627 | 503 | 90.7% | 0.4% | 5.6% | 0.7% | $42k | 14.6% | 12.4% | 38.5% | 70.0% | 33.2% | 0.2% |
| Warm Springs | 489 | 401 | 91.1% | 2.8% | 3.6% | 0.3% | $60k | 16.6% | 11.0% | 30.6% | 71.2% | 25.4% | 1.8% |
Highland County: 4 precincts
| Precinct | Population | Voting-age pop. | % White non-Hisp. | % Hispanic | % Black | % Asian | Median income* | % Bachelor's+ | % 18-29 (of adults) | % 65+ | % Homeowners | % Below poverty | % Spanish at home (adults) |
|---|---|---|---|---|---|---|---|---|---|---|---|---|---|
| Blue Grass | 524 | 453 | 95.6% | 0.0% | 0.0% | 3.0% | $69k | 32.8% | 13.8% | 36.2% | 86.7% | 11.5% | 0.7% |
| McDowell | 558 | 450 | 93.7% | 0.0% | 0.0% | 0.0% | $70k | 23.6% | 4.7% | 30.6% | 98.3% | 2.7% | 0.0% |
| Mill Gap | 332 | 274 | 97.3% | 0.0% | 0.0% | 1.6% | $75k | 29.2% | 6.7% | 36.6% | 92.6% | 9.7% | 1.1% |
| Monterey | 878 | 783 | 94.4% | 0.0% | 0.0% | 3.9% | $66k | 35.3% | 18.1% | 35.8% | 83.3% | 12.7% | 0.4% |
*Median income is approximate (see note above). ACS 2020-2024 5-year.
Nonpartisan voter information. GOTV Polling does not endorse any candidate.