
Wisconsin's 3rd Congressional District
U.S. House · Wisconsin · District 3 · General election: Tuesday, November 3, 2026
Candidates on the November 3 ballot
- Alexander Valiensi KentIndependent
- Rustin ProvanceIndependent
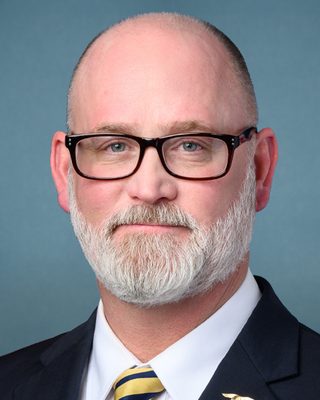 Derrick Van OrdenRepublicanPhoto: U.S. Congress
 Rebecca CookeDemocraticPhoto: cookeforwisconsin.com
Source: Wisconsin Elections Commission, Candidates on Ballot by Election, 2026 General Election, certified list (report printed 2026-08-25; retrieved 2026-10-30). Order of names does not reflect ballot order. Incumbent tags appear only where the official list marks incumbents. Photos come from the Candidate Alerts database where one is on file; otherwise initials are shown.
Federal campaign finance filings for this seat: FEC election page (FEC registration is not the same as ballot qualification).
Certified candidates
- Derrick Van Orden RepublicanIncumbent @RepVanOrden
- Rebecca Cooke Democratic @RebeccaForWI Website
- Alexander Valiensi Kent Independent Website
- Rustin Provance Independent Website
Certified candidate list from Candidate Alerts, as of 2026-09-24, based on Wisconsin Elections Commission. Includes candidates the database marks as on the November 3 ballot. Incumbent tags here follow the database.
Past election results
| Candidate | Party | Votes | Share |
|---|---|---|---|
| Derrick Van Orden | Republican | 212,064 | 51.4% |
| Rebecca Cooke | Democratic | 200,808 | 48.6% |
| Total | 412,872 |
Source: Wisconsin Elections Commission, official ward-by-ward canvass (combined file). Status: Official certified results, Wisconsin Elections Commission, certified Nov. 29, 2024
| Candidate | Party | Votes | Share |
|---|---|---|---|
| Derrick Van Orden | Republican | 164,743 | 51.9% |
| Brad Pfaff | Democratic | 152,977 | 48.1% |
| Total | 317,720 |
Source: Wisconsin Elections Commission, official ward-by-ward canvass (per-contest files). Status: Official certified results, Wisconsin Elections Commission, certified Nov. 30, 2022
Held under the district lines in effect at the time. Those boundaries differ from the 2026 district.
Partial coverage: totals include only the counties loaded from certified sources, so they are not the official district total.
| Candidate | Party | Votes | Share |
|---|---|---|---|
| Ron Kind | Democratic | 199,870 | 51.3% |
| Derrick Van Orden | Republican | 189,524 | 48.7% |
| Total | 389,394 |
Source: Wisconsin Elections Commission, official ward-by-ward canvass (per-contest files; President post-recount). Status: Official certified results, Wisconsin Elections Commission; President canvassed after the Dane/Milwaukee partial recount and certified Nov. 30, 2020; other contests certified Dec. 1, 2020
Certified results from state or county election authorities, as compiled in the Candidate Alerts precinct results database (public API candidatealerts.com/api/district-results). Totals are sums of certified precinct and county-level rows.
Demographics
2020 Census demographics by district are not yet published in this data set.
0 of 1,185 precincts are above 50%, and 5 are above 25%. Source: Census American Community Survey 2020-2024 5-year block groups, allocated to current precinct shapes by area. Area coverage is good for 85.1% of precincts; treat the rest as approximate.
Poll status
Map
Share of adults (18+) who speak Spanish at home, by precinct. Census ACS 2020-2024 5-year estimates on the current precinct layer. Hover a precinct for its value.
District shown in red: U.S. Census Bureau cartographic boundary file for the 119th Congress (cb_2024_us_cd119_500k). These are the lines in effect for 2026 in this state per the Candidate Alerts district registry.
Precinct map: past elections and demographics
Choose a layer above. Hover a precinct for its values.
Precinct results
Certified precinct results on current precinct shapes, grouped by county. 792 precincts. "(part)" marks a precinct only partly inside this district; its full vote is shown, so district sums are approximate and are not the official district total. Elections were held under older lines and are shown on the 2026 district.
| County | 2024 President | 2022 Governor | 2020 President | |||
|---|---|---|---|---|---|---|
| Margin | Votes | Margin | Votes | Margin | Votes | |
| La Crosse | D+9.4 | 72,261 | D+17.8 | 55,127 | D+11.9 | 61,949 |
| Eau Claire | D+10.6 | 63,020 | D+16.9 | 48,427 | D+9.9 | 54,461 |
| Portage | D+1.2 | 43,171 | D+7.7 | 33,659 | D+2.8 | 40,456 |
| Grant | R+18.2 | 27,257 | R+6.8 | 20,085 | R+12.3 | 25,534 |
| Wood | R+19.5 | 24,699 | R+16.3 | 19,201 | R+18.7 | 24,029 |
| Dunn | R+15.9 | 25,678 | R+8.7 | 18,435 | R+14.0 | 23,480 |
| Pierce | R+16.8 | 25,334 | R+10.1 | 18,019 | R+13.0 | 23,221 |
| Monroe | R+24.4 | 20,579 | R+17.1 | 15,281 | R+21.9 | 19,817 |
| Chippewa | R+11.8 | 20,752 | R+4.7 | 15,404 | R+8.6 | 19,041 |
| Vernon | R+7.8 | 16,580 | D+1.4 | 13,193 | R+4.8 | 15,890 |
| Trempealeau | R+21.4 | 16,067 | R+12.5 | 12,246 | R+16.6 | 15,321 |
| Adams | R+25.8 | 12,853 | R+20.2 | 9,902 | R+25.7 | 11,781 |
| Juneau | R+28.7 | 11,404 | R+19.1 | 8,346 | R+25.9 | 10,671 |
| Jackson | R+17.2 | 9,490 | R+7.8 | 7,226 | R+12.0 | 9,065 |
| Richland | R+13.1 | 9,309 | R+3.0 | 7,003 | R+9.8 | 8,982 |
| Crawford | R+13.8 | 9,084 | R+0.8 | 7,002 | R+7.7 | 8,677 |
| Buffalo | R+30.3 | 8,091 | R+20.3 | 6,135 | R+25.4 | 7,785 |
| Pepin | R+29.3 | 4,354 | R+21.4 | 3,311 | R+26.5 | 4,131 |
| Sauk | R+27.4 | 2,166 | R+20.3 | 1,744 | R+24.9 | 2,123 |
| Waukesha | - | - | R+40.3 | 1,422 | - | - |
| Lafayette | R+5.6 | 179 | D+6.7 | 135 | D+5.0 | 161 |
| Iowa | D+8.9 | 56 | D+22.0 | 50 | D+12.7 | 55 |
| Sheboygan | - | 0 | - | - | - | - |
| All counties (approx.) | R+7.4 | 422,384 | D+0.2 | 321,353 | R+5.5 | 386,630 |
La Crosse: 74 precinct results and demographics
Eau Claire: 104 precinct results and demographics
Portage: 56 precinct results and demographics
Grant: 67 precinct results and demographics
Wood: 29 precinct results and demographics
Dunn: 43 precinct results and demographics
Pierce: 34 precinct results and demographics
Monroe: 54 precinct results and demographics
Chippewa: 40 precinct results and demographics
Vernon: 44 precinct results and demographics
Trempealeau: 33 precinct results and demographics
Adams: 30 precinct results and demographics
Juneau: 31 precinct results and demographics
Jackson: 30 precinct results and demographics
Richland: 41 precinct results and demographics
Crawford: 29 precinct results and demographics
Buffalo: 25 precinct results and demographics
Pepin: 14 precinct results and demographics
Sauk: 9 precinct results and demographics
Waukesha: 1 precinct results and demographics
Lafayette: 2 precinct results and demographics
Iowa: 1 precinct results and demographics
Sheboygan: 1 precinct results and demographics
2024 President (Kamala D. Harris Tim Walz vs. Donald J. Trump JD Vance). Source: Wisconsin Elections Commission, official ward-by-ward canvass (combined file). Official certified results, Wisconsin Elections Commission, certified Nov. 29, 2024.
2022 Governor (Tony Evers Sara Rodriguez vs. Tim Michels Roger Roth). Source: Wisconsin Elections Commission, official ward-by-ward canvass (per-contest files). Official certified results, Wisconsin Elections Commission, certified Nov. 30, 2022.
2020 President (Joseph R. Biden Kamala D. Harris vs. Donald J. Trump Michael R. Pence). Source: Wisconsin Elections Commission, official ward-by-ward canvass (per-contest files; President post-recount). Official certified results, Wisconsin Elections Commission; President canvassed after the Dane/Milwaukee partial recount and certified Nov. 30, 2020; other contests certified Dec. 1, 2020.
Precinct demographics
Demographics are Census American Community Survey (ACS) 2020-2024 5-year estimates for block groups, assigned to precincts by area share. They describe the resident population, not registered or likely voters, and include non-citizens. ACS margins of error are not shown; small precincts carry large error. Area weighting assumes people are spread evenly within each block group, so large rural precincts are the least reliable. Median income is a household-weighted average of block-group medians, an approximation.
| Area | Population | Voting-age pop. | % White non-Hisp. | % Hispanic | % Black | % Asian | Median income* | % Bachelor's+ | % 18-29 (of adults) | % 65+ | % Homeowners | % Below poverty | % Spanish at home (adults) |
|---|---|---|---|---|---|---|---|---|---|---|---|---|---|
| District | 727,652 | 576,369 | 89.3% | 3.6% | 1.1% | 2.3% | $76k | 28.4% | 22.4% | 19.4% | 70.1% | 11.6% | 2.0% |
| La Crosse (in district) | 118,261 | 95,122 | 87.3% | 2.7% | 1.5% | 4.6% | $80k | 36.5% | 26.4% | 18.2% | 62.3% | 12.3% | 2.1% |
| Eau Claire (in district) | 103,930 | 83,236 | 87.4% | 3.2% | 1.2% | 4.1% | $80k | 36.8% | 27.7% | 17.1% | 61.8% | 11.7% | 2.0% |
| Portage (in district) | 69,901 | 56,771 | 89.2% | 4.1% | 0.7% | 2.9% | $79k | 33.9% | 26.8% | 18.4% | 69.9% | 10.0% | 1.8% |
| Grant (in district) | 51,501 | 40,619 | 93.0% | 2.6% | 1.5% | 0.7% | $67k | 25.6% | 27.5% | 18.5% | 69.8% | 13.0% | 1.3% |
| Dunn (in district) | 44,609 | 35,904 | 90.6% | 2.5% | 0.9% | 3.0% | $77k | 29.5% | 28.3% | 17.2% | 67.5% | 10.5% | 1.4% |
| Wood (in district) | 42,739 | 33,339 | 89.9% | 4.0% | 0.4% | 1.9% | $71k | 19.6% | 16.7% | 22.0% | 74.2% | 11.5% | 1.3% |
| Pierce (in district) | 42,190 | 33,576 | 91.3% | 3.0% | 0.6% | 1.1% | $95k | 33.5% | 24.7% | 16.9% | 75.4% | 9.7% | 1.4% |
| Monroe (in district) | 40,159 | 29,719 | 88.4% | 6.0% | 1.4% | 0.8% | $72k | 21.6% | 17.3% | 17.7% | 72.6% | 12.1% | 3.5% |
| Chippewa (in district) | 35,420 | 27,949 | 91.5% | 2.2% | 1.4% | 1.9% | $82k | 27.3% | 16.1% | 18.9% | 68.1% | 10.6% | 1.5% |
| Vernon (in district) | 30,867 | 22,821 | 94.3% | 1.7% | 0.3% | 0.2% | $73k | 24.9% | 15.2% | 21.3% | 80.4% | 13.1% | 1.1% |
| Trempealeau (in district) | 30,814 | 22,600 | 83.9% | 12.9% | 0.3% | 0.5% | $78k | 20.9% | 16.4% | 18.7% | 74.0% | 9.9% | 6.8% |
| Juneau (in district) | 21,155 | 17,142 | 86.4% | 3.4% | 2.5% | 0.6% | $69k | 17.6% | 15.6% | 21.6% | 77.1% | 13.7% | 1.5% |
| Adams (in district) | 21,123 | 18,272 | 87.6% | 4.4% | 2.0% | 0.6% | $61k | 17.5% | 10.6% | 32.2% | 86.2% | 14.1% | 2.2% |
| Jackson (in district) | 17,179 | 13,554 | 86.8% | 3.5% | 1.5% | 0.4% | $71k | 16.6% | 15.9% | 21.1% | 79.9% | 12.3% | 1.8% |
| Richland (in district) | 17,155 | 13,511 | 92.0% | 3.3% | 0.3% | 0.9% | $66k | 21.2% | 14.6% | 24.9% | 73.8% | 14.5% | 2.3% |
| Crawford (in district) | 16,099 | 13,003 | 92.7% | 1.9% | 1.6% | 0.5% | $64k | 18.3% | 14.9% | 25.1% | 77.1% | 13.8% | 0.8% |
| Buffalo (in district) | 13,408 | 10,733 | 93.5% | 3.0% | 0.4% | 0.2% | $71k | 22.1% | 14.4% | 24.0% | 77.5% | 8.4% | 1.9% |
| Pepin (in district) | 7,380 | 5,731 | 94.1% | 2.7% | 0.4% | 0.6% | $76k | 23.0% | 13.8% | 24.5% | 83.0% | 10.2% | 1.7% |
| Sauk (in district) | 3,755 | 2,761 | 91.4% | 4.4% | 0.2% | 0.3% | $82k | 24.1% | 18.8% | 19.4% | 85.2% | 6.7% | 2.1% |
| Lafayette (in district) | 9 | 6 | 92.8% | 3.0% | 0.1% | 0.0% | $74k | 24.5% | 12.4% | 23.2% | 70.1% | 4.0% | 2.2% |
| Iowa (in district) | 1 | 1 | 96.2% | 2.9% | 0.0% | 0.0% | $86k | 20.0% | 12.8% | 20.0% | 82.2% | 13.3% | 2.3% |
Precinct-level demographics (1,185 precincts) are on the county pages linked above.
*Median income is approximate (see note above). ACS 2020-2024 5-year.
Nonpartisan voter information. GOTV Polling does not endorse any candidate.