
Paid for and Authorized by Results PAC
Fielding closed
Sponsored by: 
Iowa Governor (IA-GOV) - Midterms - GOTV Poll
Prompt for AI to Analyze Poll
Select the text below and paste it into your AI assistant, or open it as a text file.
Copy Link
Interactive map: Iowa by county
Pick a layer, then click or tap a county to open its precinct map, with the county summary (past results, demographics and early vote) on the right.
R+30 or moreR+15-30R+5-15R+0-5D+0-5D+5-15D+15-30D+30 or moreno dataEarly ballots cast by registered party, D minus R, as of October 30, 2026. Party is registration, not vote.
R+30 or moreR+15-30R+5-15R+0-5D+0-5D+5-15D+15-30D+30 or moreno dataCertified result margin, D minus R, by county.
R+30 or moreR+15-30R+5-15R+0-5D+0-5D+5-15D+15-30D+30 or moreno dataCertified result margin, D minus R, by county.
R+30 or moreR+15-30R+5-15R+0-5D+0-5D+5-15D+15-30D+30 or moreno dataCertified result margin, D minus R, by county.
<5%5-15%15-30%30-50%50-70%70%+Census ACS 2020-2024, by county.
<$40k$40-60k$60-80k$80-100k$100-140k$140k+Census ACS 2020-2024, by county.
<1%1-2%2-4%4-8%8-15%15%+Census ACS 2020-2024, by county.
<0.5%0.5-1%1-2%2-4%4-8%8%+Census ACS 2020-2024, by county.
<15%15-20%20-25%25-35%35-45%45%+Adults 25+ with a bachelor's degree or higher. Census ACS 2020-2024.
<15%15-18%18-21%21-24%24-27%27%+Census ACS 2020-2024, by county.
<1%1-2%2-4%4-8%8-15%15%+Adults who speak Spanish at home. Census ACS 2020-2024.
<7%7-9%9-11%11-13%13-16%16%+Census ACS 2020-2024, by county.
<1k1k-2.5k2.5k-5k5k-10k10k-50k50k+Early ballots cast (mail returned plus in person), unofficial.
<35%35-45%45-55%55-60%60-65%65%+Share of early ballots cast by voters 65 and over, unofficial.
<8%8-12%12-16%16-20%20-25%25%+Share of early ballots cast by voters 18 to 40, unofficial.
GOTV poll results are published as statewide and district totals only; the map shows past results, early vote and demographics.
Statewide races are mapped by county. Precinct maps are on each U.S. House district poll page. Past results: certified county results from the Iowa Secretary of State. Early vote: civicAPI and Call the Map, republishing Iowa Secretary of State counts, as of October 30, 2026.
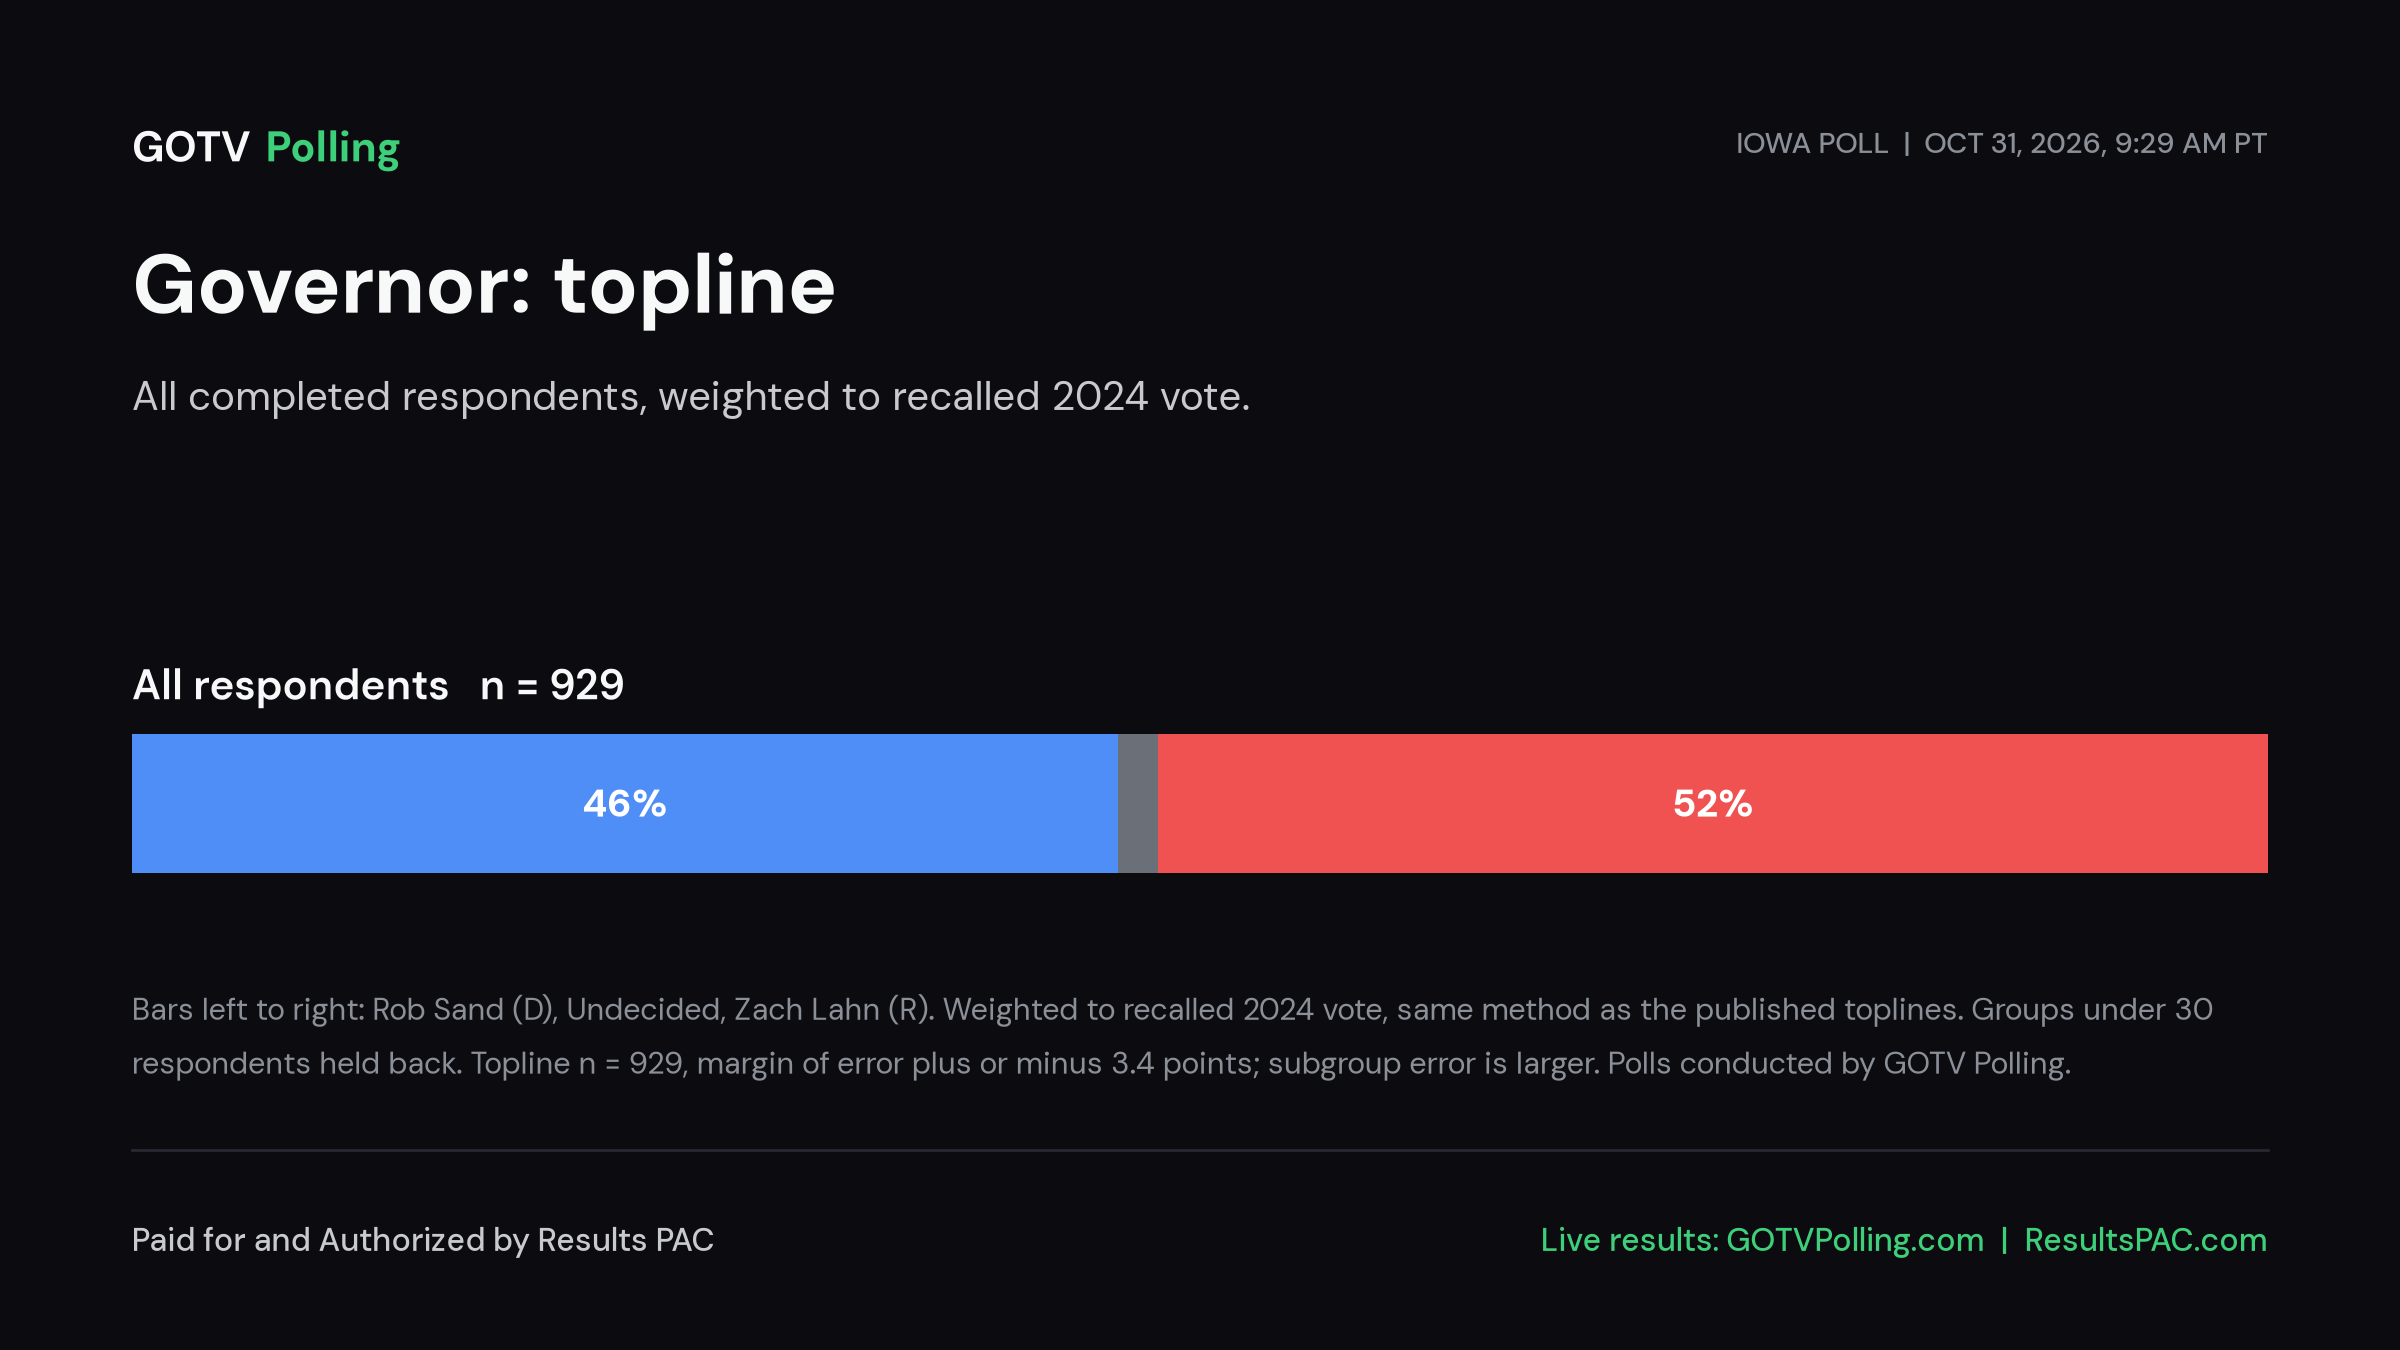
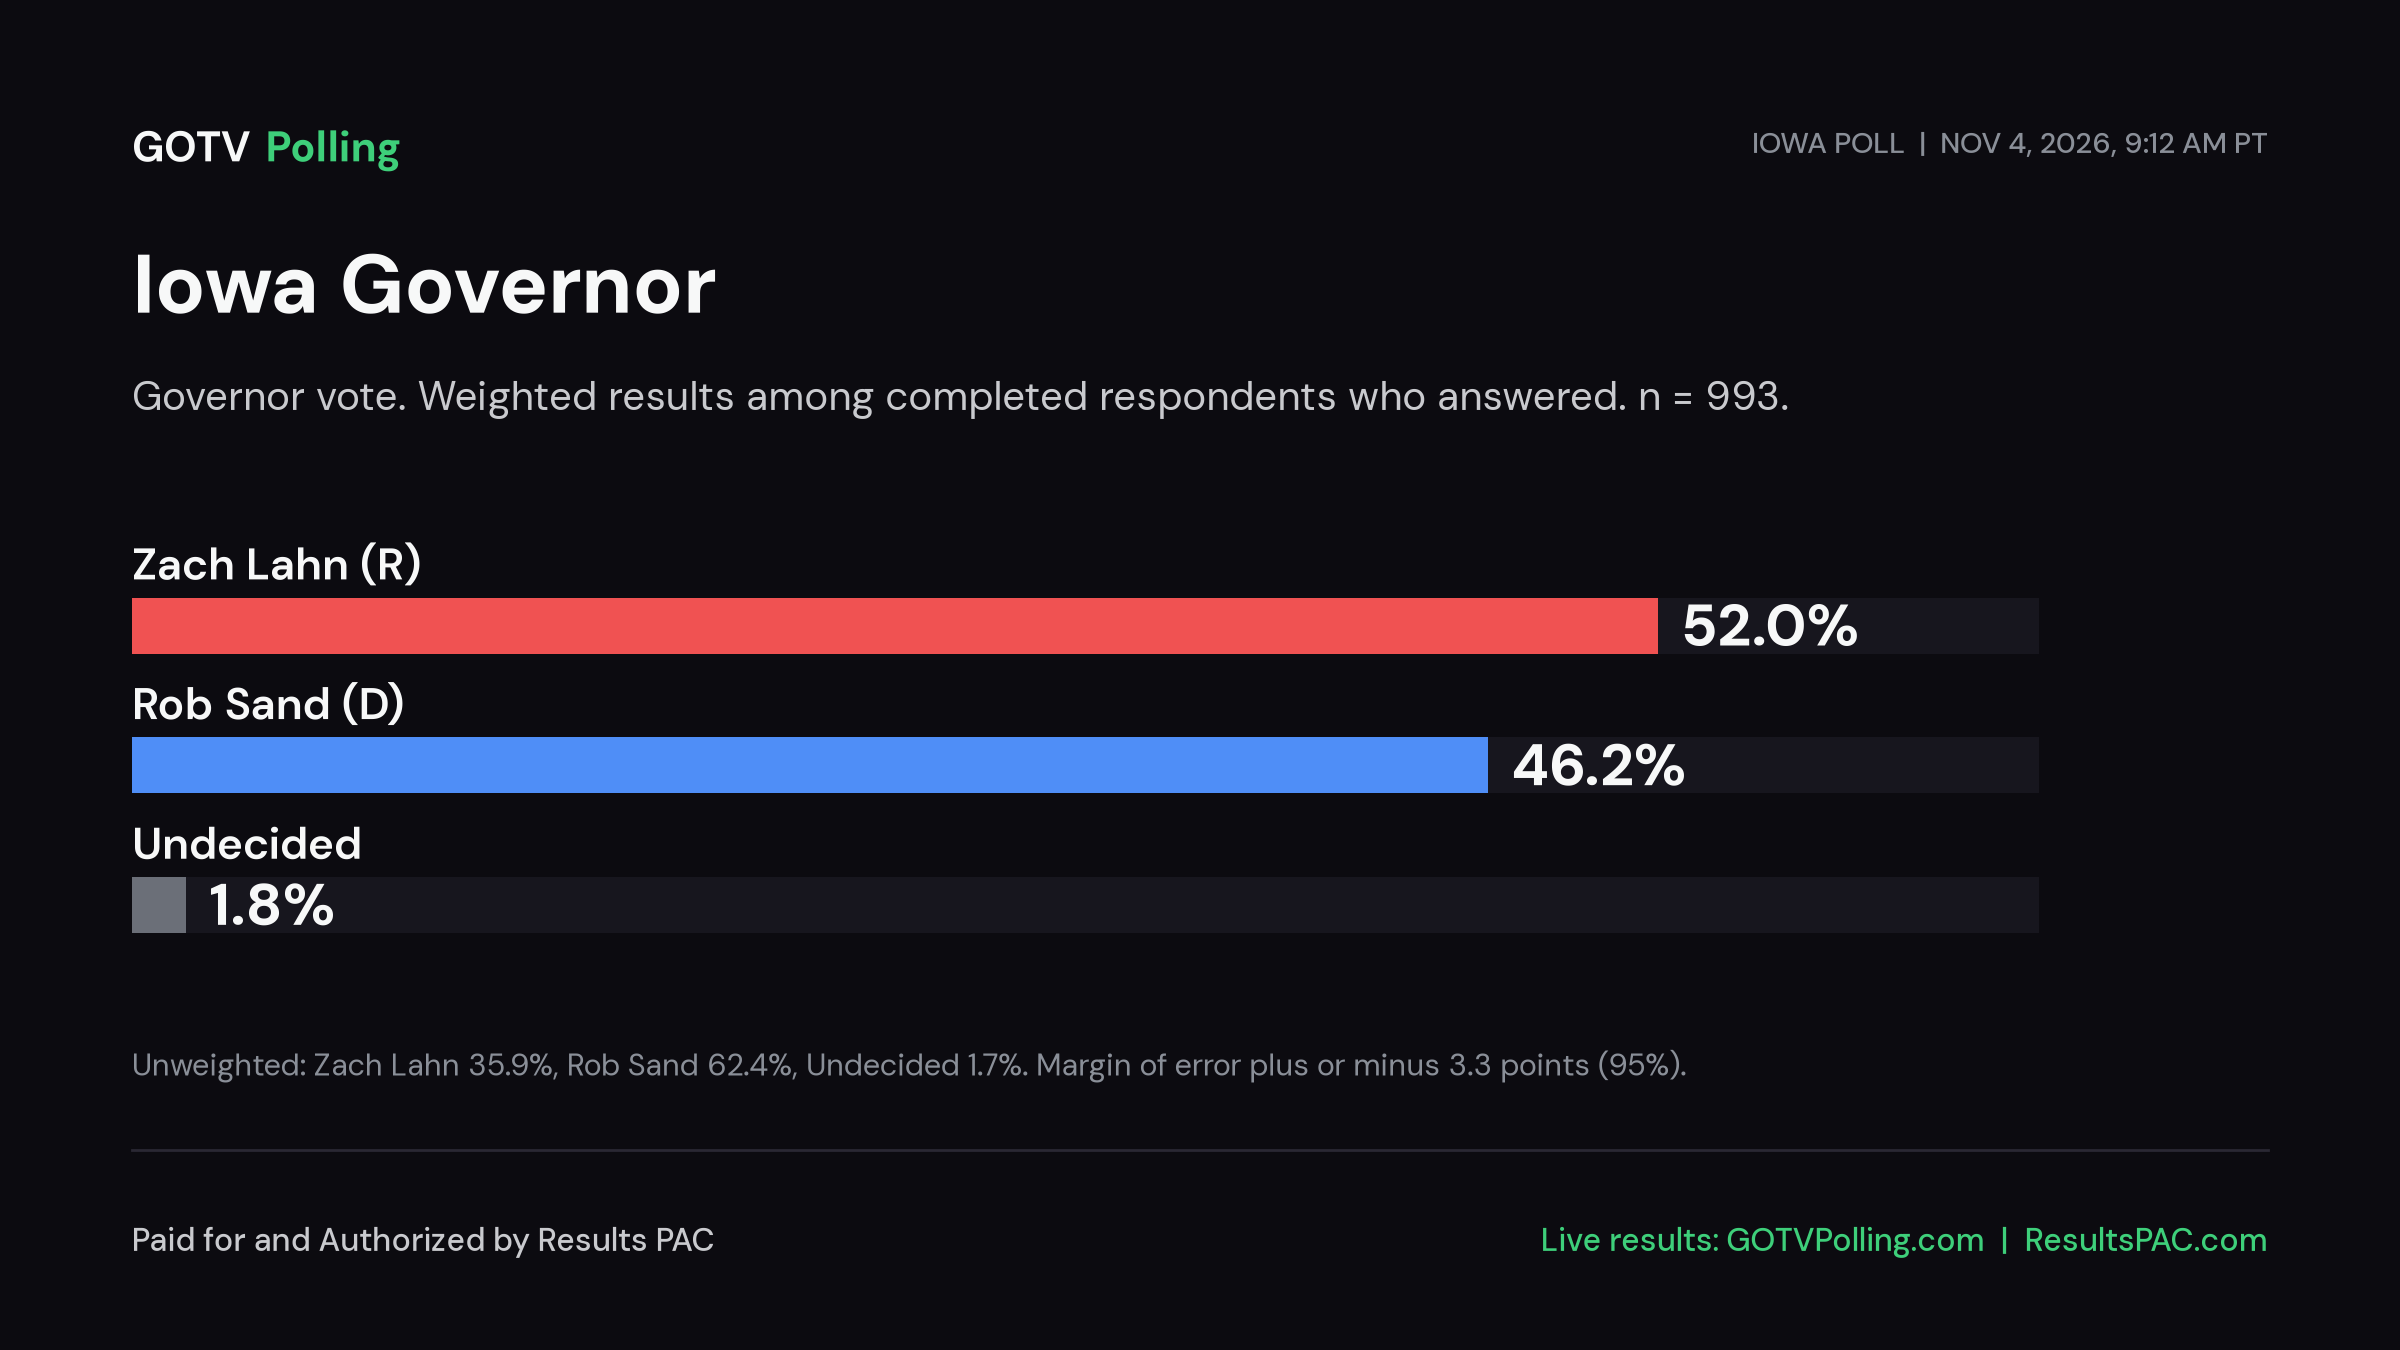
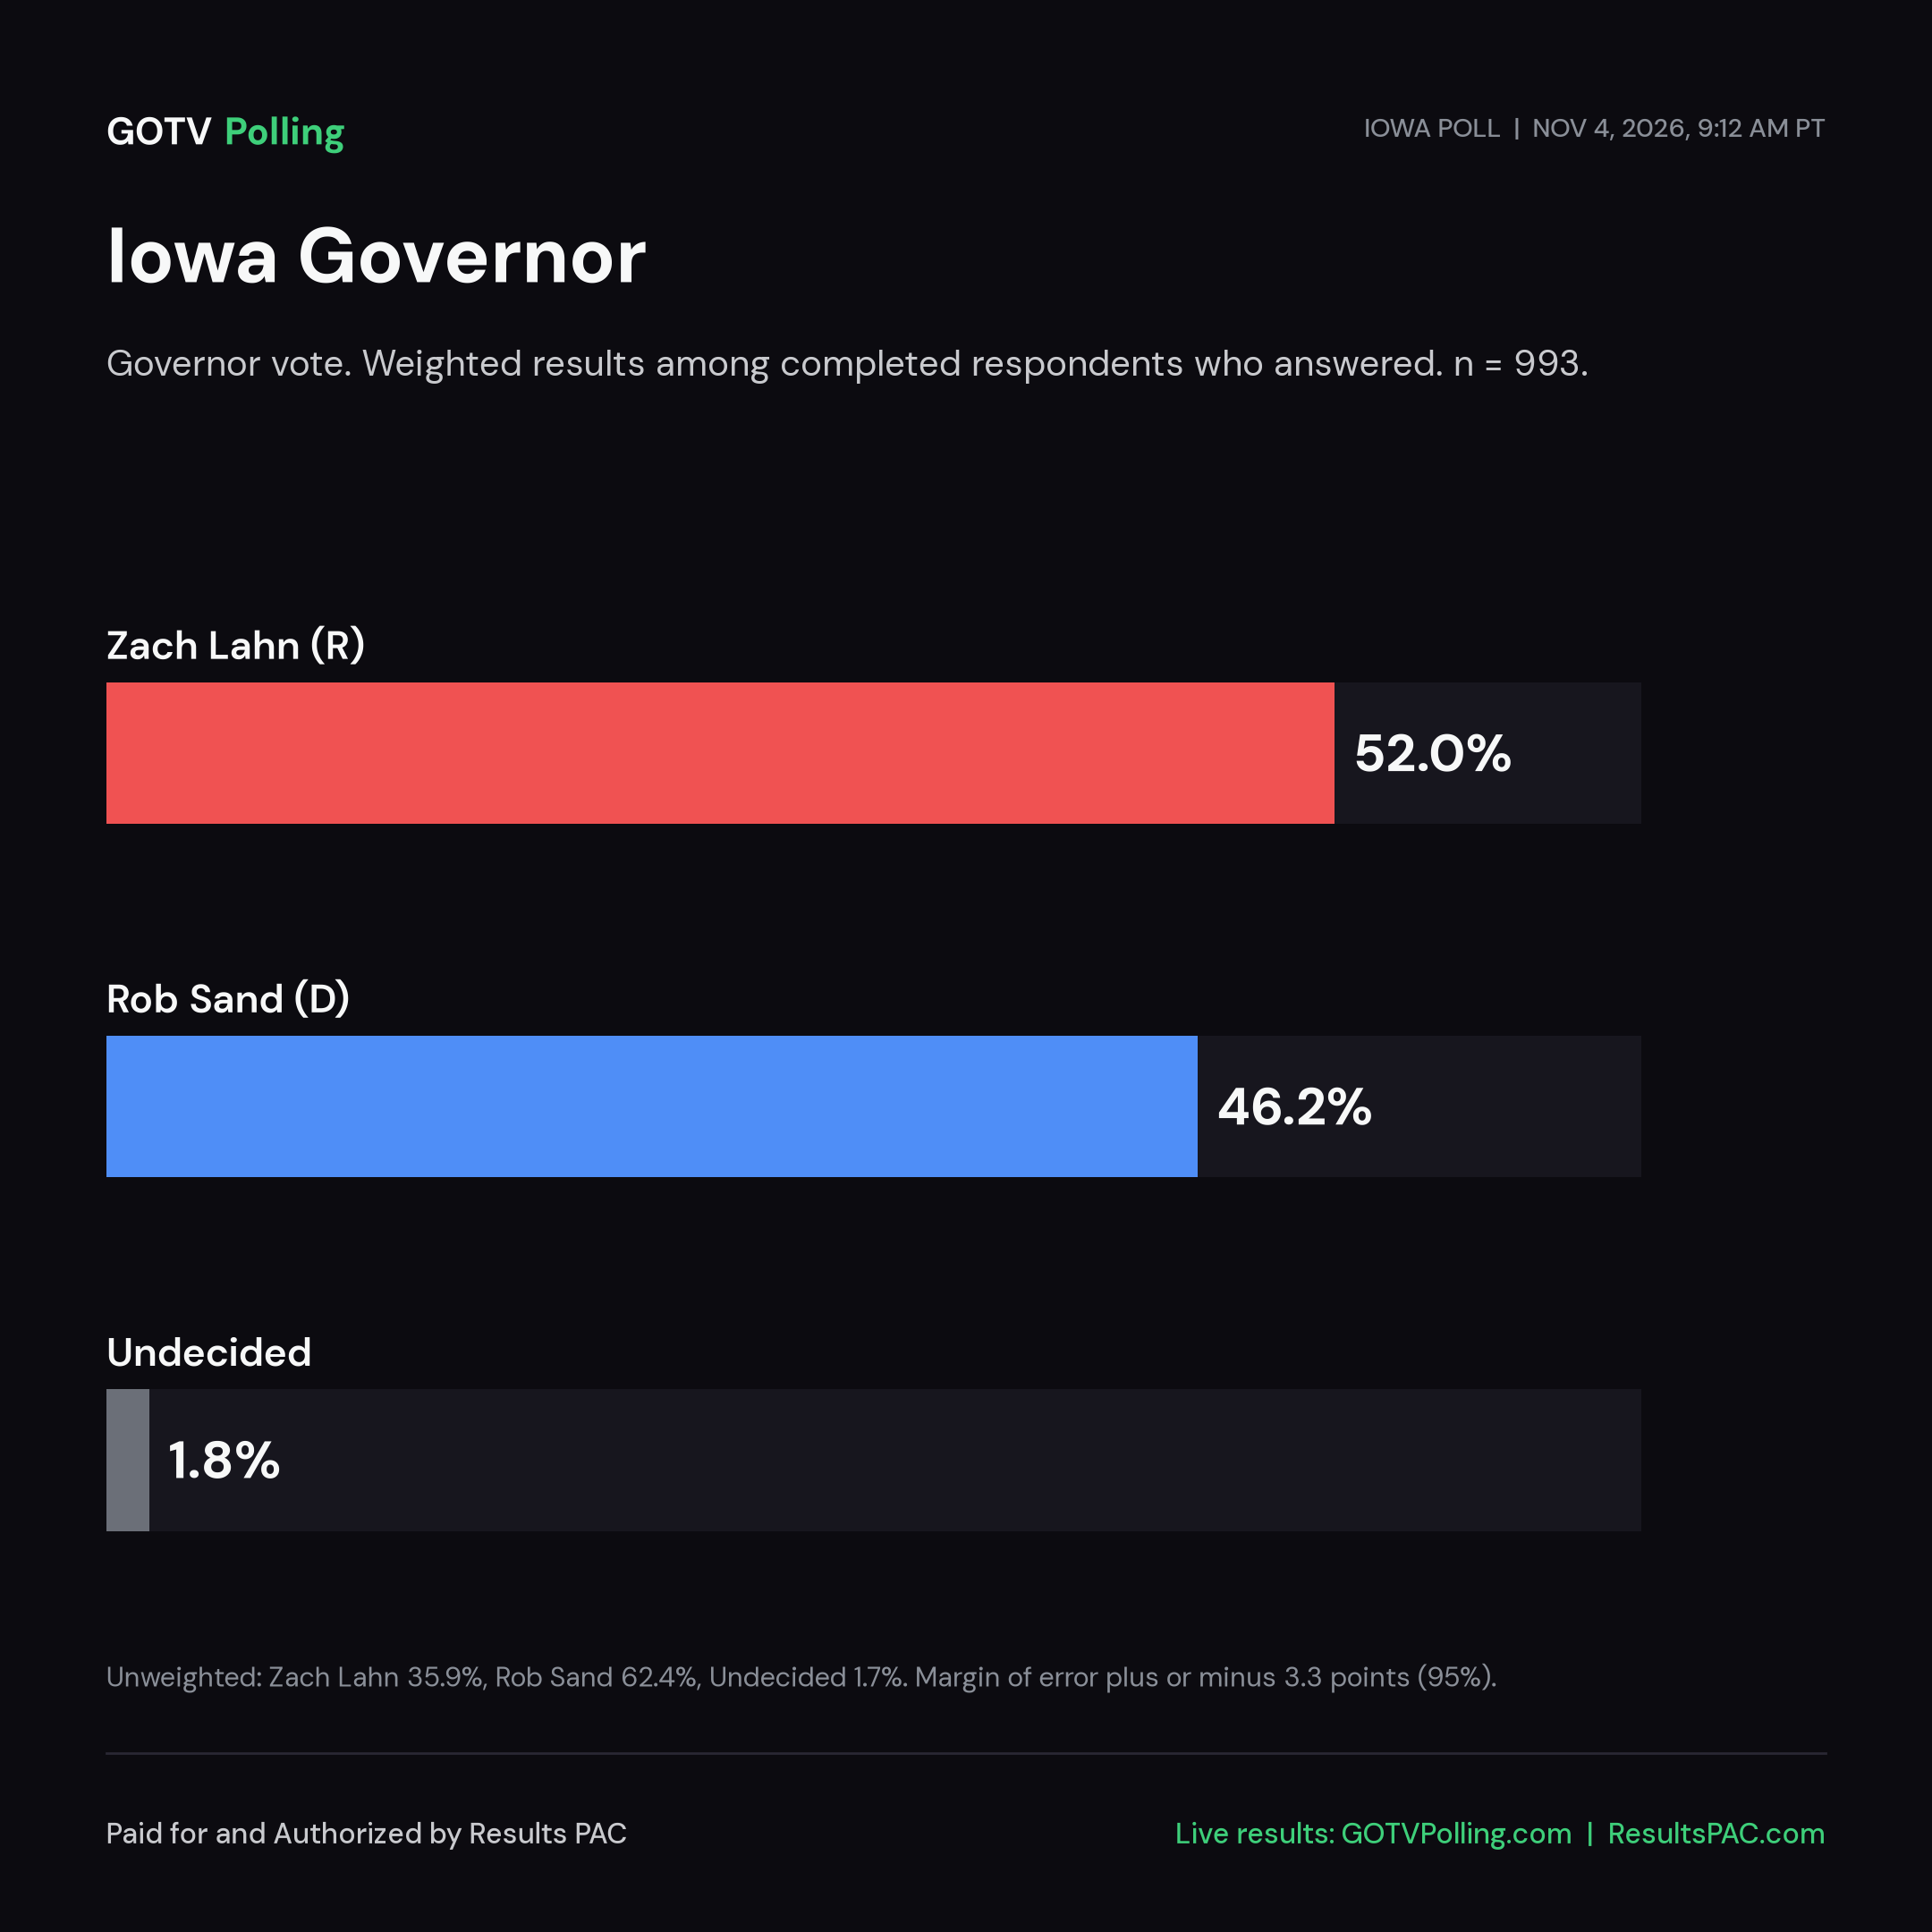
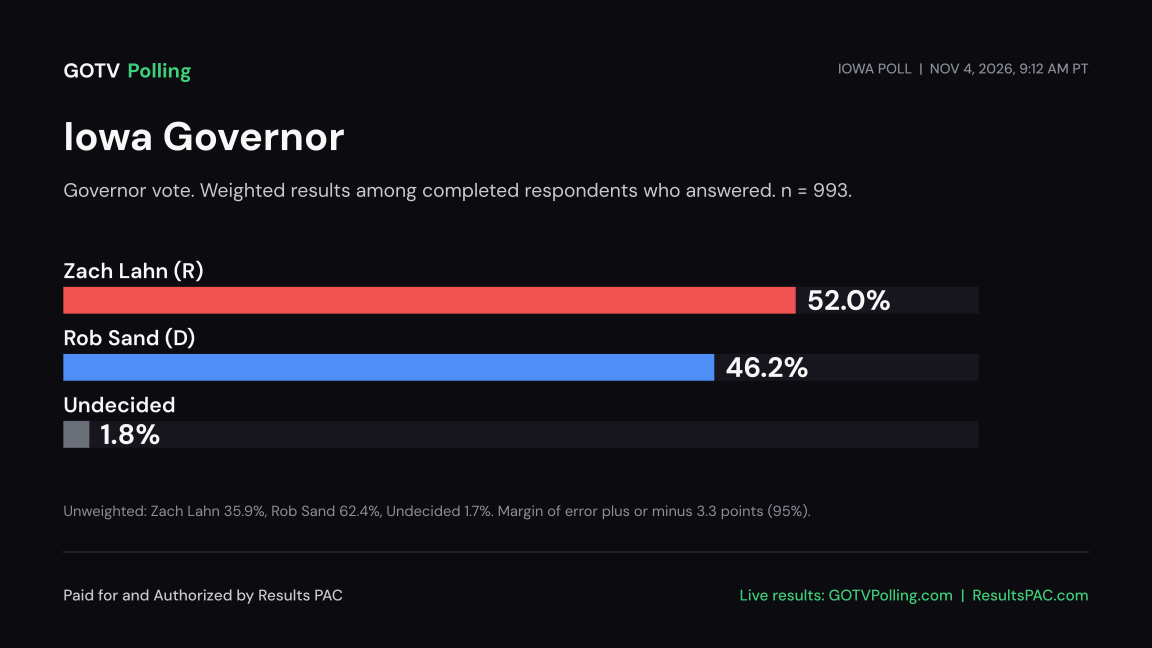
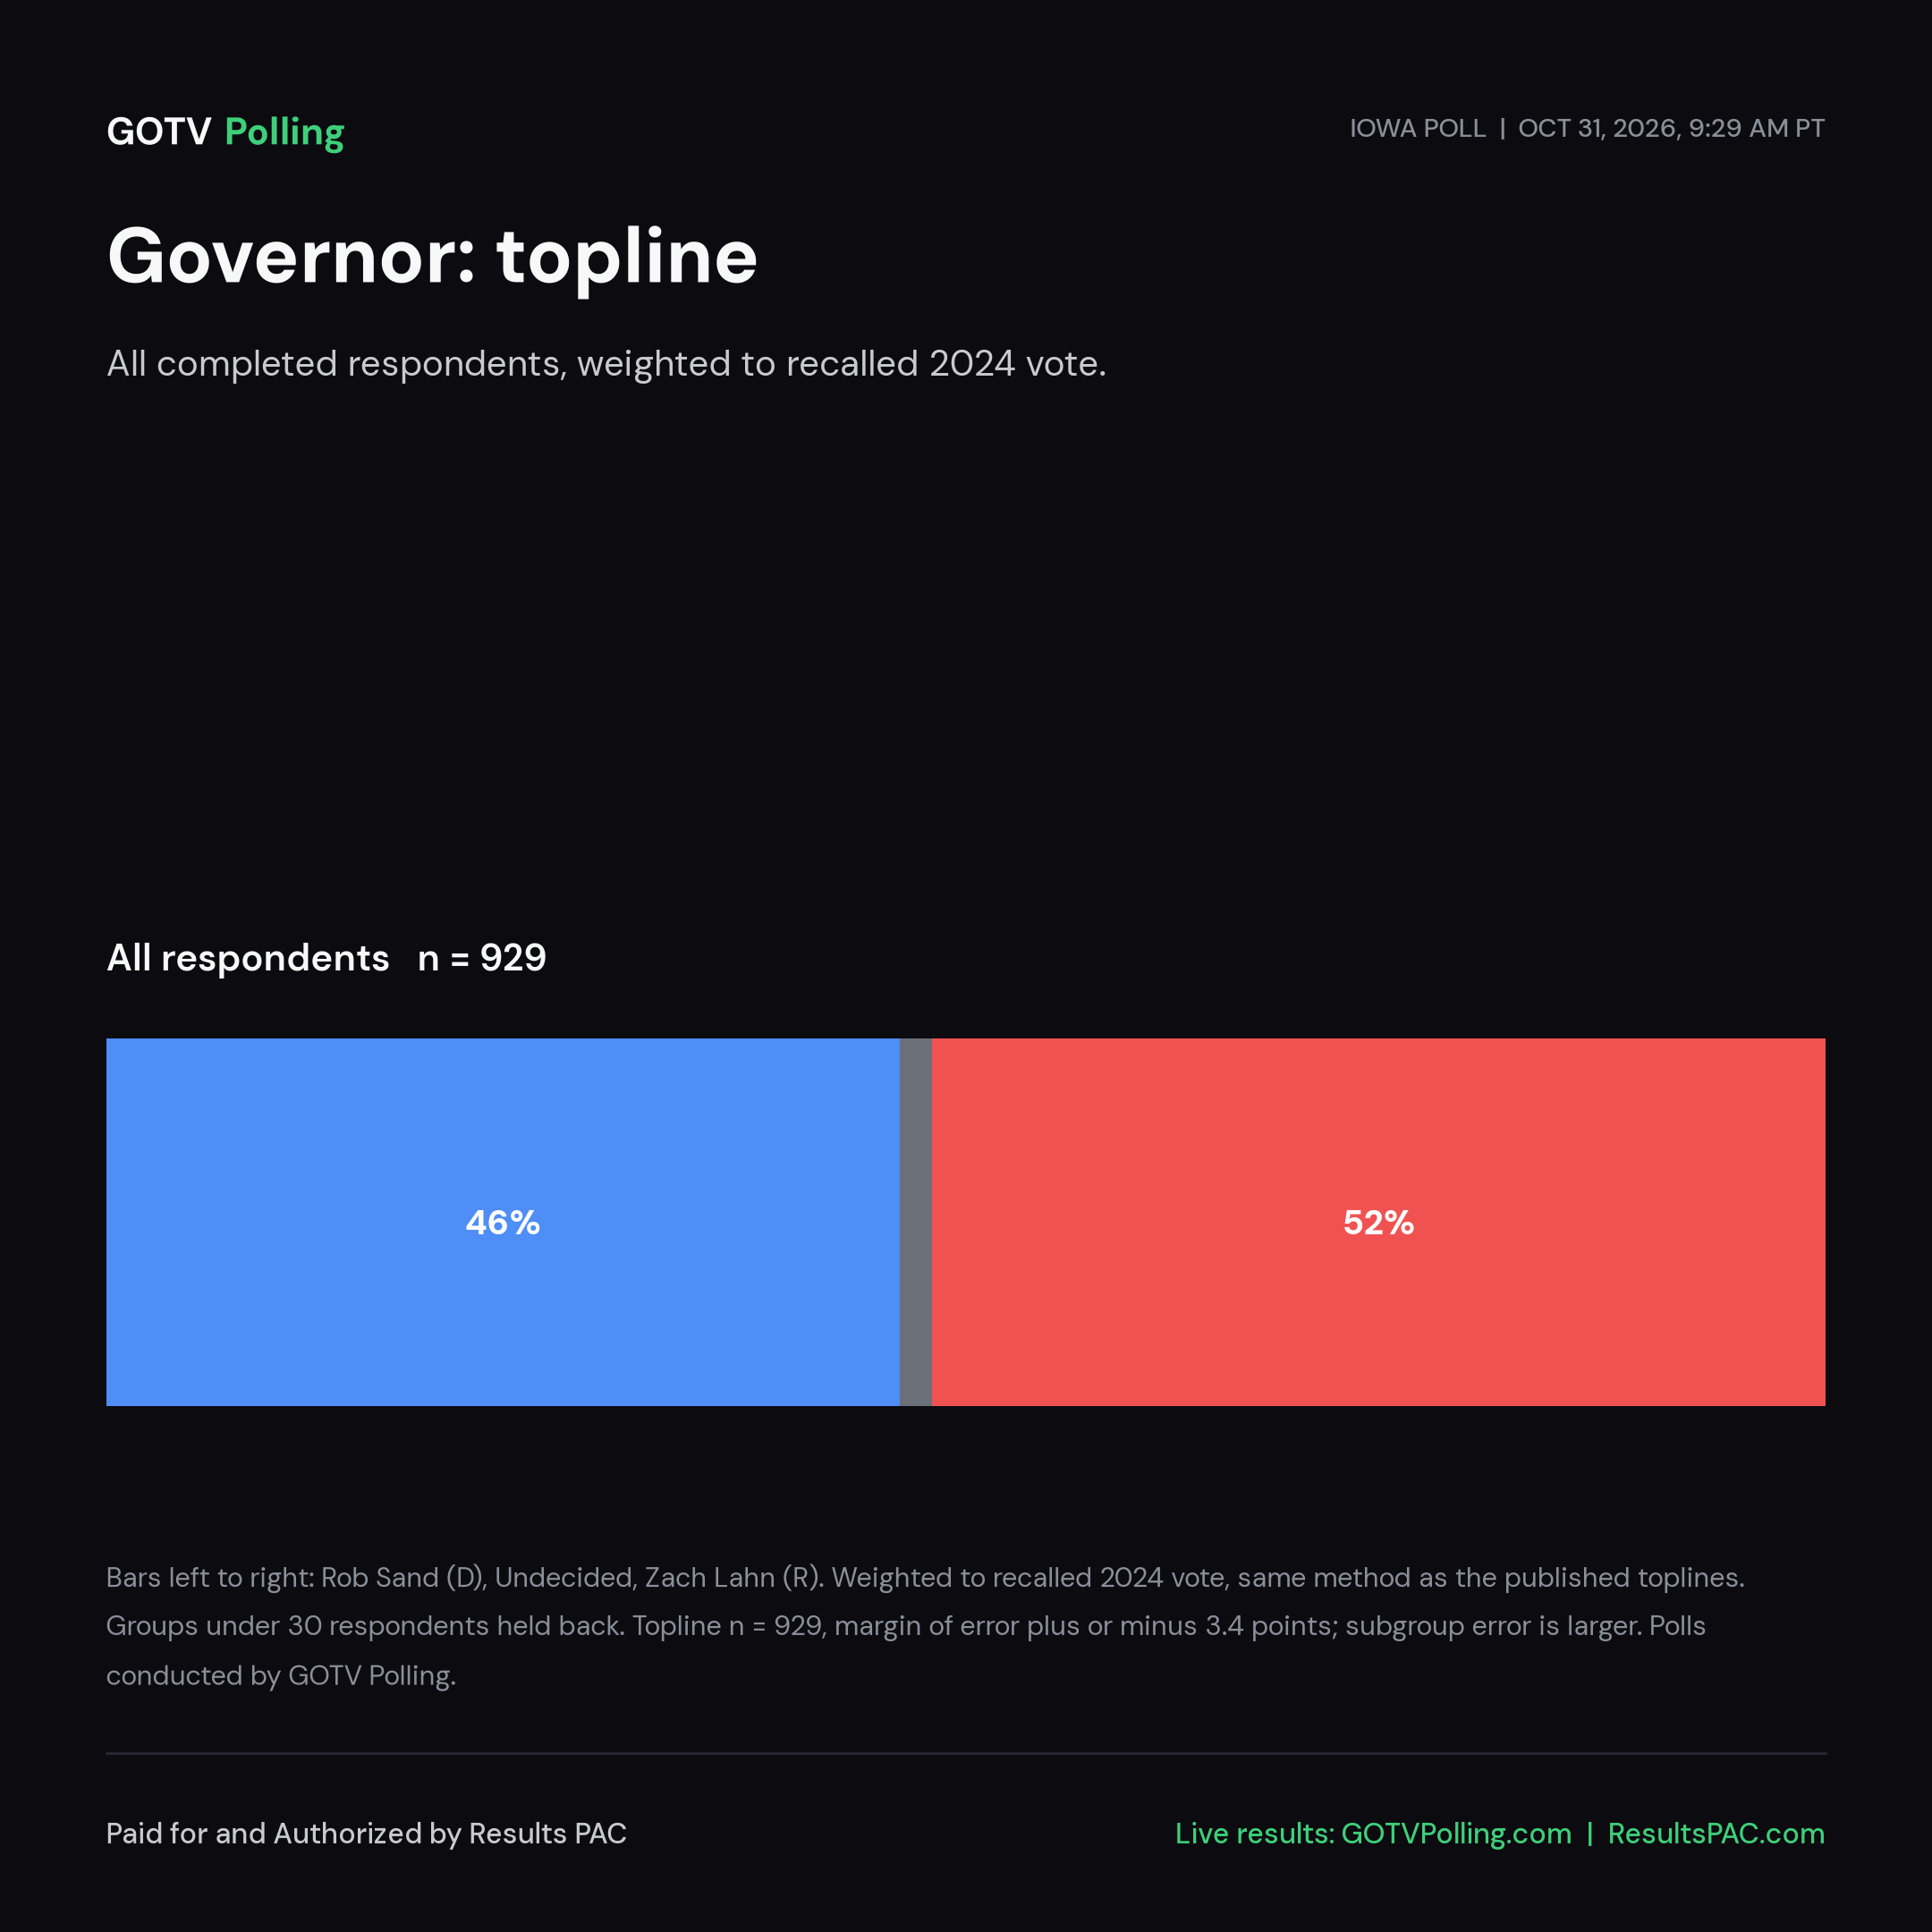
Top Line Poll Results LiveIA-GOV Governor: Zach Lahn 52.0%, Rob Sand 46.2% (Lahn +5.8), n = 993993 respondents · MOE ±3.1 pts · weightedExpand to see more
Governor (IA-GOV) #IAGOV
n = 993, weighted. Undecided 1.8%
Methodology LiveIA-GOV: 993 respondents · MOE ±3.1 ptsFielding since October 30, 2026 · data as of Nov 3, 2026, 6:59 PM PTExpand to see more
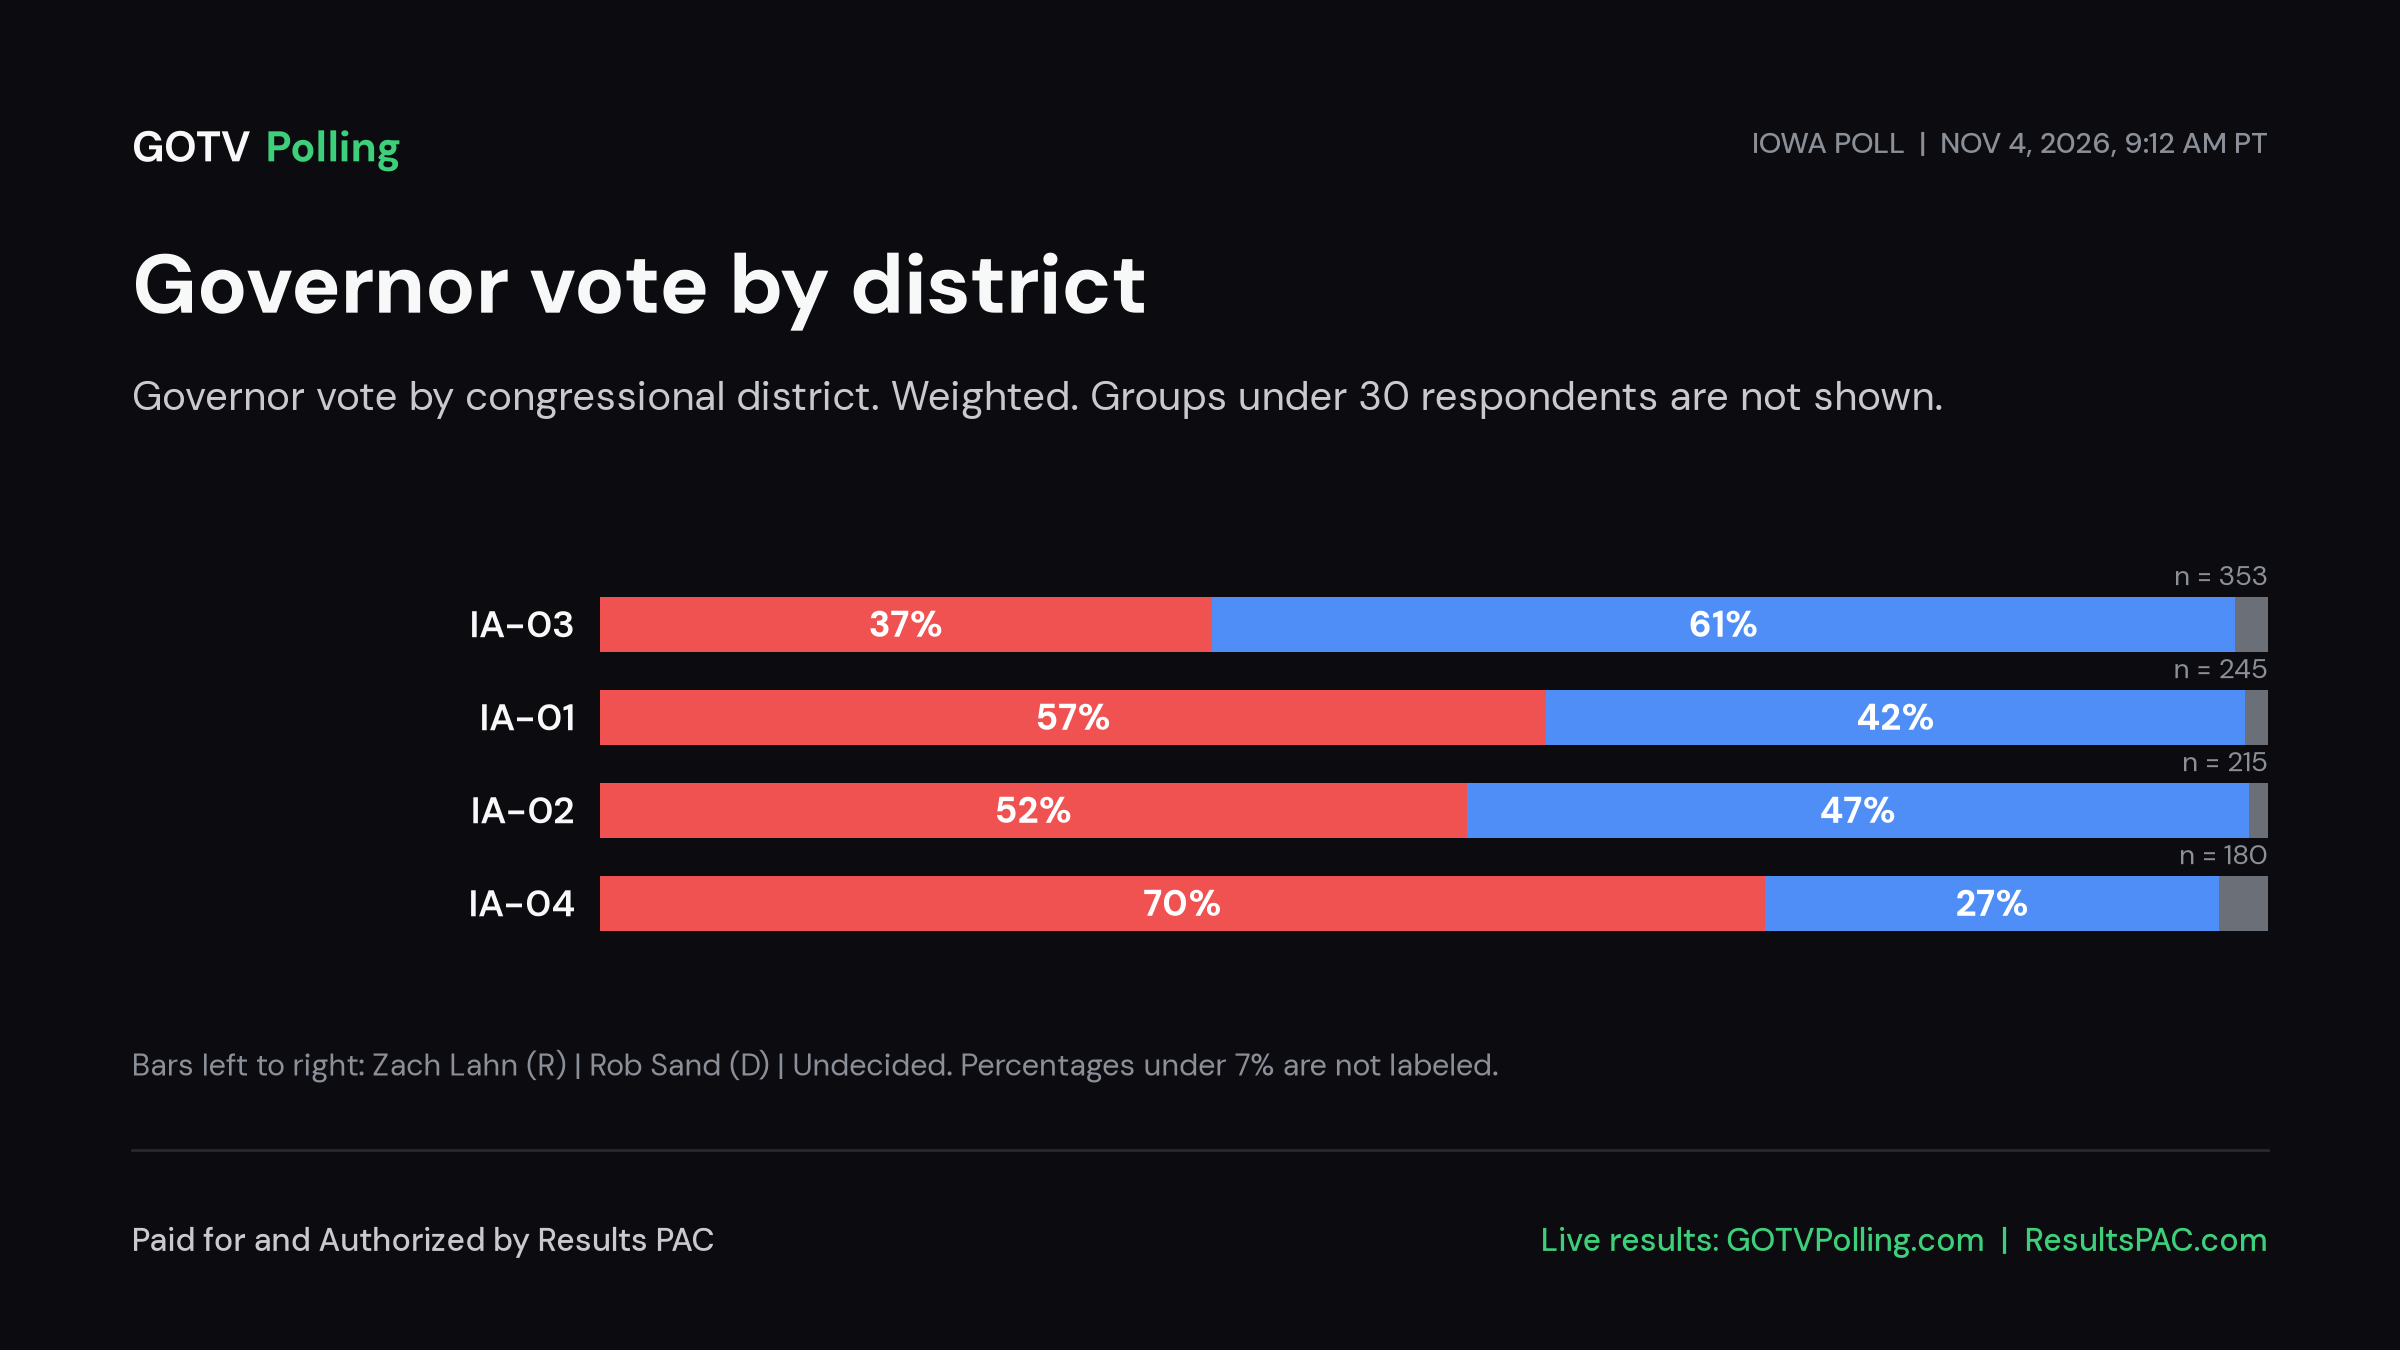
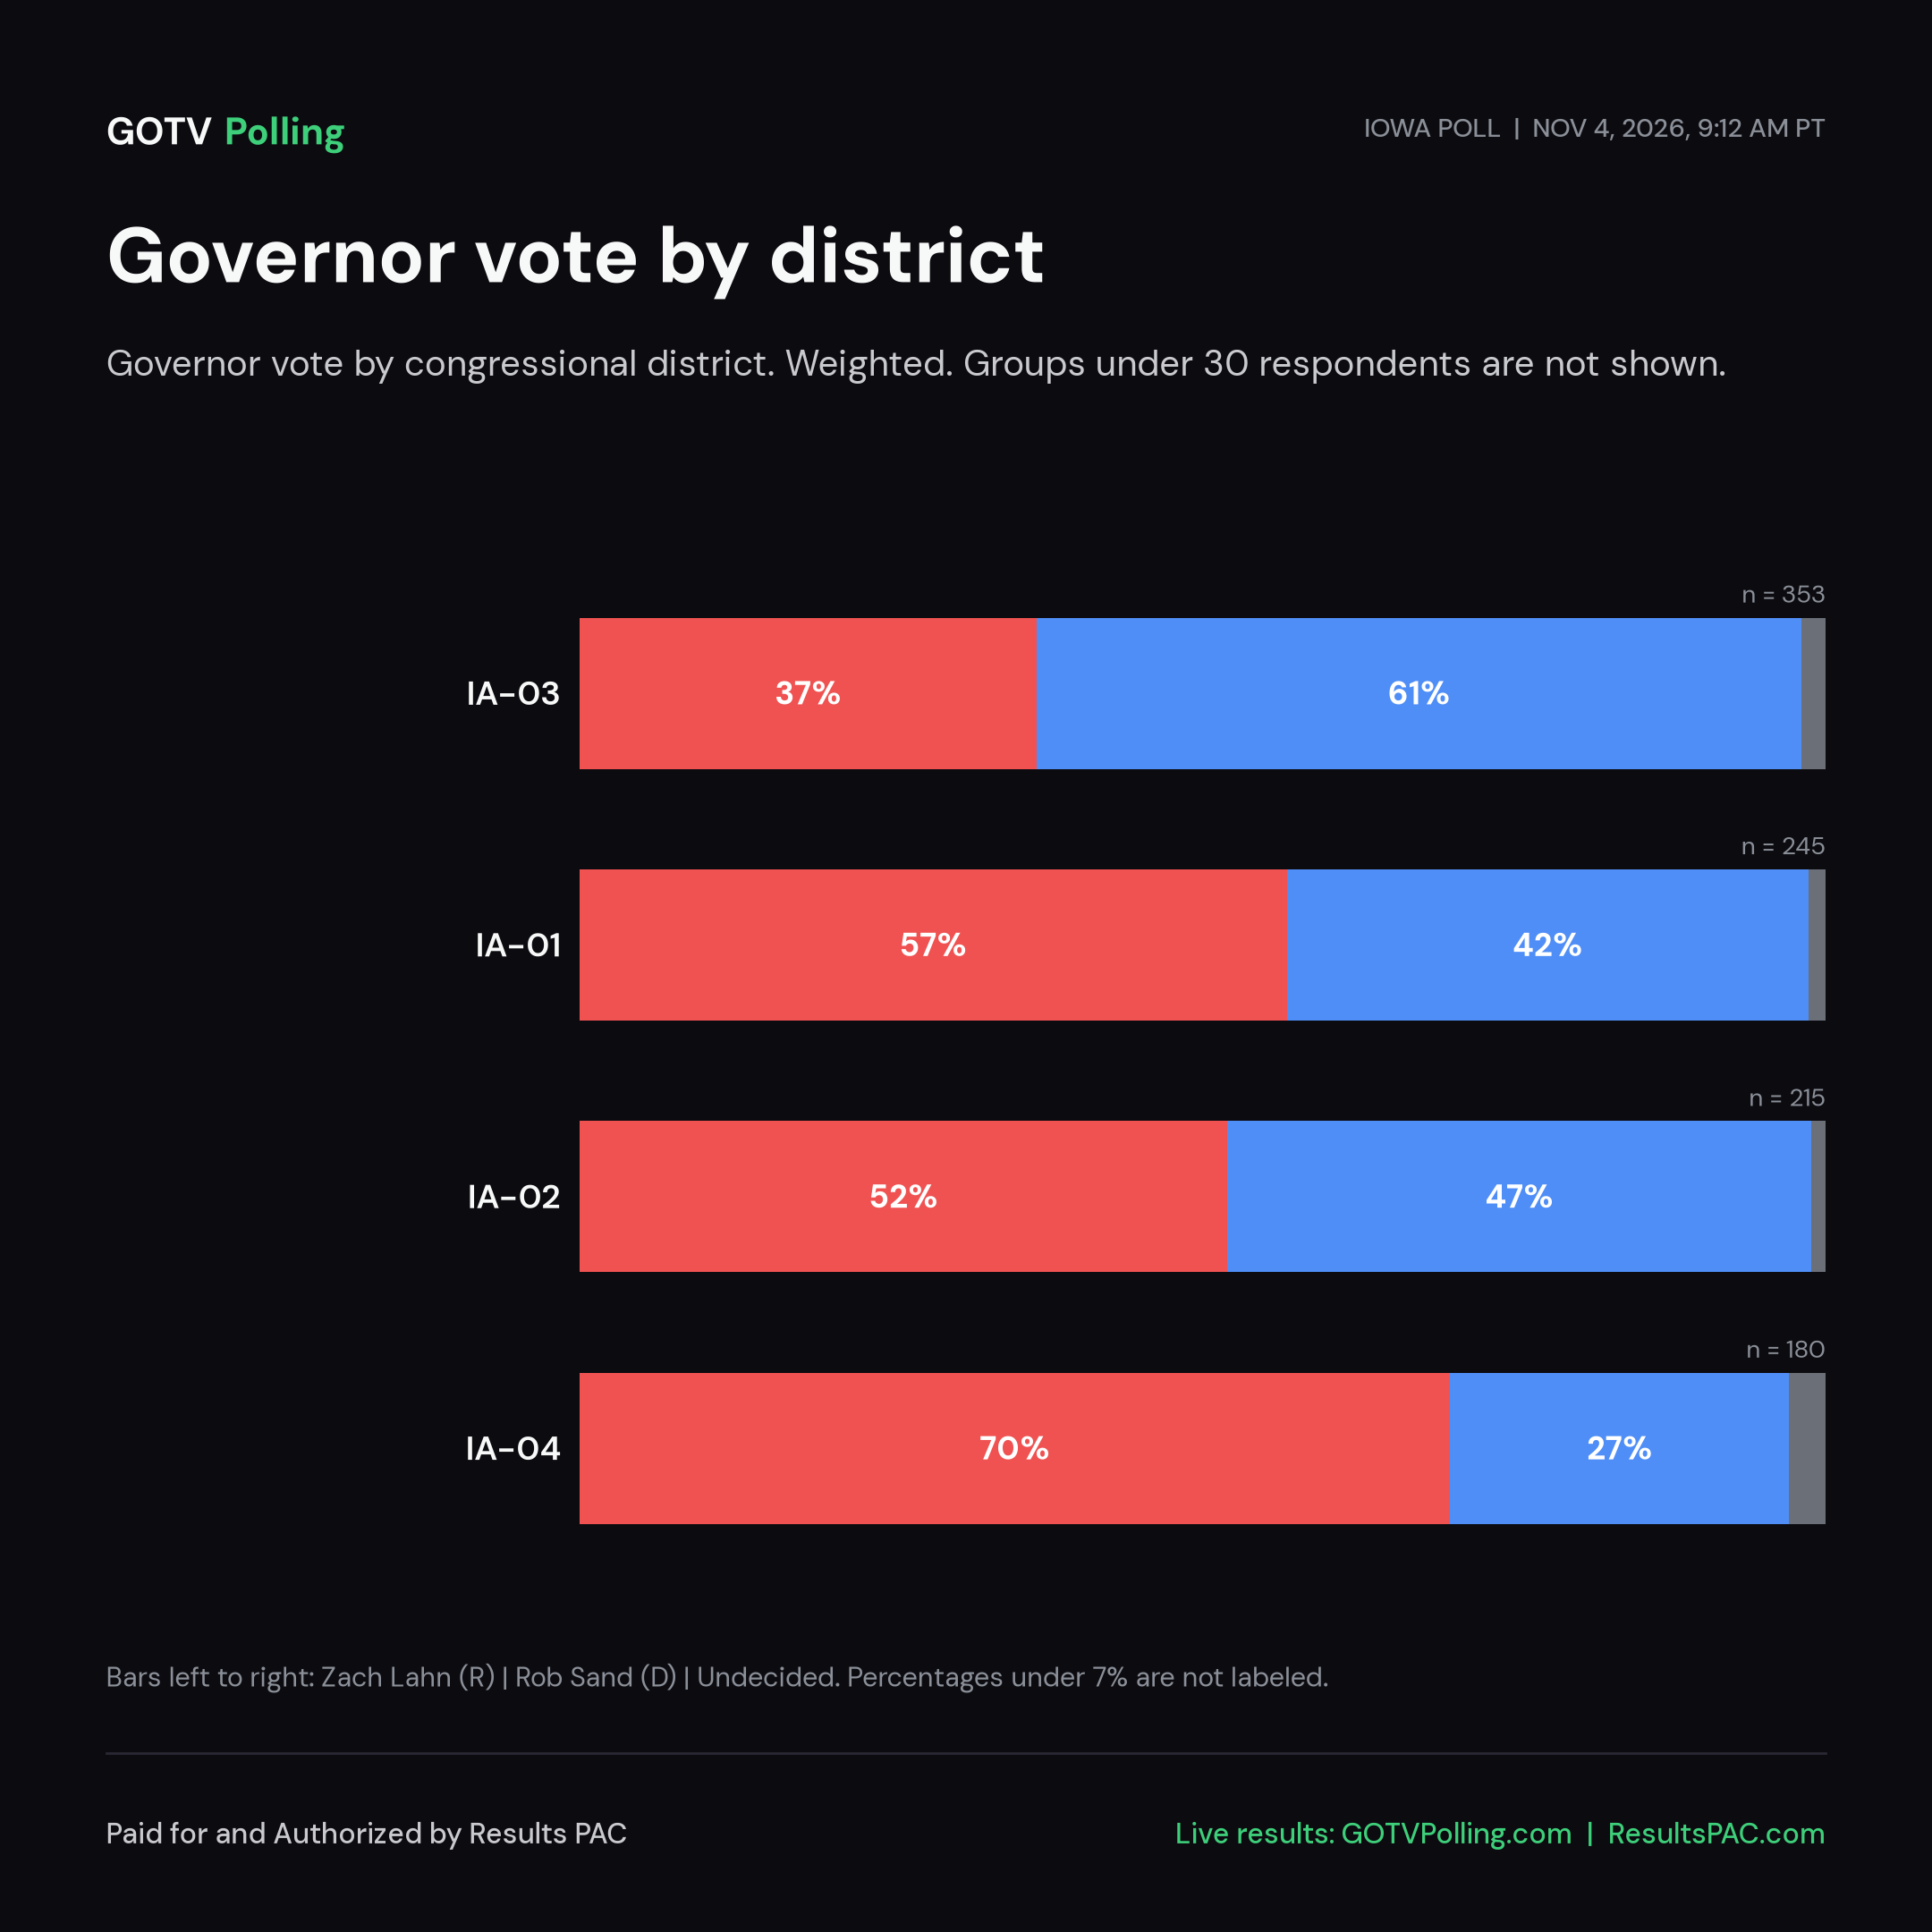
- One poll covers all six races; this methodology is the same on every race page. Respondents and margin of error by race: IA-SEN (#IASEN): 994 respondents, MOE ±3.1 pts; IA-GOV (#IAGOV): 993 respondents, MOE ±3.1 pts; IA-01 (#IA01): 245 respondents, MOE ±6.3 pts; IA-02 (#IA02): 215 respondents, MOE ±6.7 pts; IA-03 (#IA03): 350 respondents, MOE ±5.2 pts; IA-04 (#IA04): 180 respondents, MOE ±7.3 pts.
- Margin of error: plus or minus 3.1 points for the full sample (95% confidence); 3.3 with the design effect from weighting.
- Mode: Text-to-web. Registered Iowa voters, matched to the voter file. Collection has closed.
- Weighting: Weighted to the recalled 2024 presidential vote targets shown on this page (Trump, Harris, other). Region targets are not applied yet because respondents are placed by county only. Unweighted results and respondent counts are shown alongside.
- Official release as of November 4, 2026, 9:12 AM PT.
- Responses are still coming in. Results are published live on the GOTVPolling.com and ResultsPAC.com poll pages, and updated results, crosstabs, methodology and an expanded universe may be published from time to time.
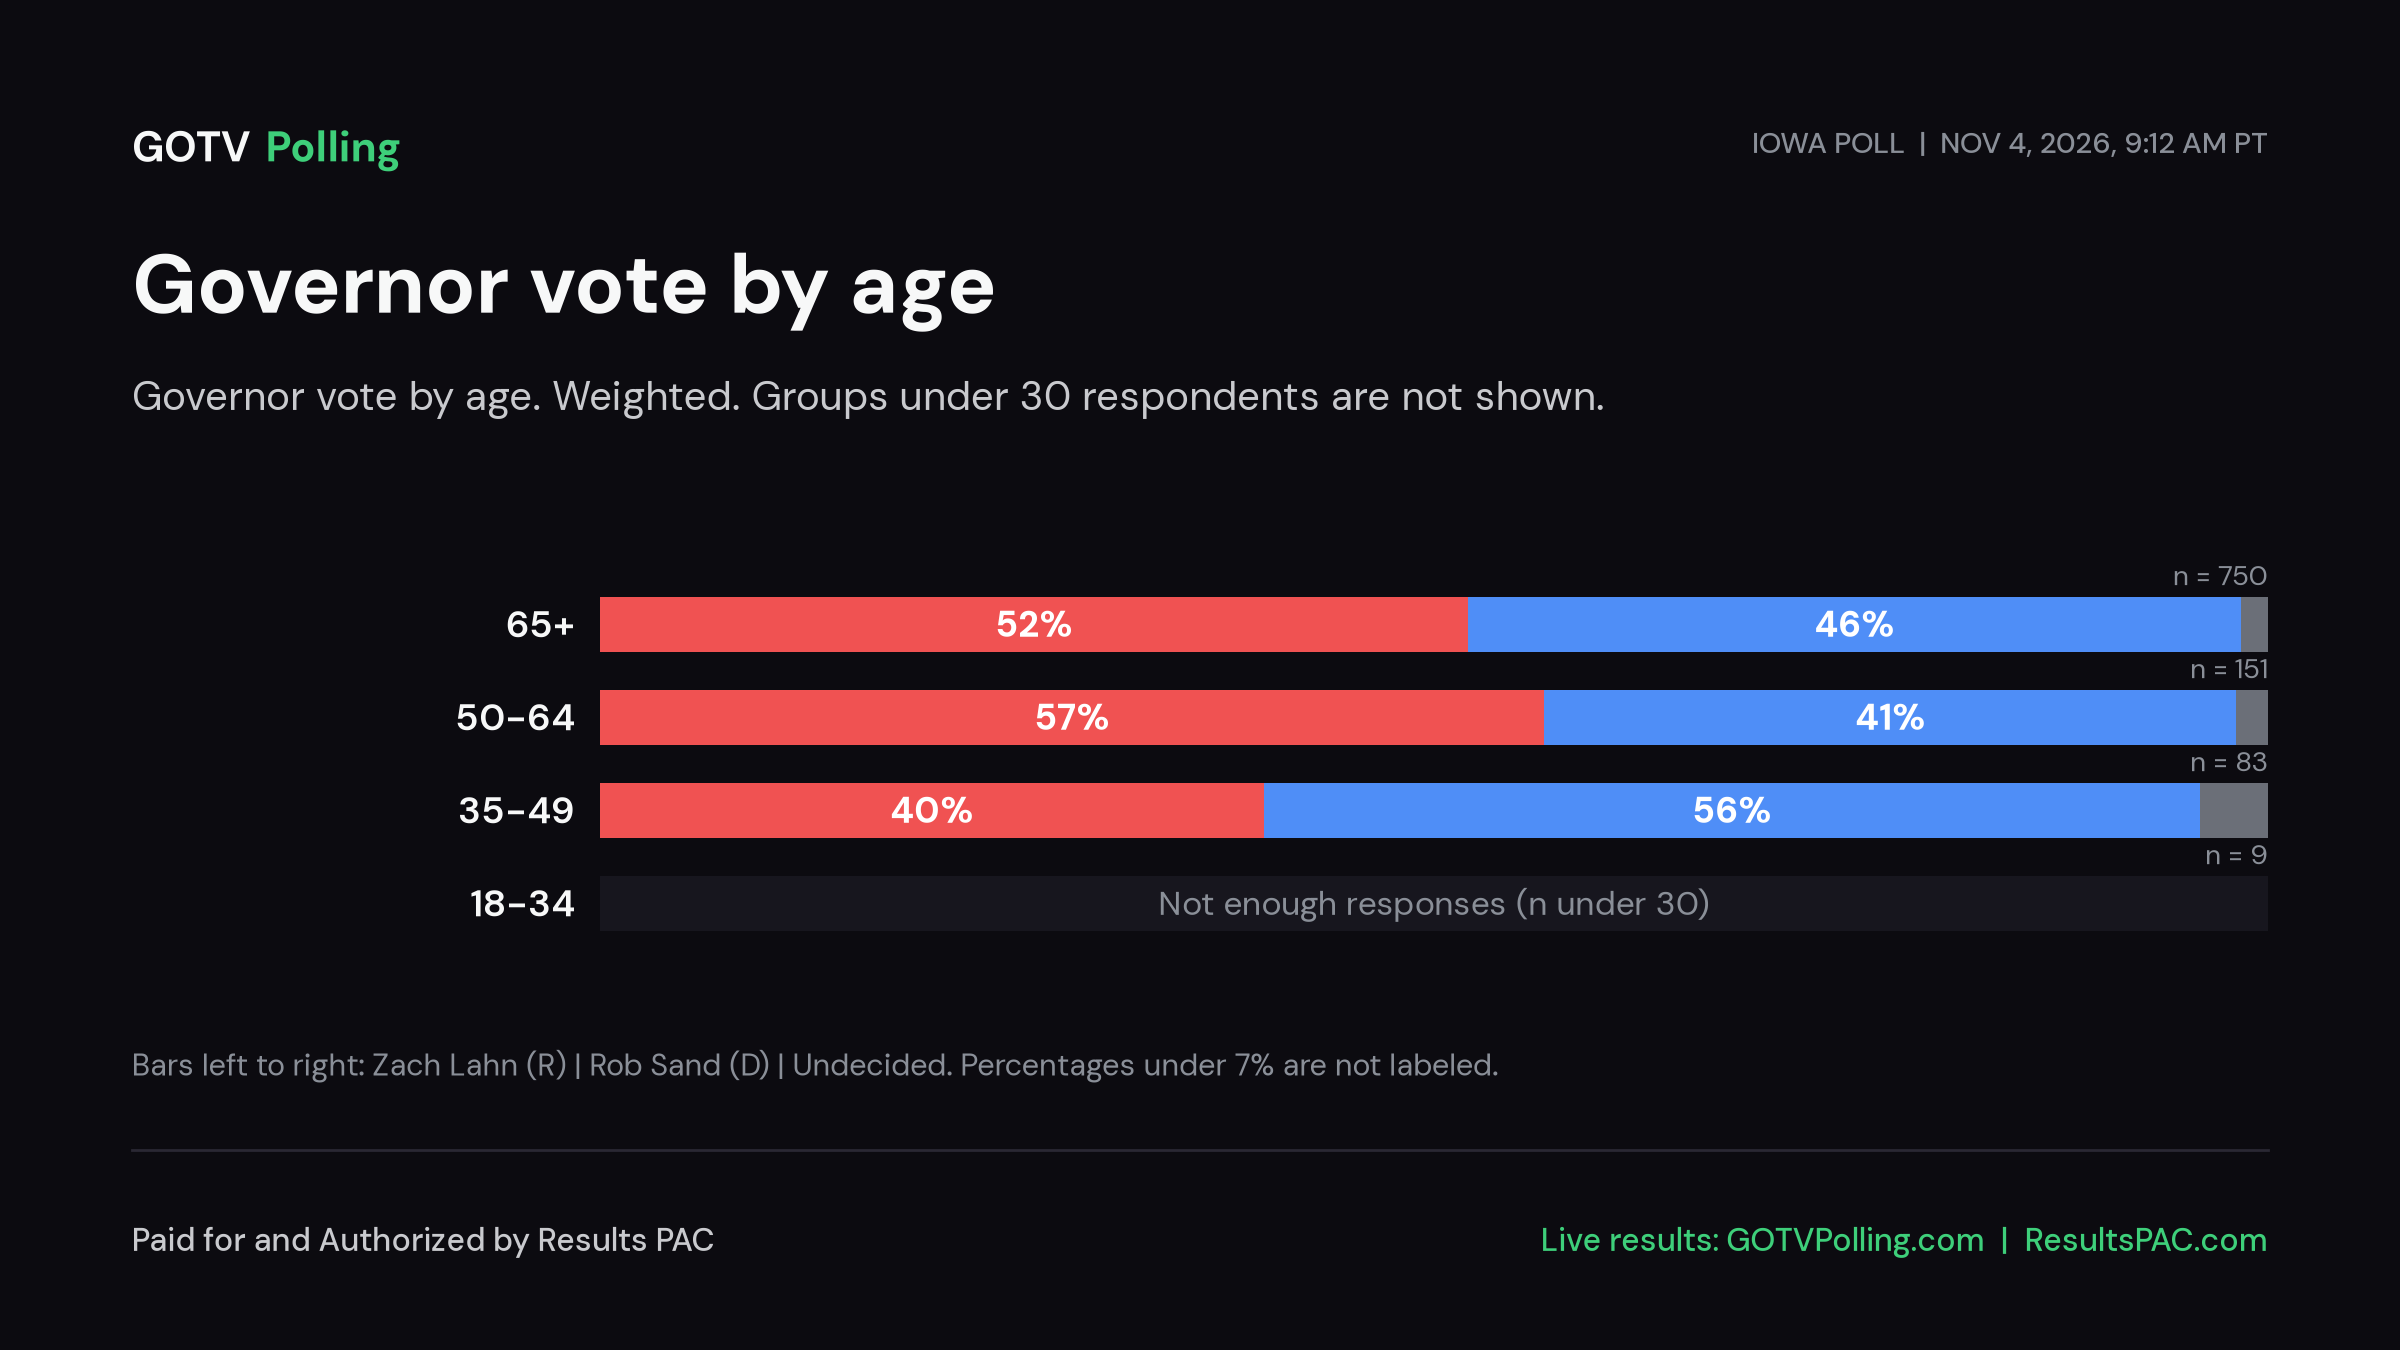
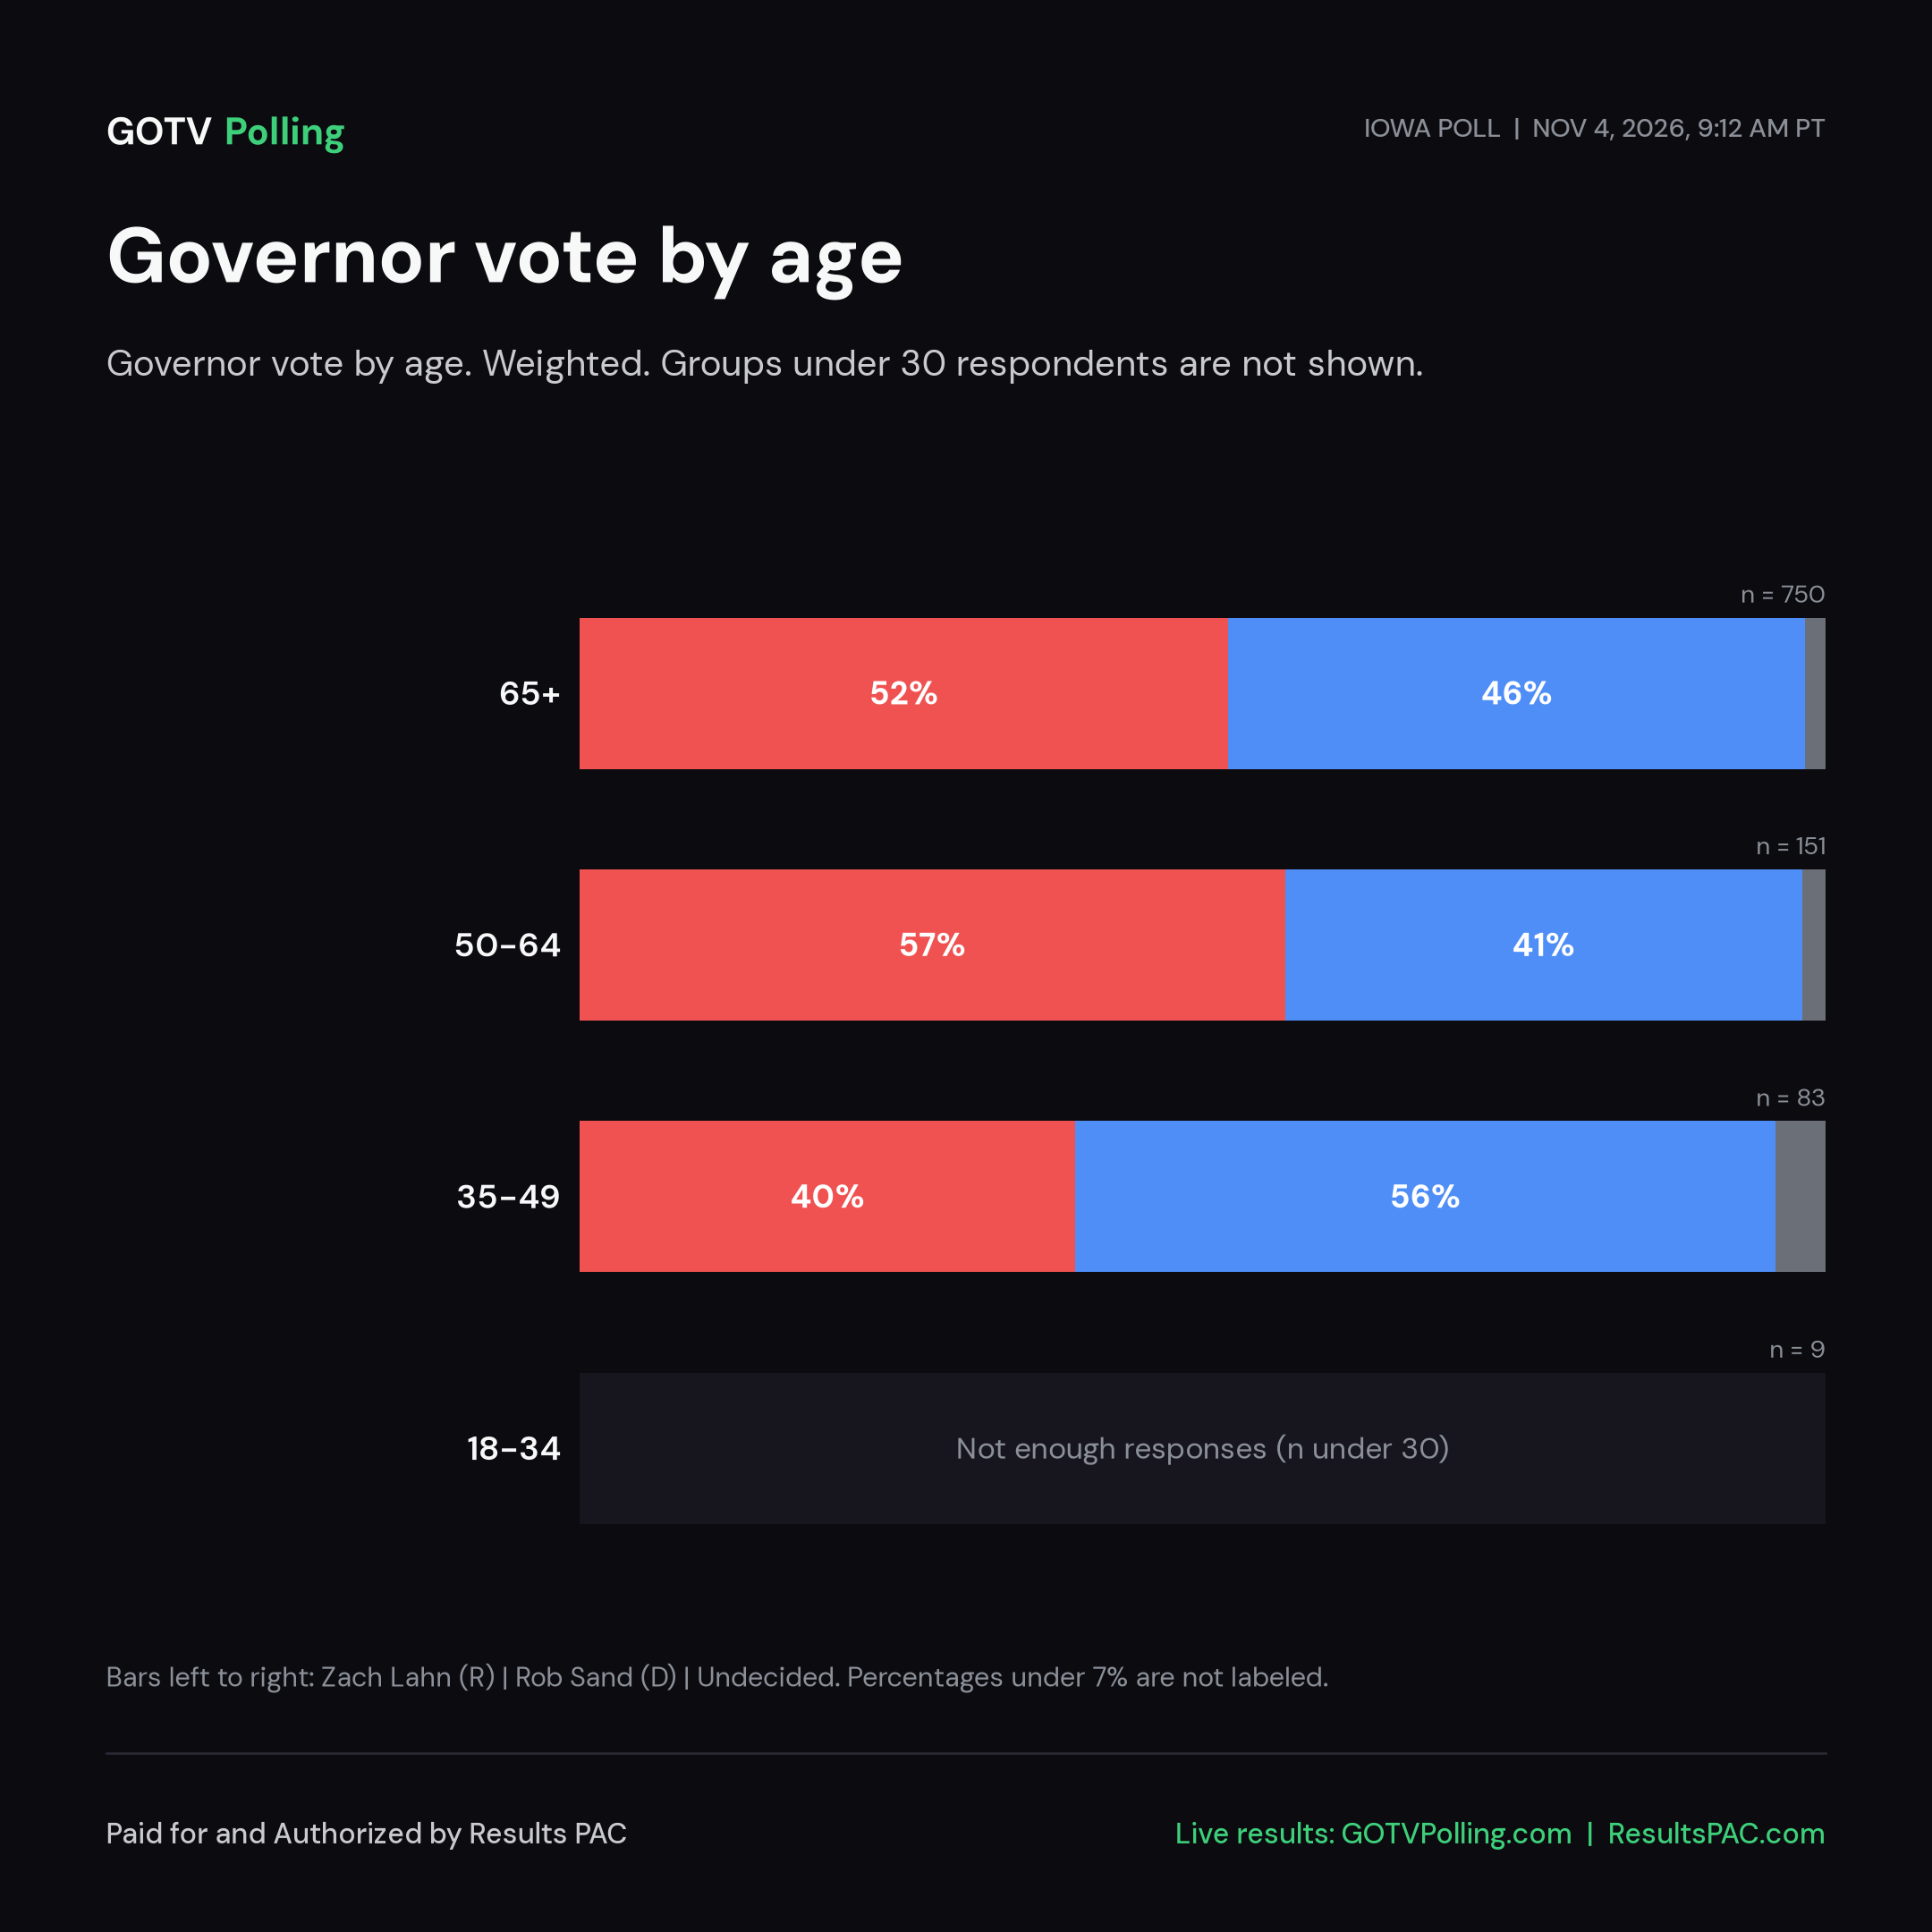
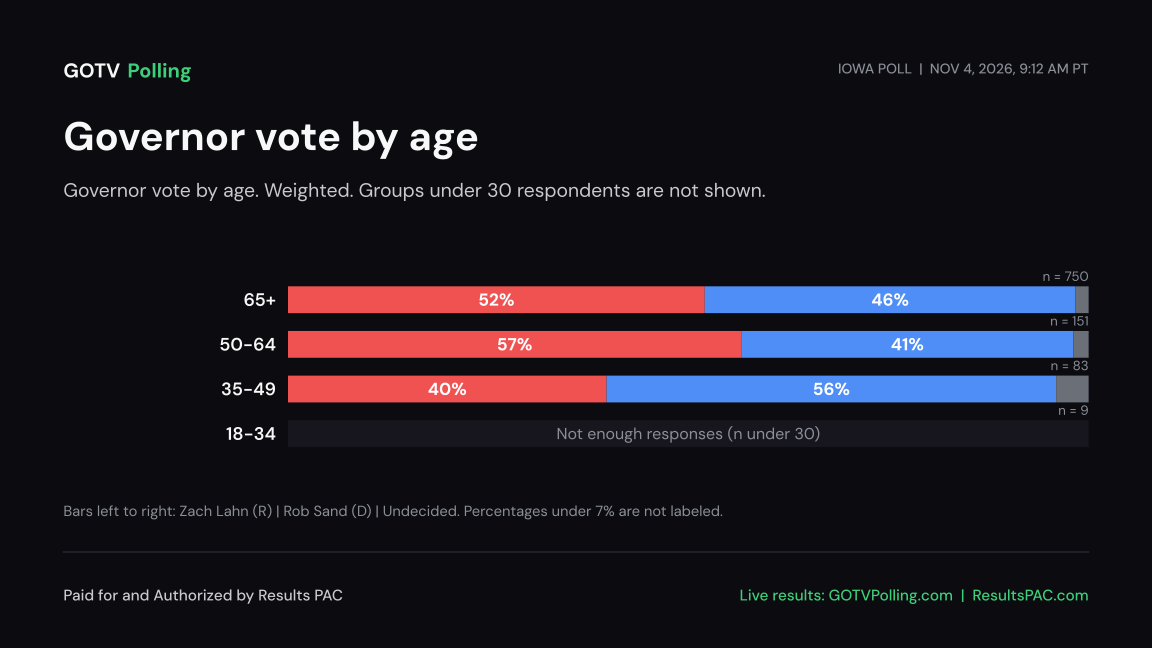
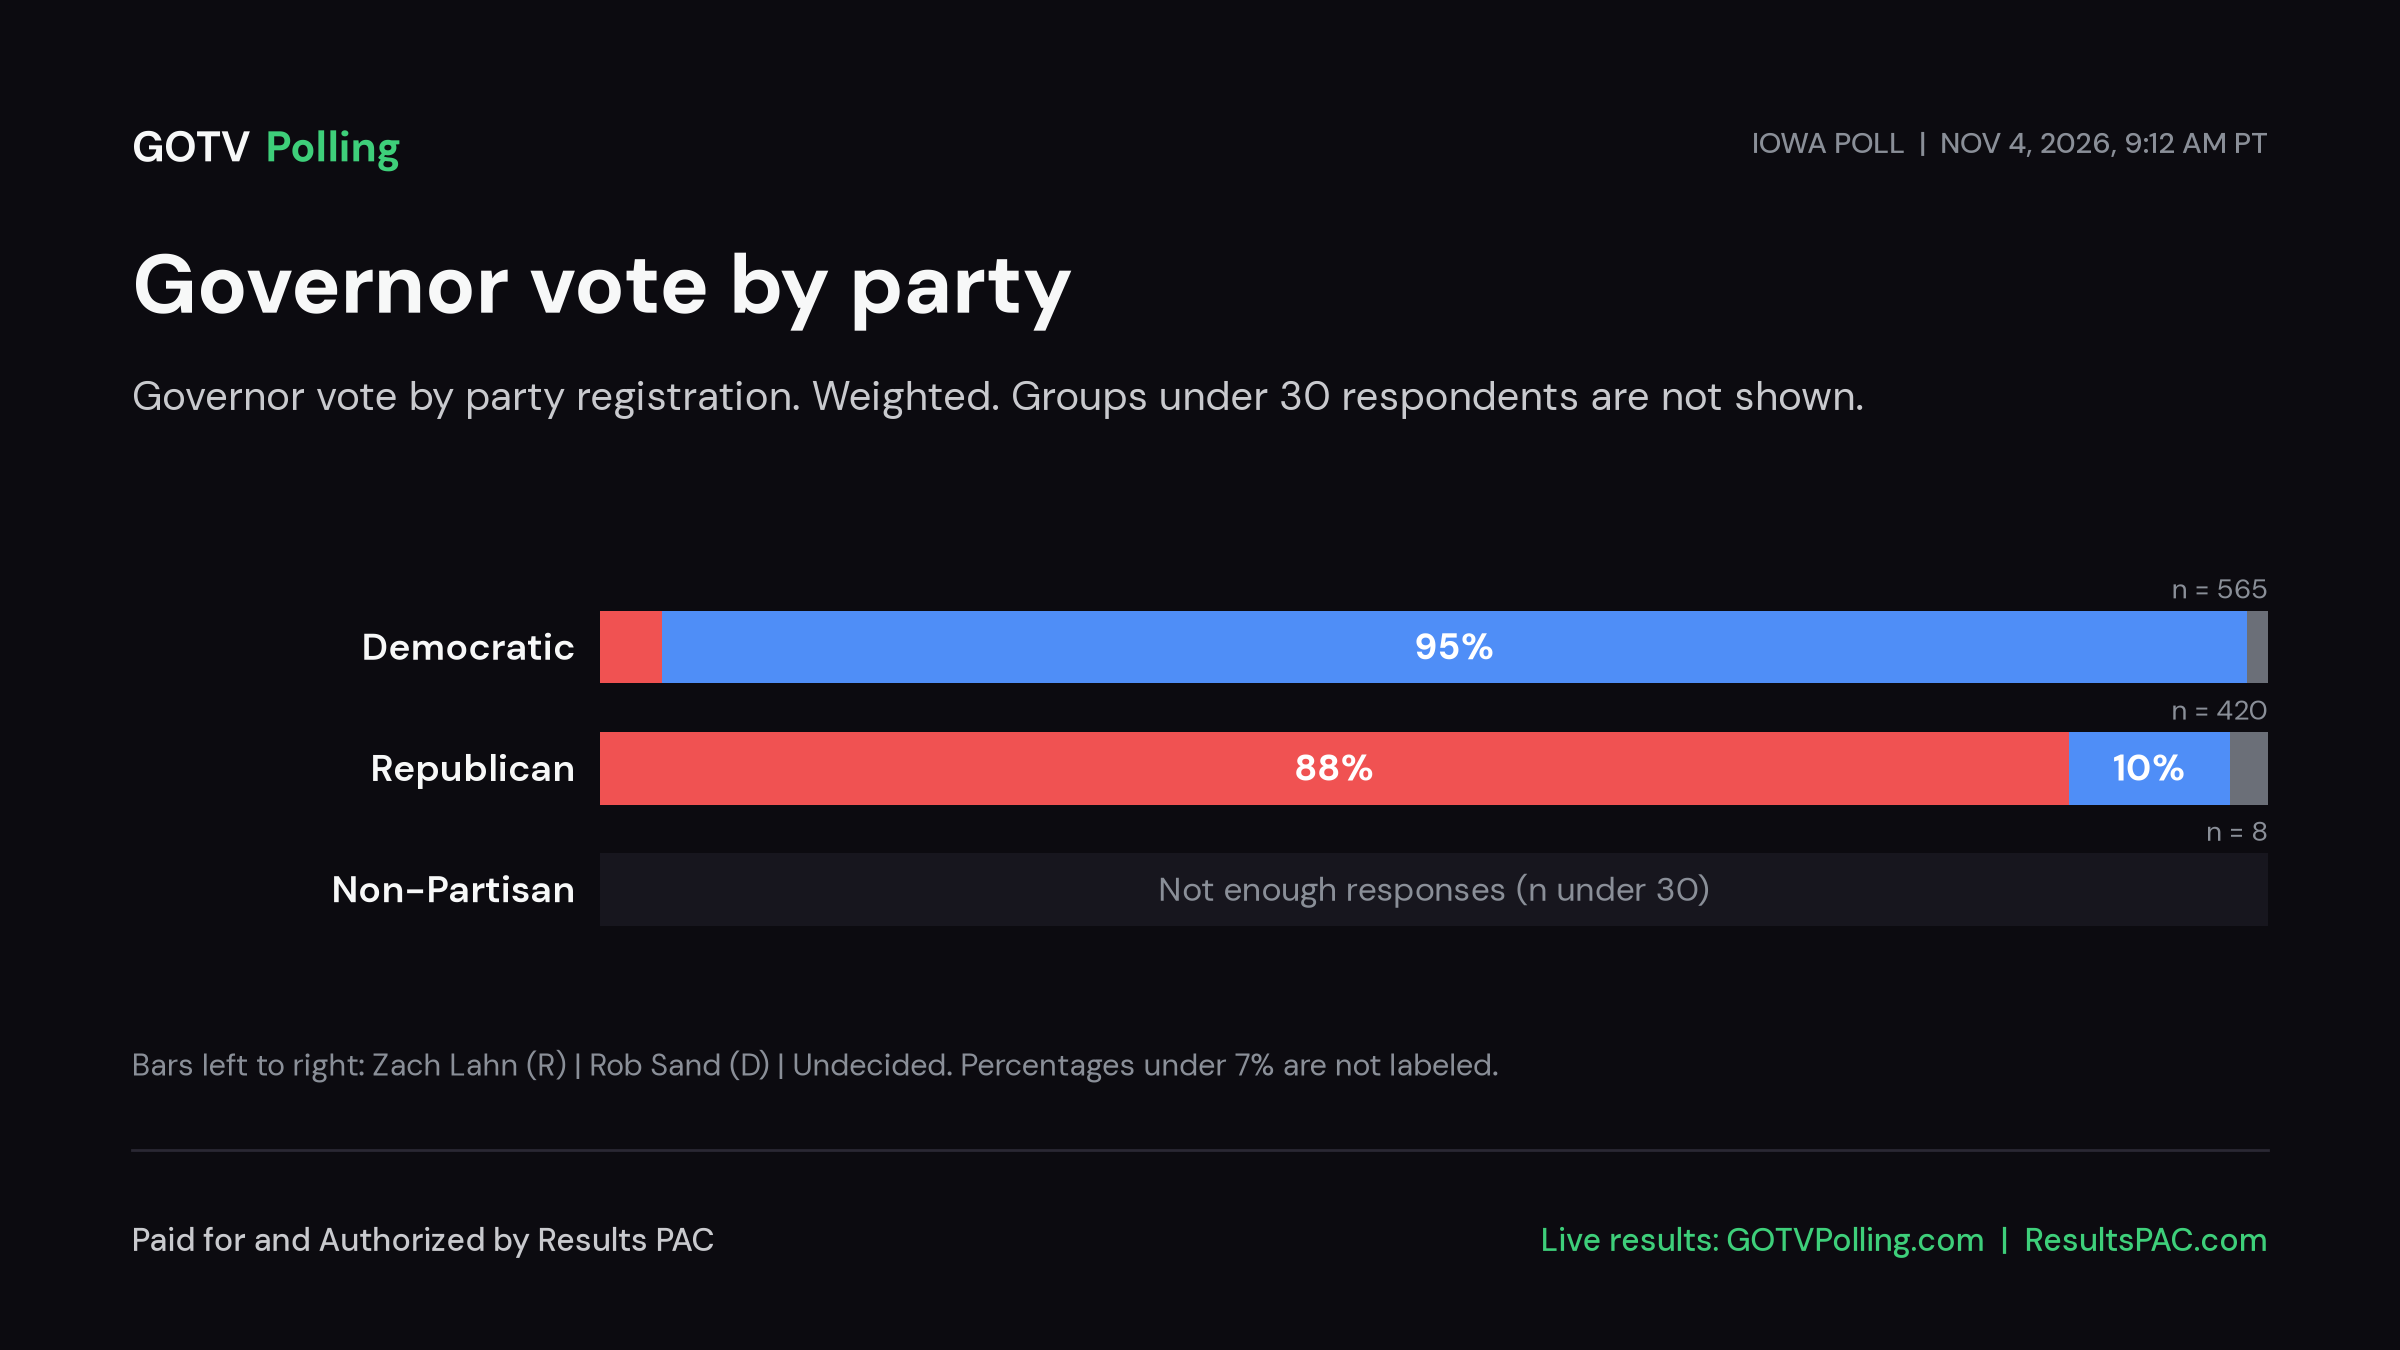
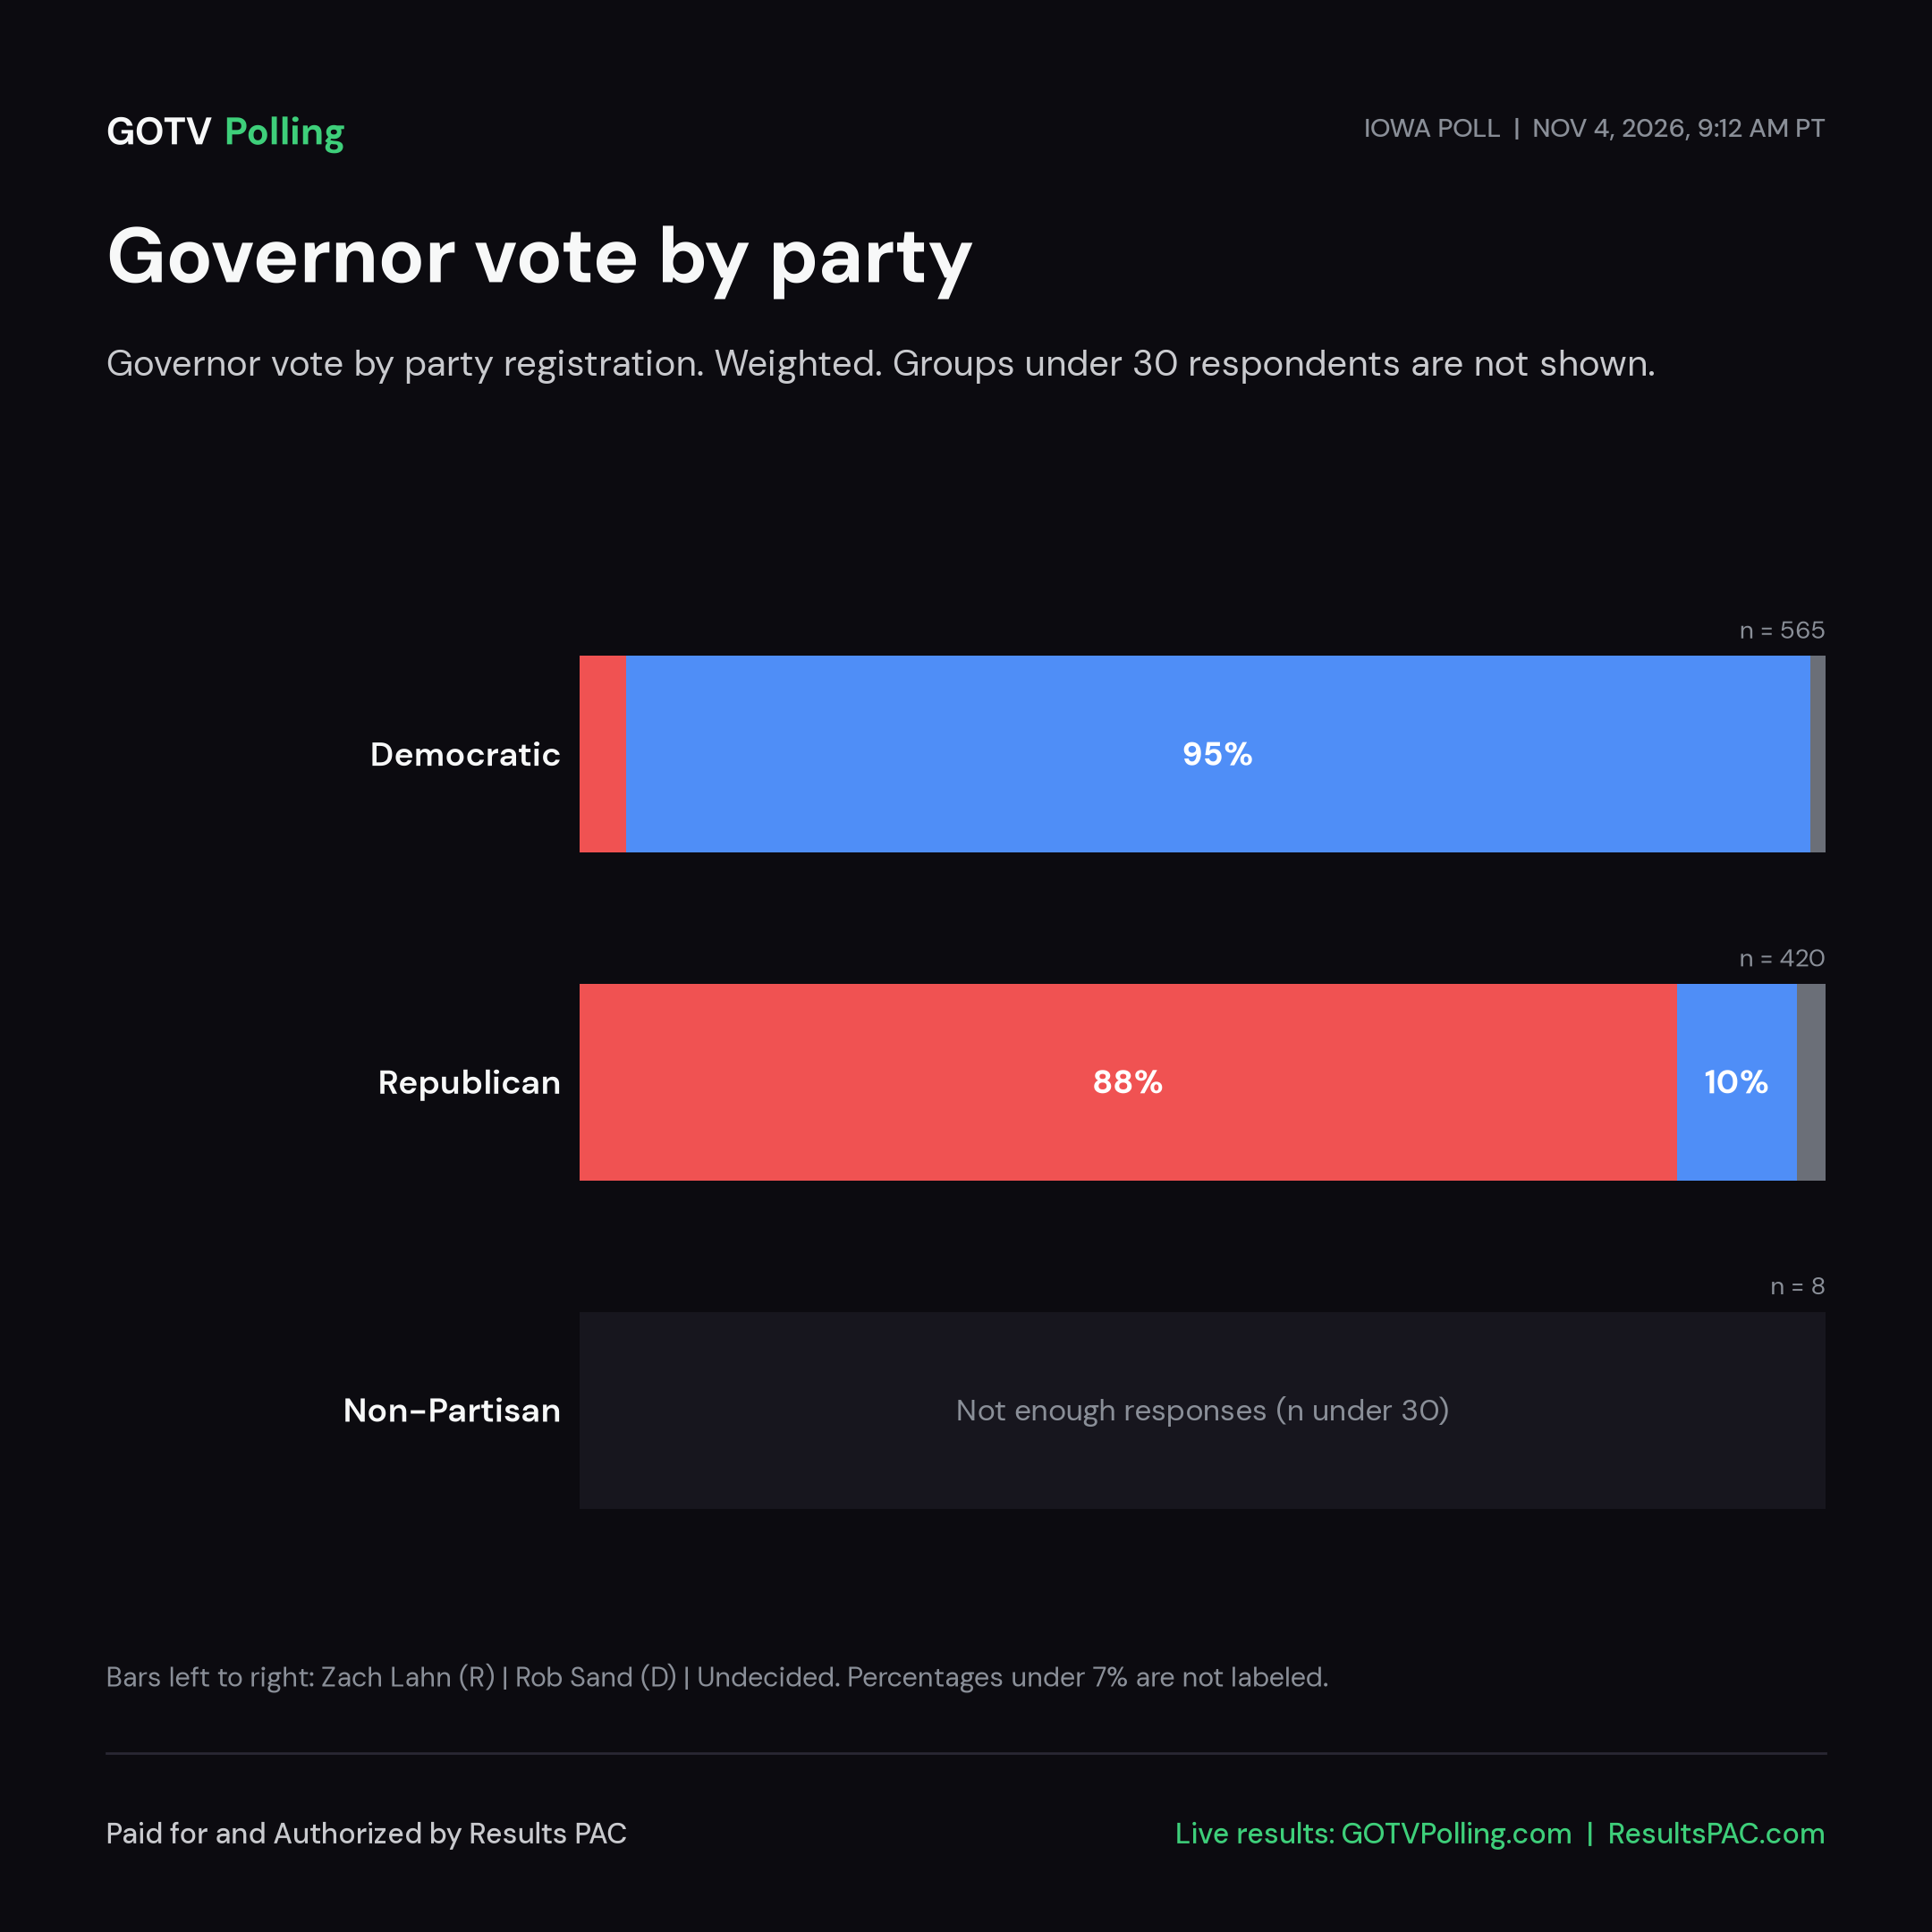
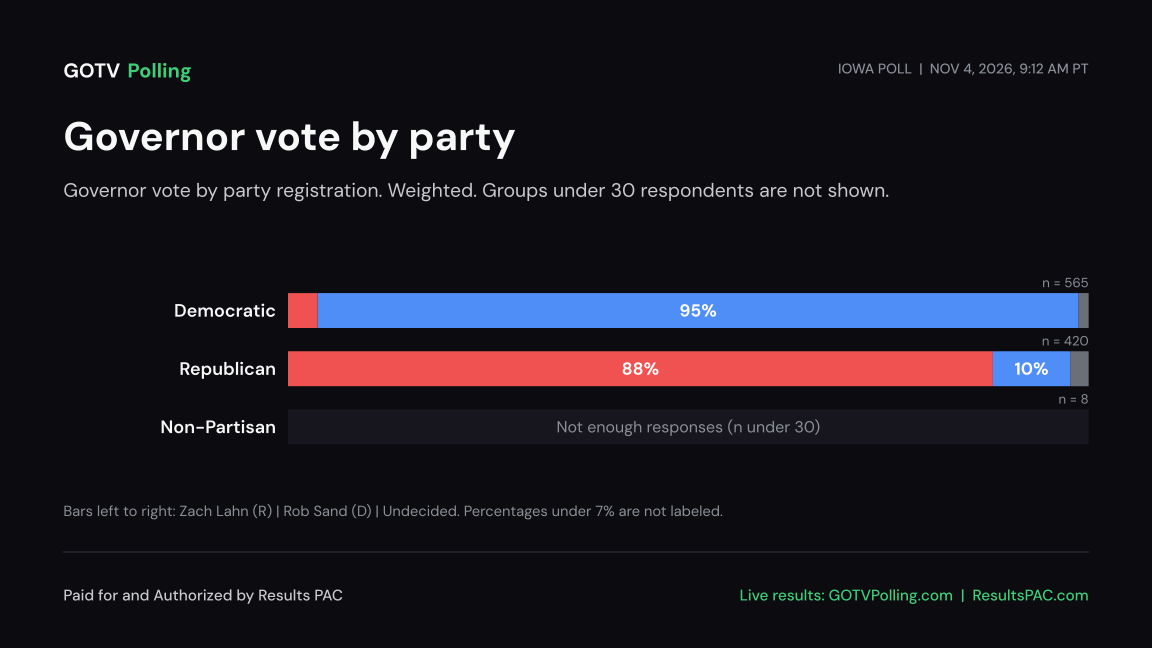
Crosstabs LiveParty registration: Democratic Sand 97%; Republican Lahn 82%Age: 65+ Sand 63%; 50-64 Sand 58%; 35-49 Sand 69%Expand to see more
Governor (IA-GOV) vote, unweighted, statewide. Groups under 30 respondents are not shown.
| Party registration | n | Rob Sand | Zach Lahn | Undecided |
|---|---|---|---|---|
| Democratic | 565 | 97.0% | 2.3% | 0.7% |
| Republican | 420 | 15.2% | 81.7% | 3.1% |
| Non-Partisan | n too small | |||
| Age | n | Rob Sand | Zach Lahn | Undecided |
|---|---|---|---|---|
| 65+ | 750 | 62.8% | 35.7% | 1.5% |
| 50-64 | 151 | 57.6% | 40.4% | 2.0% |
| 35-49 | 83 | 68.7% | 27.7% | 3.6% |
| 18-34 | n too small | |||
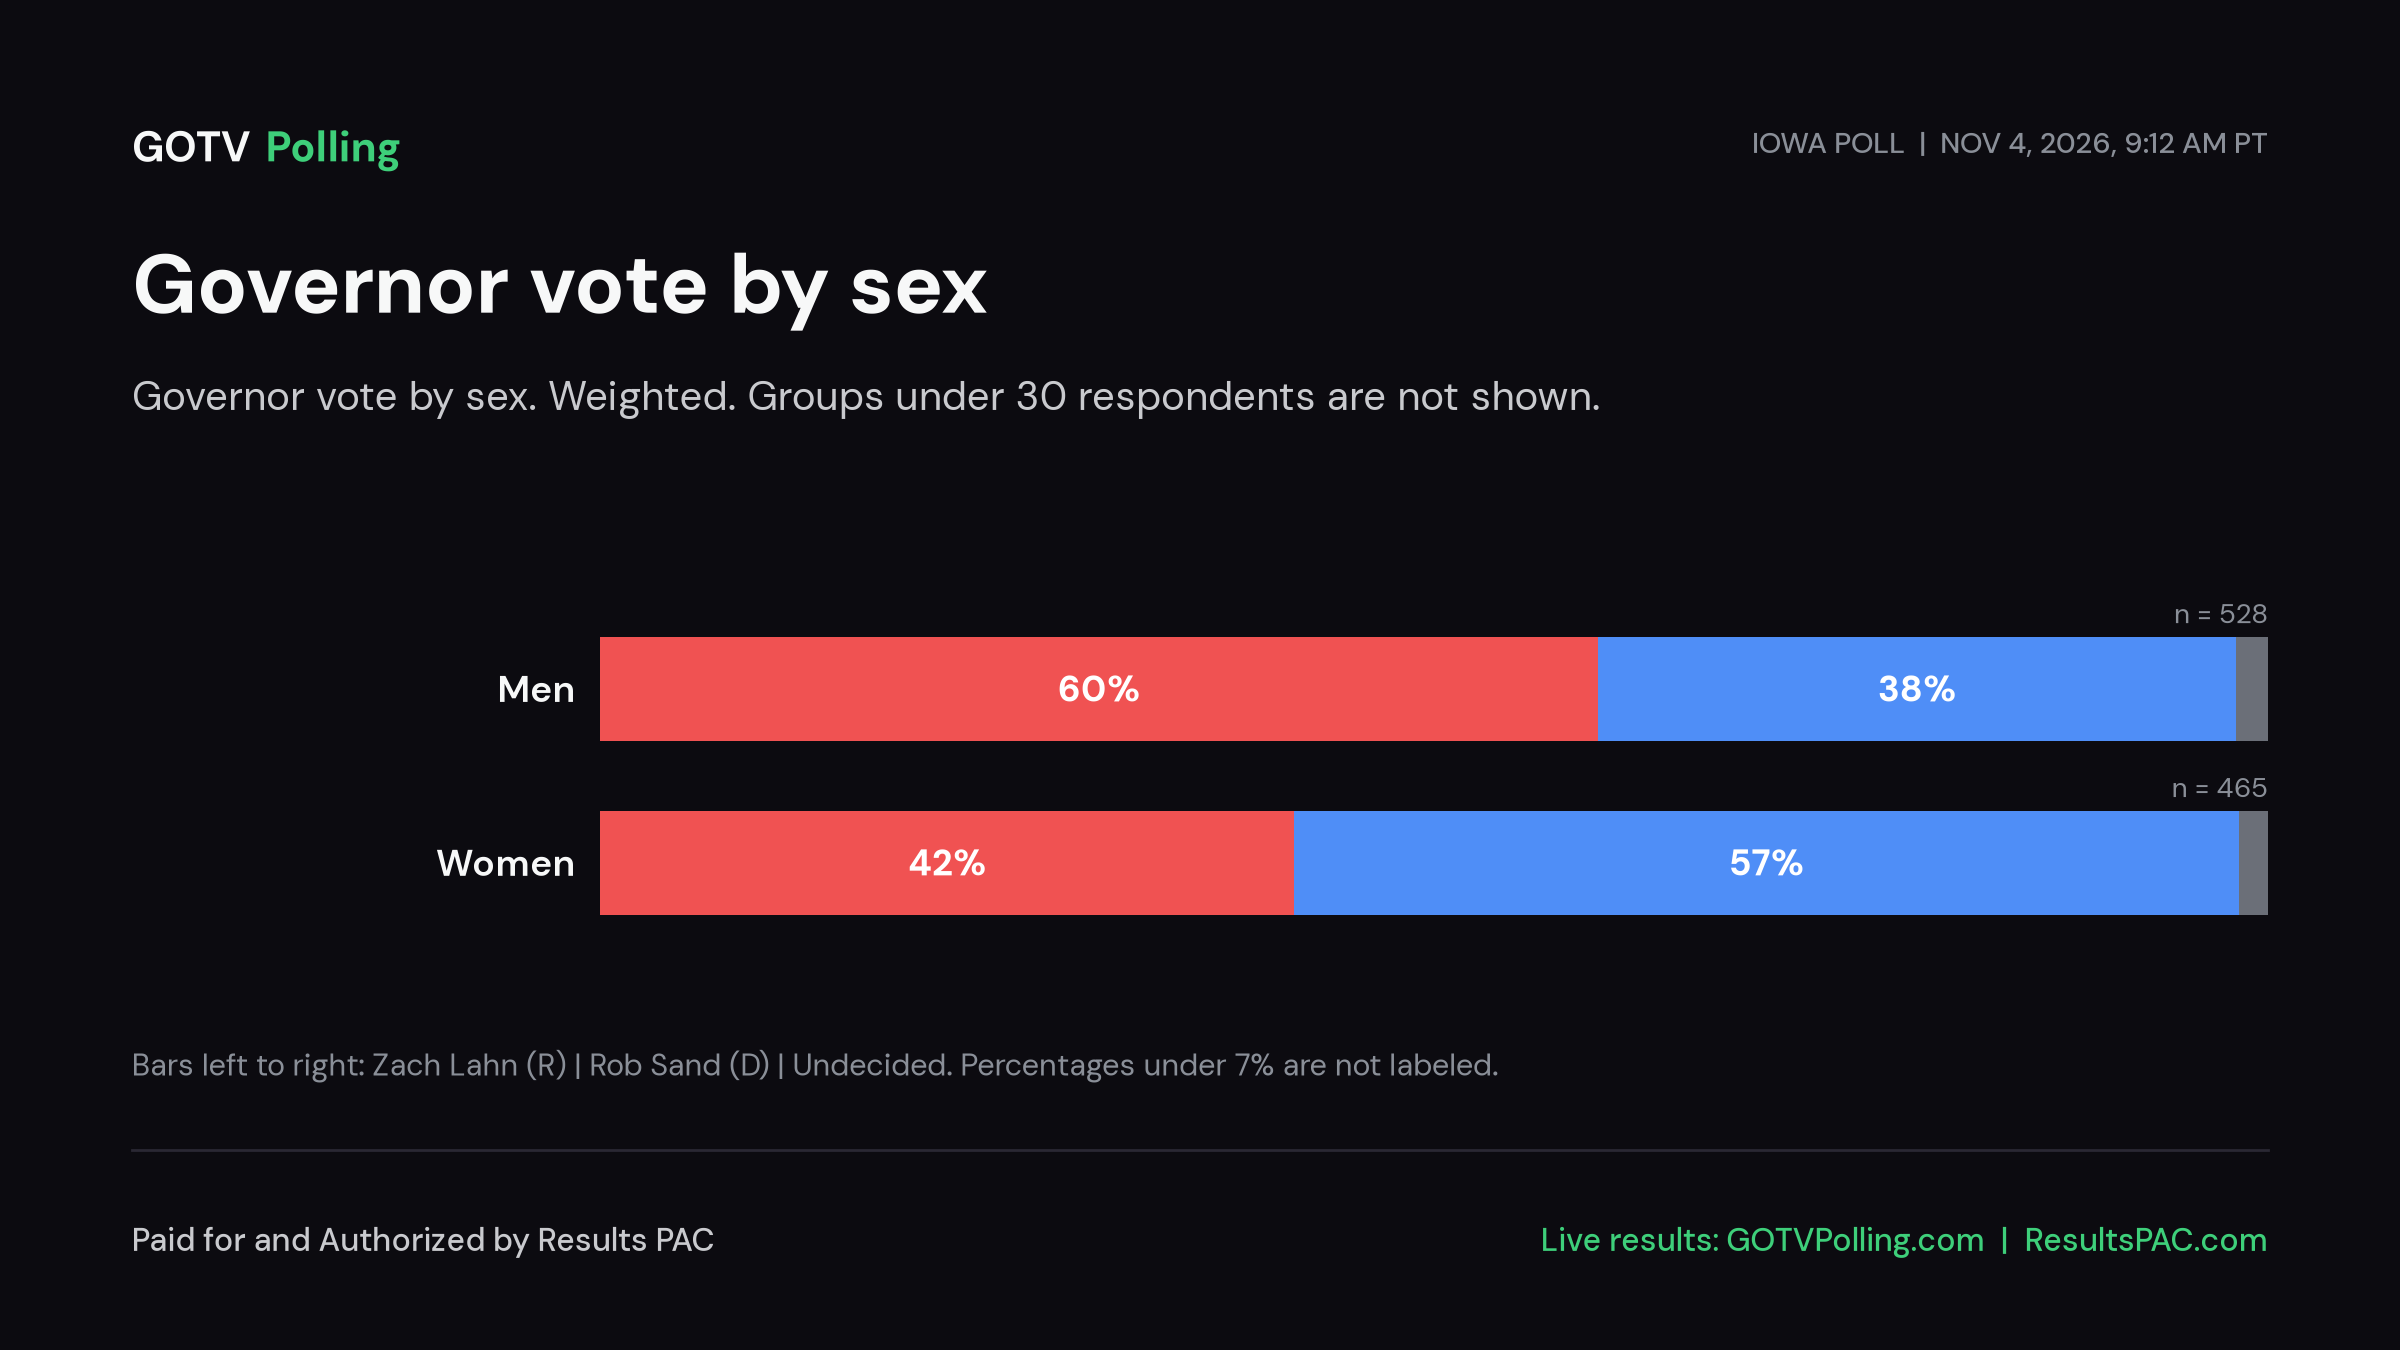
| Sex | n | Rob Sand | Zach Lahn | Undecided |
|---|---|---|---|---|
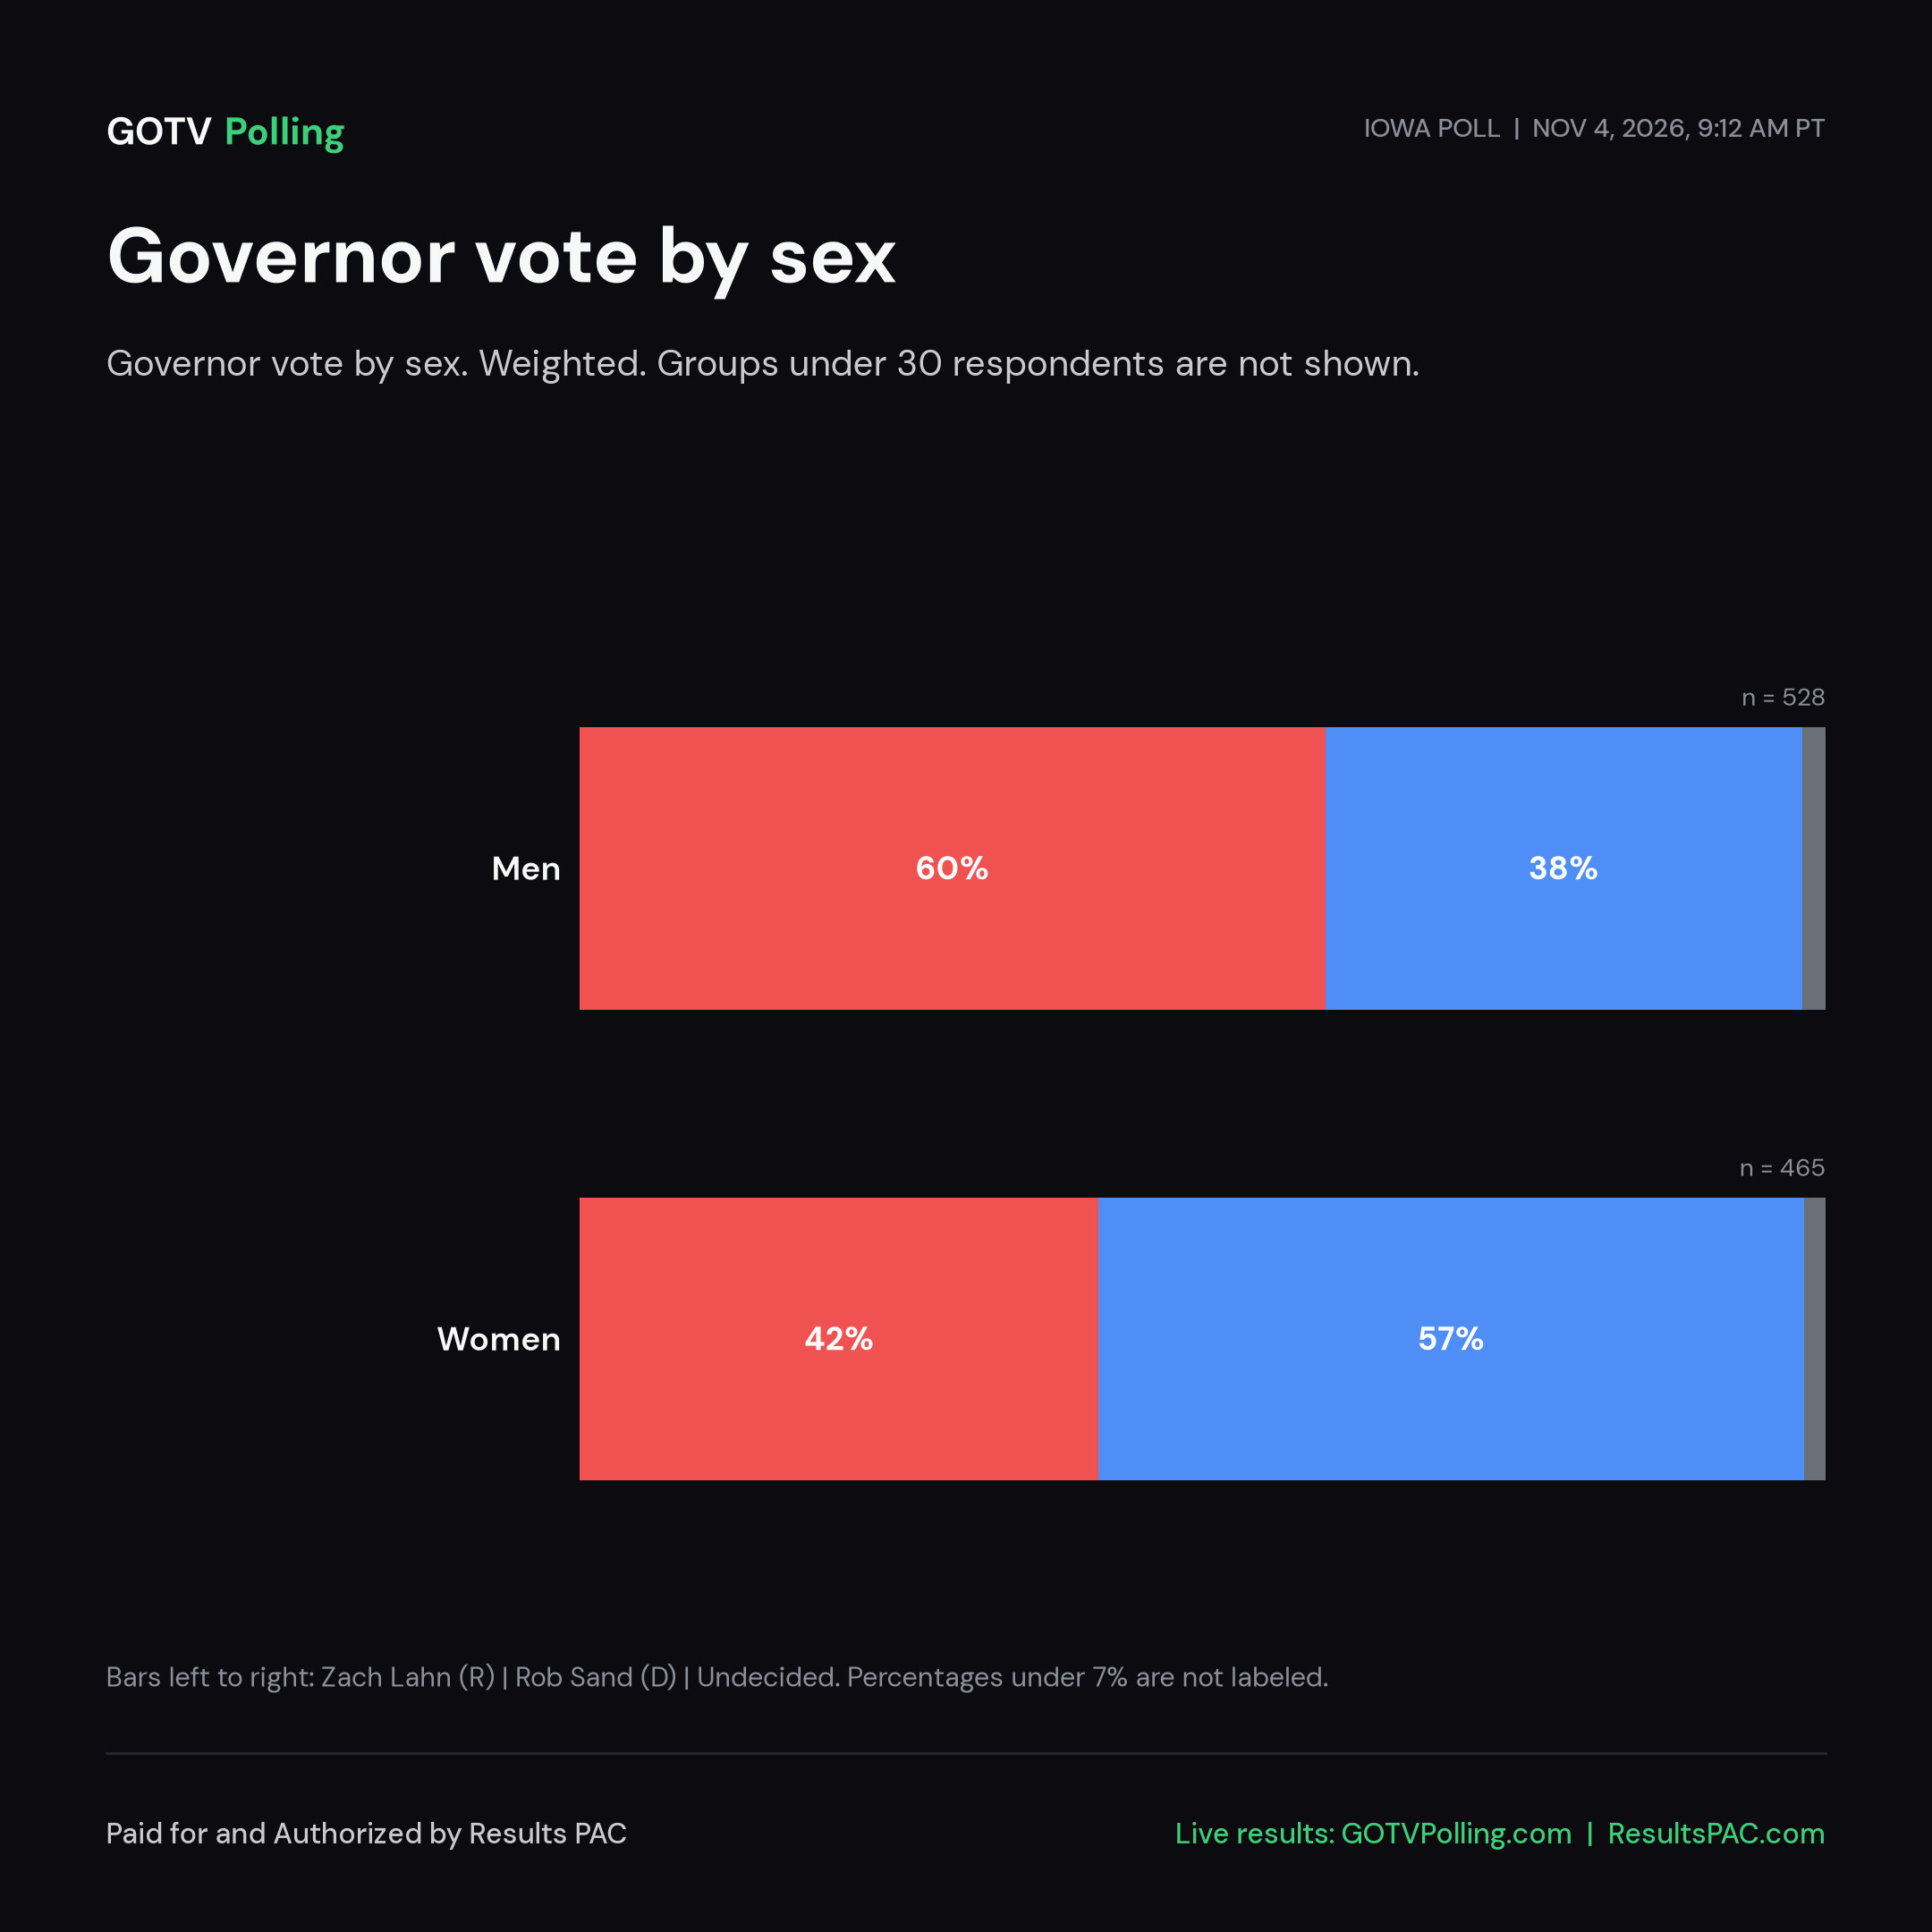
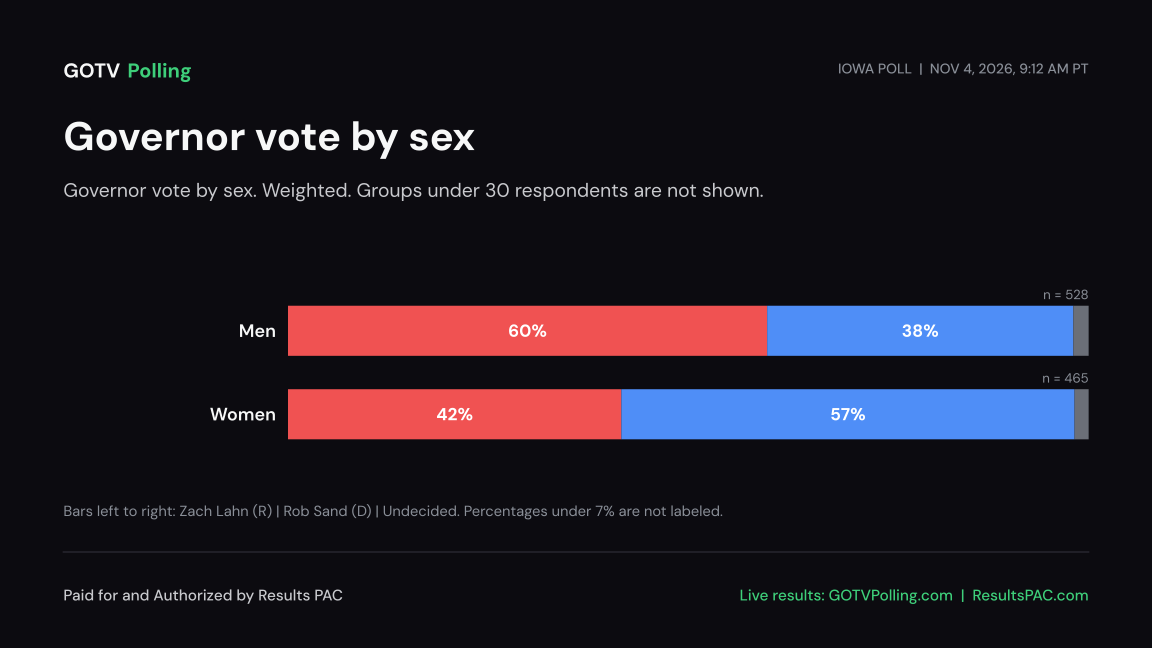
| Men | 528 | 54.4% | 43.9% | 1.7% |
| Women | 465 | 71.6% | 26.7% | 1.7% |
Graphics downloads for IA-GOV #IAGOV
- Governor: PNG 1200x675 · PNG 1080x1080 · SVG
- Governor by age: PNG 1200x675 · PNG 1080x1080 · SVG
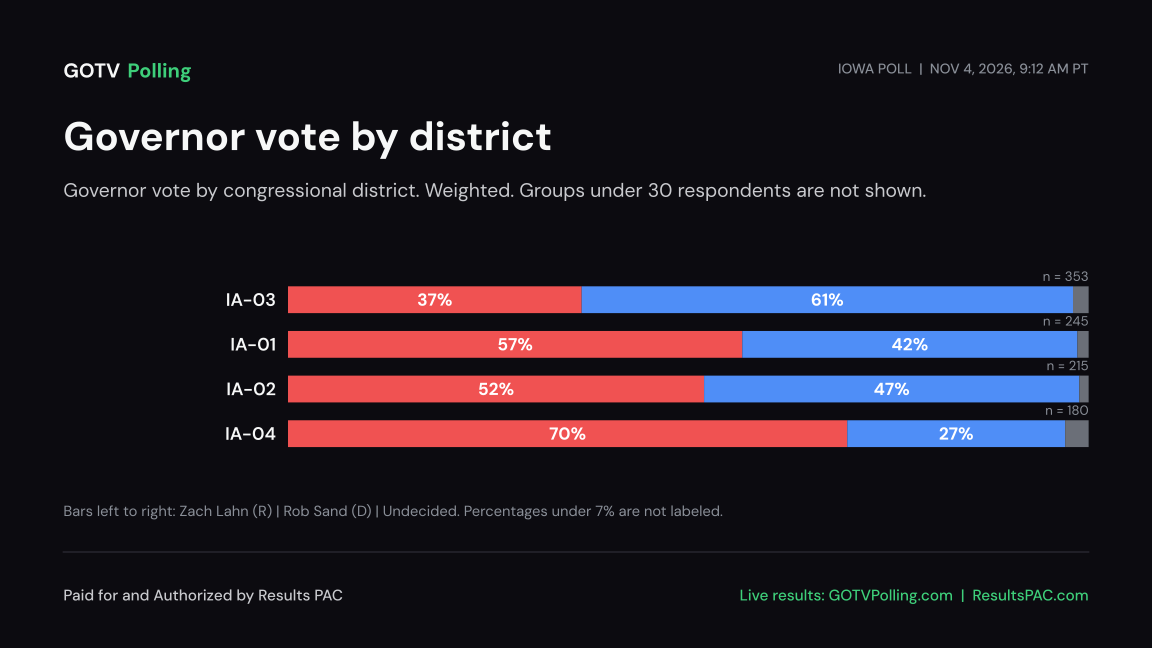
- Governor by district: PNG 1200x675 · PNG 1080x1080 · SVG
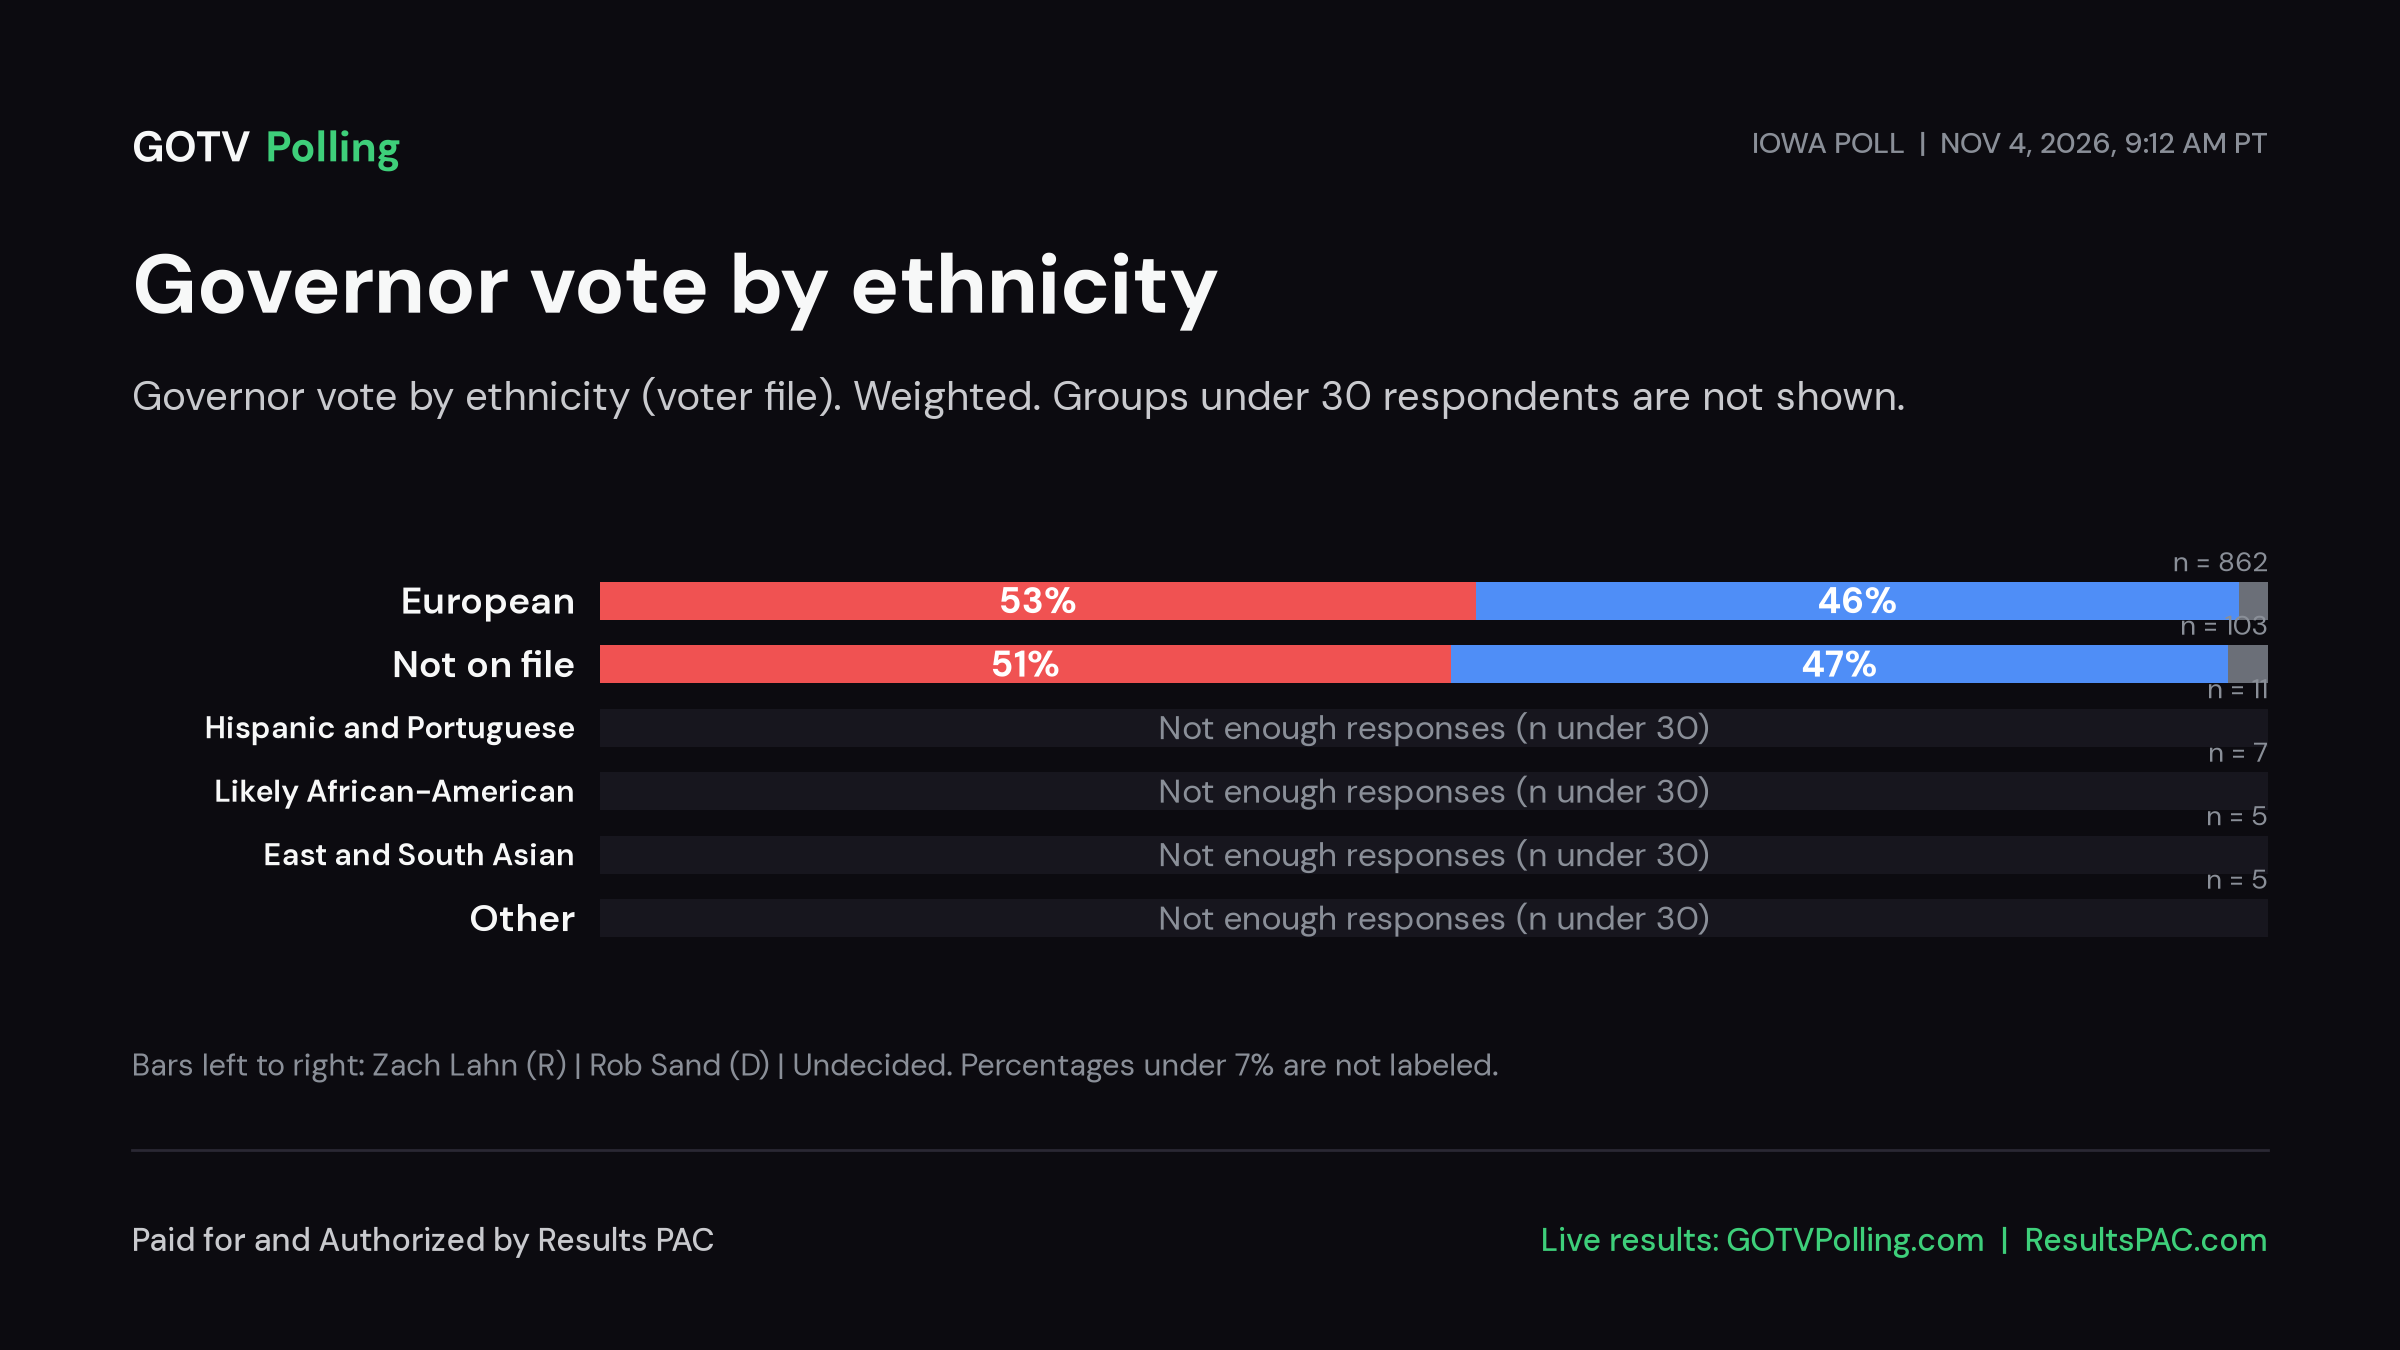
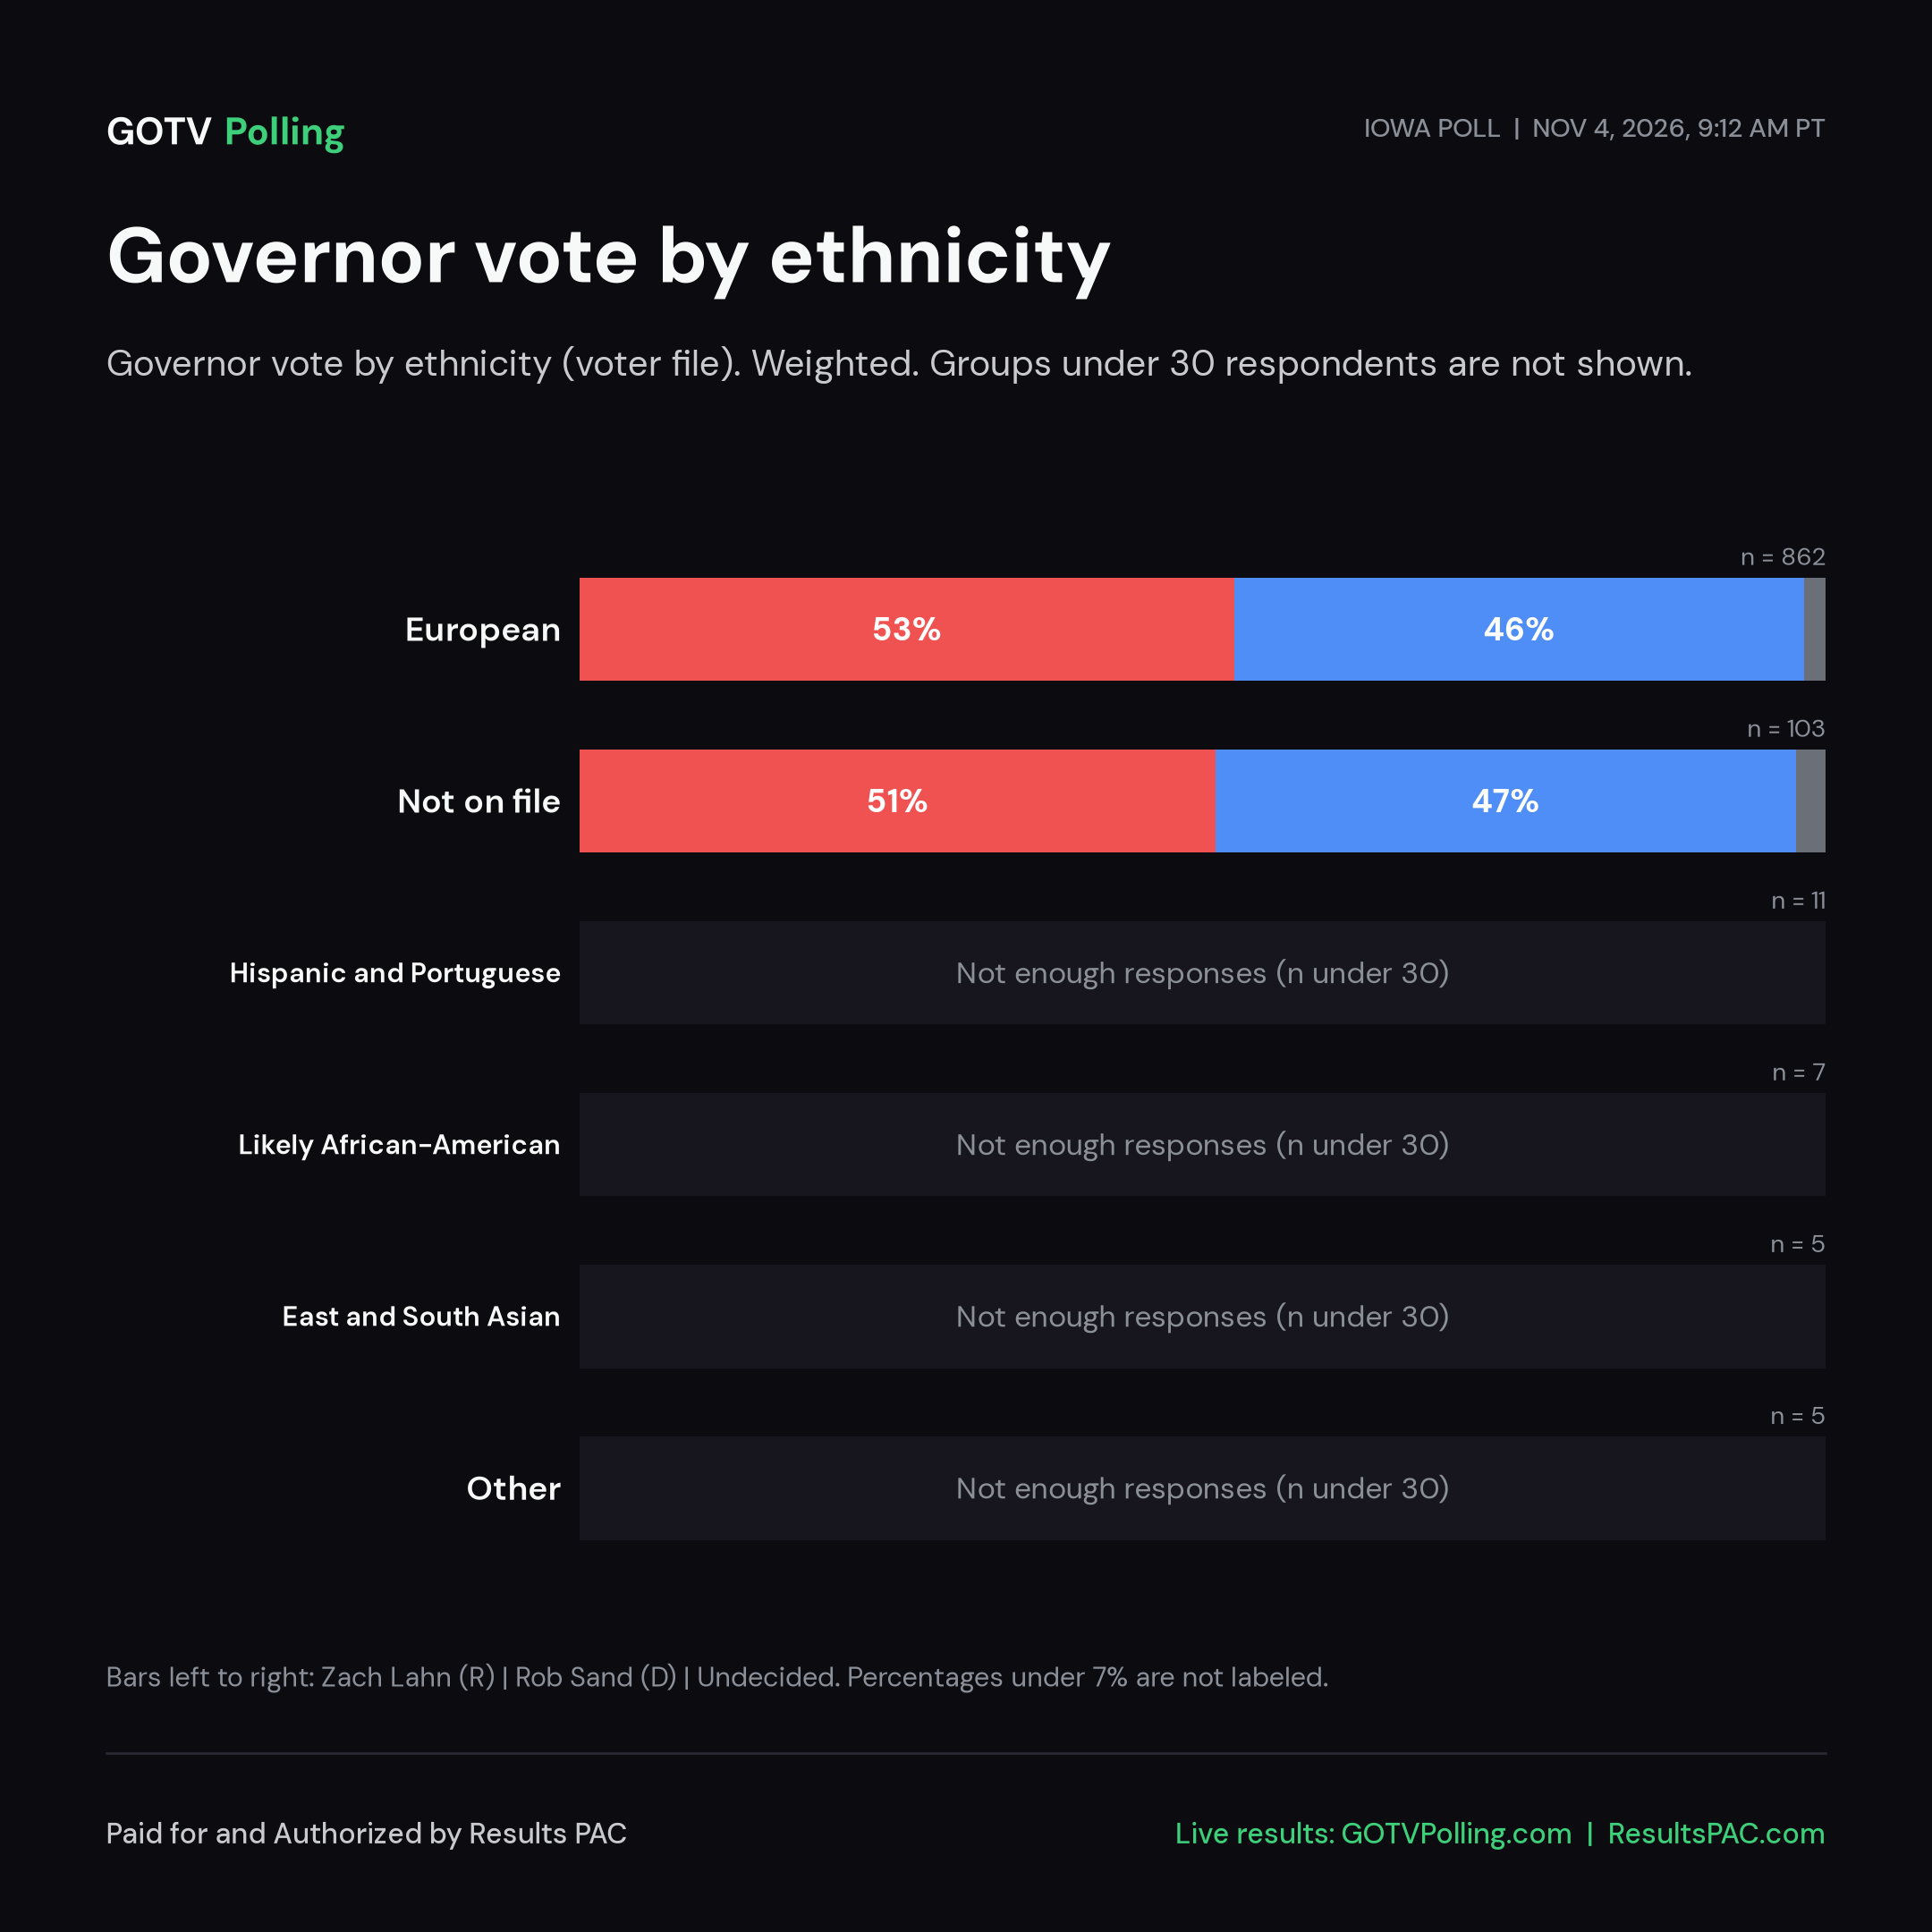
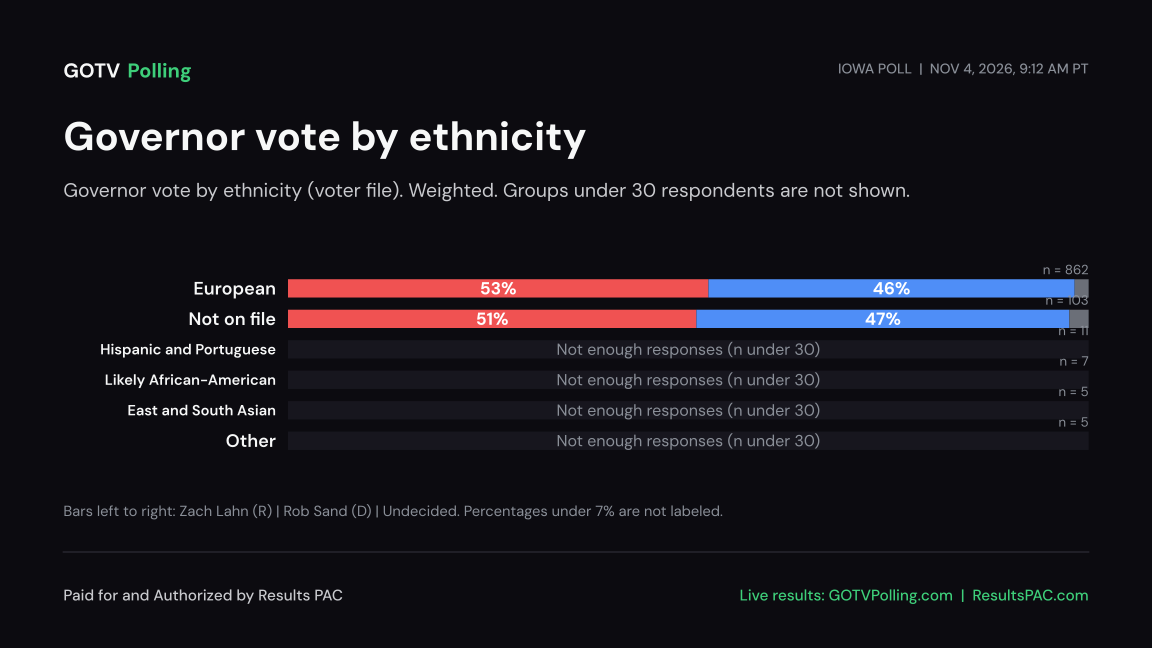
- Governor by ethnicity: PNG 1200x675 · PNG 1080x1080 · SVG
- Governor by party: PNG 1200x675 · PNG 1080x1080 · SVG
- Governor by sex: PNG 1200x675 · PNG 1080x1080 · SVG
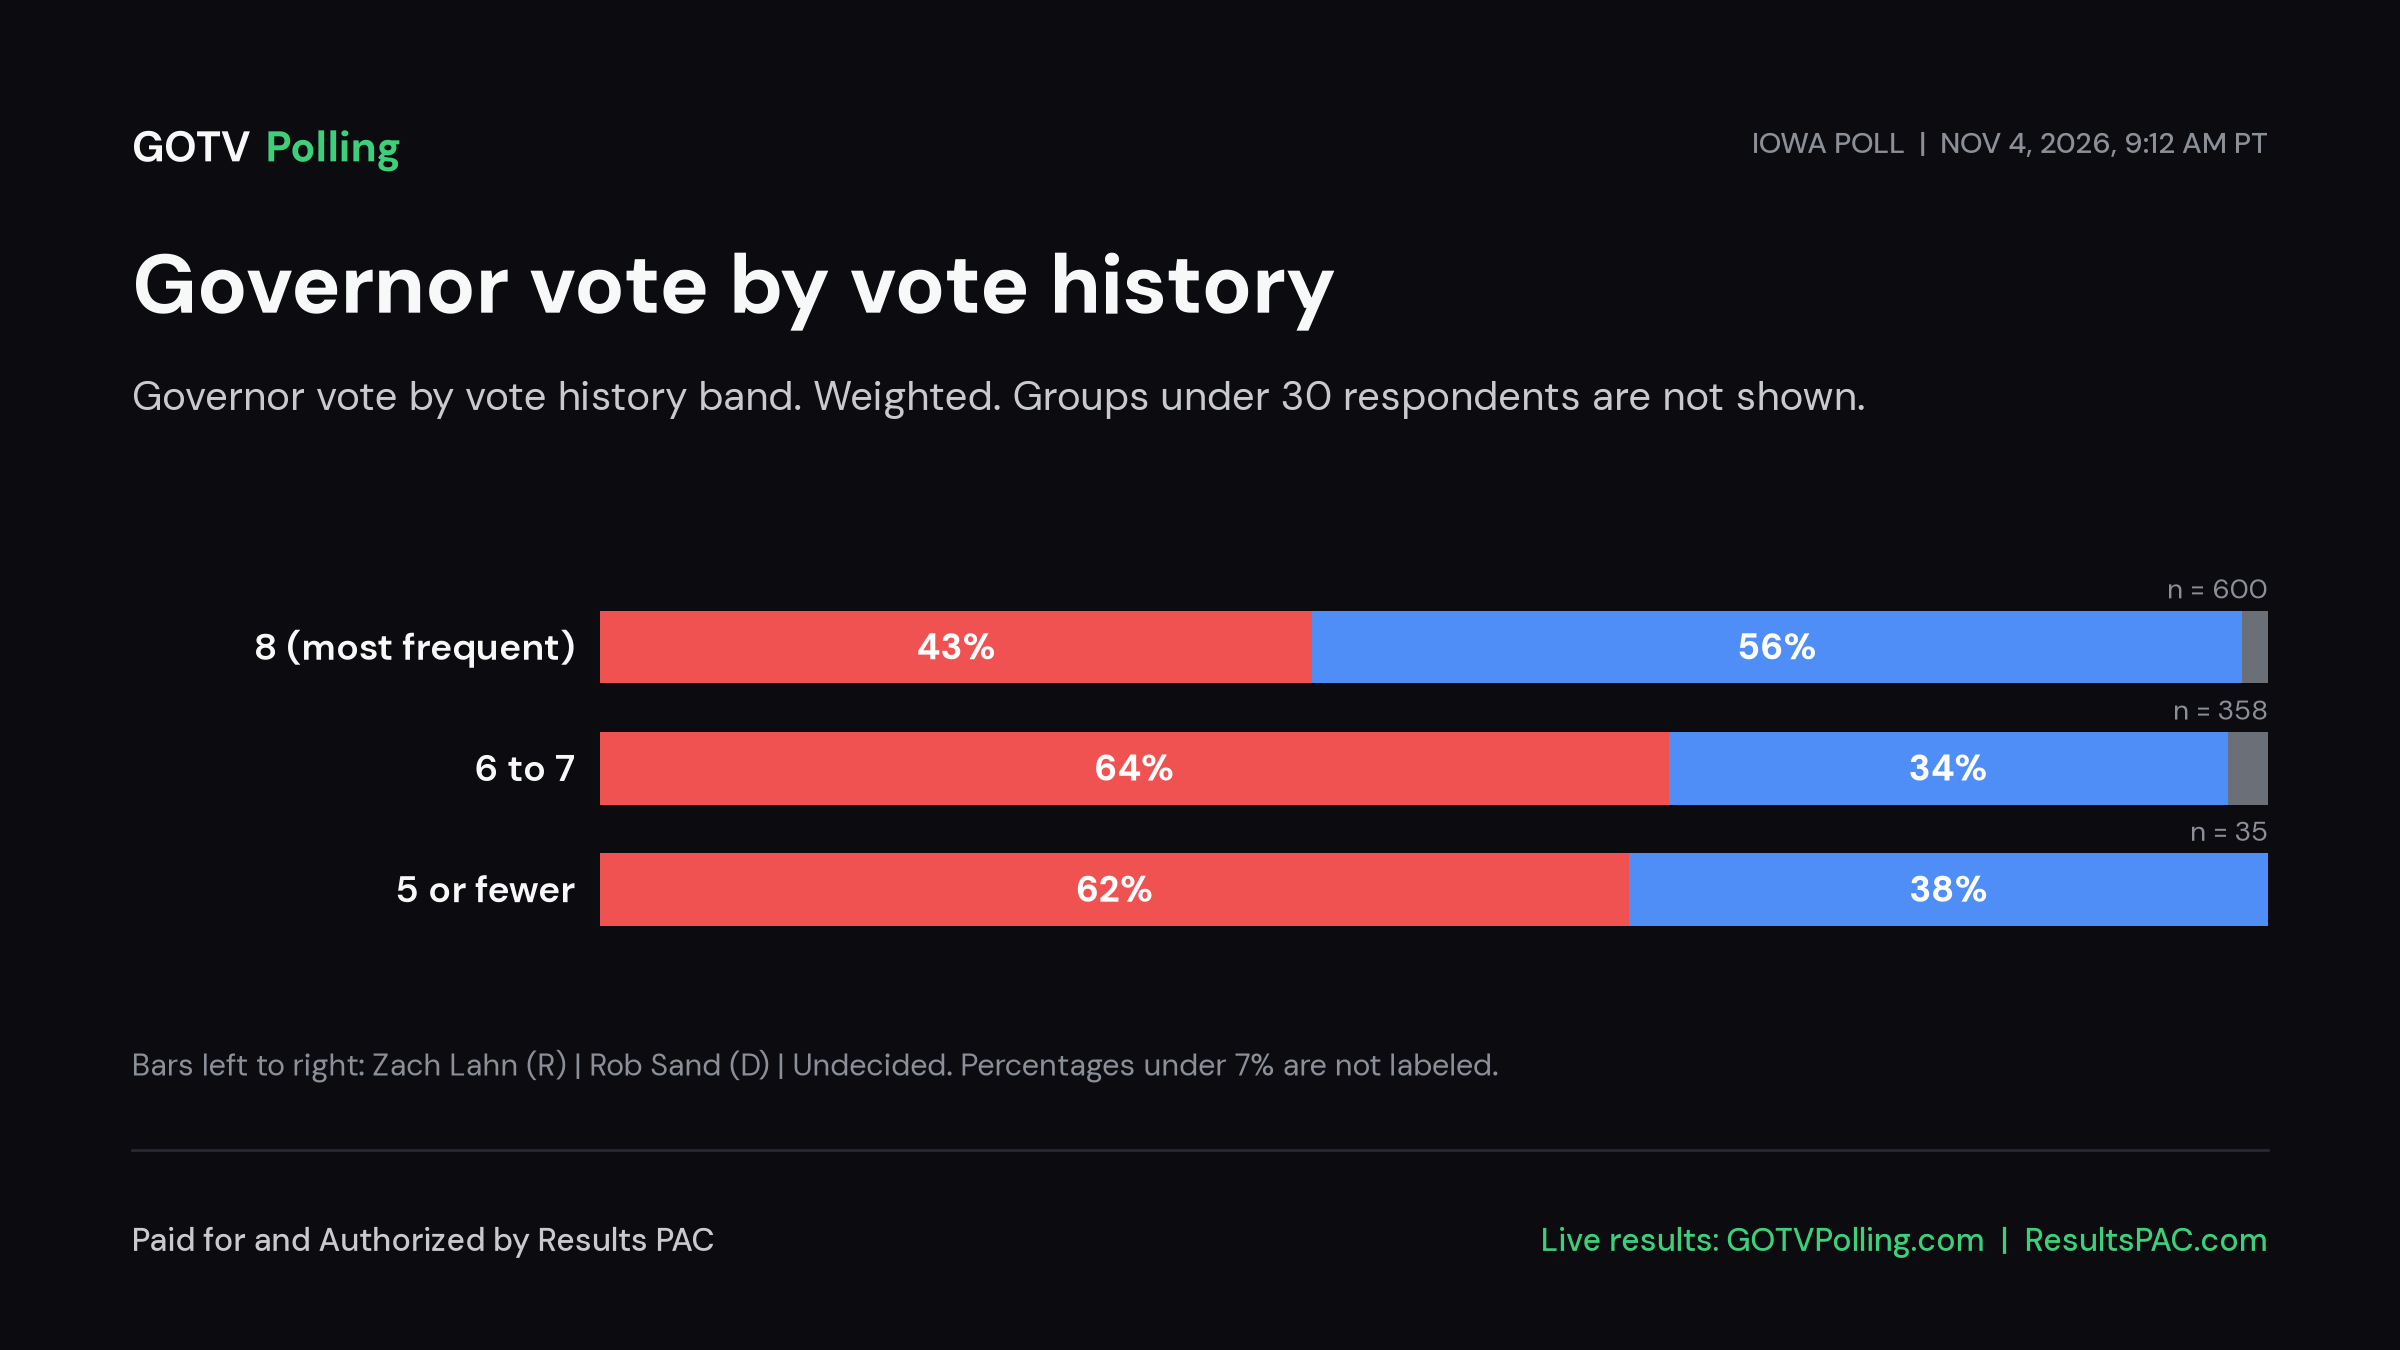
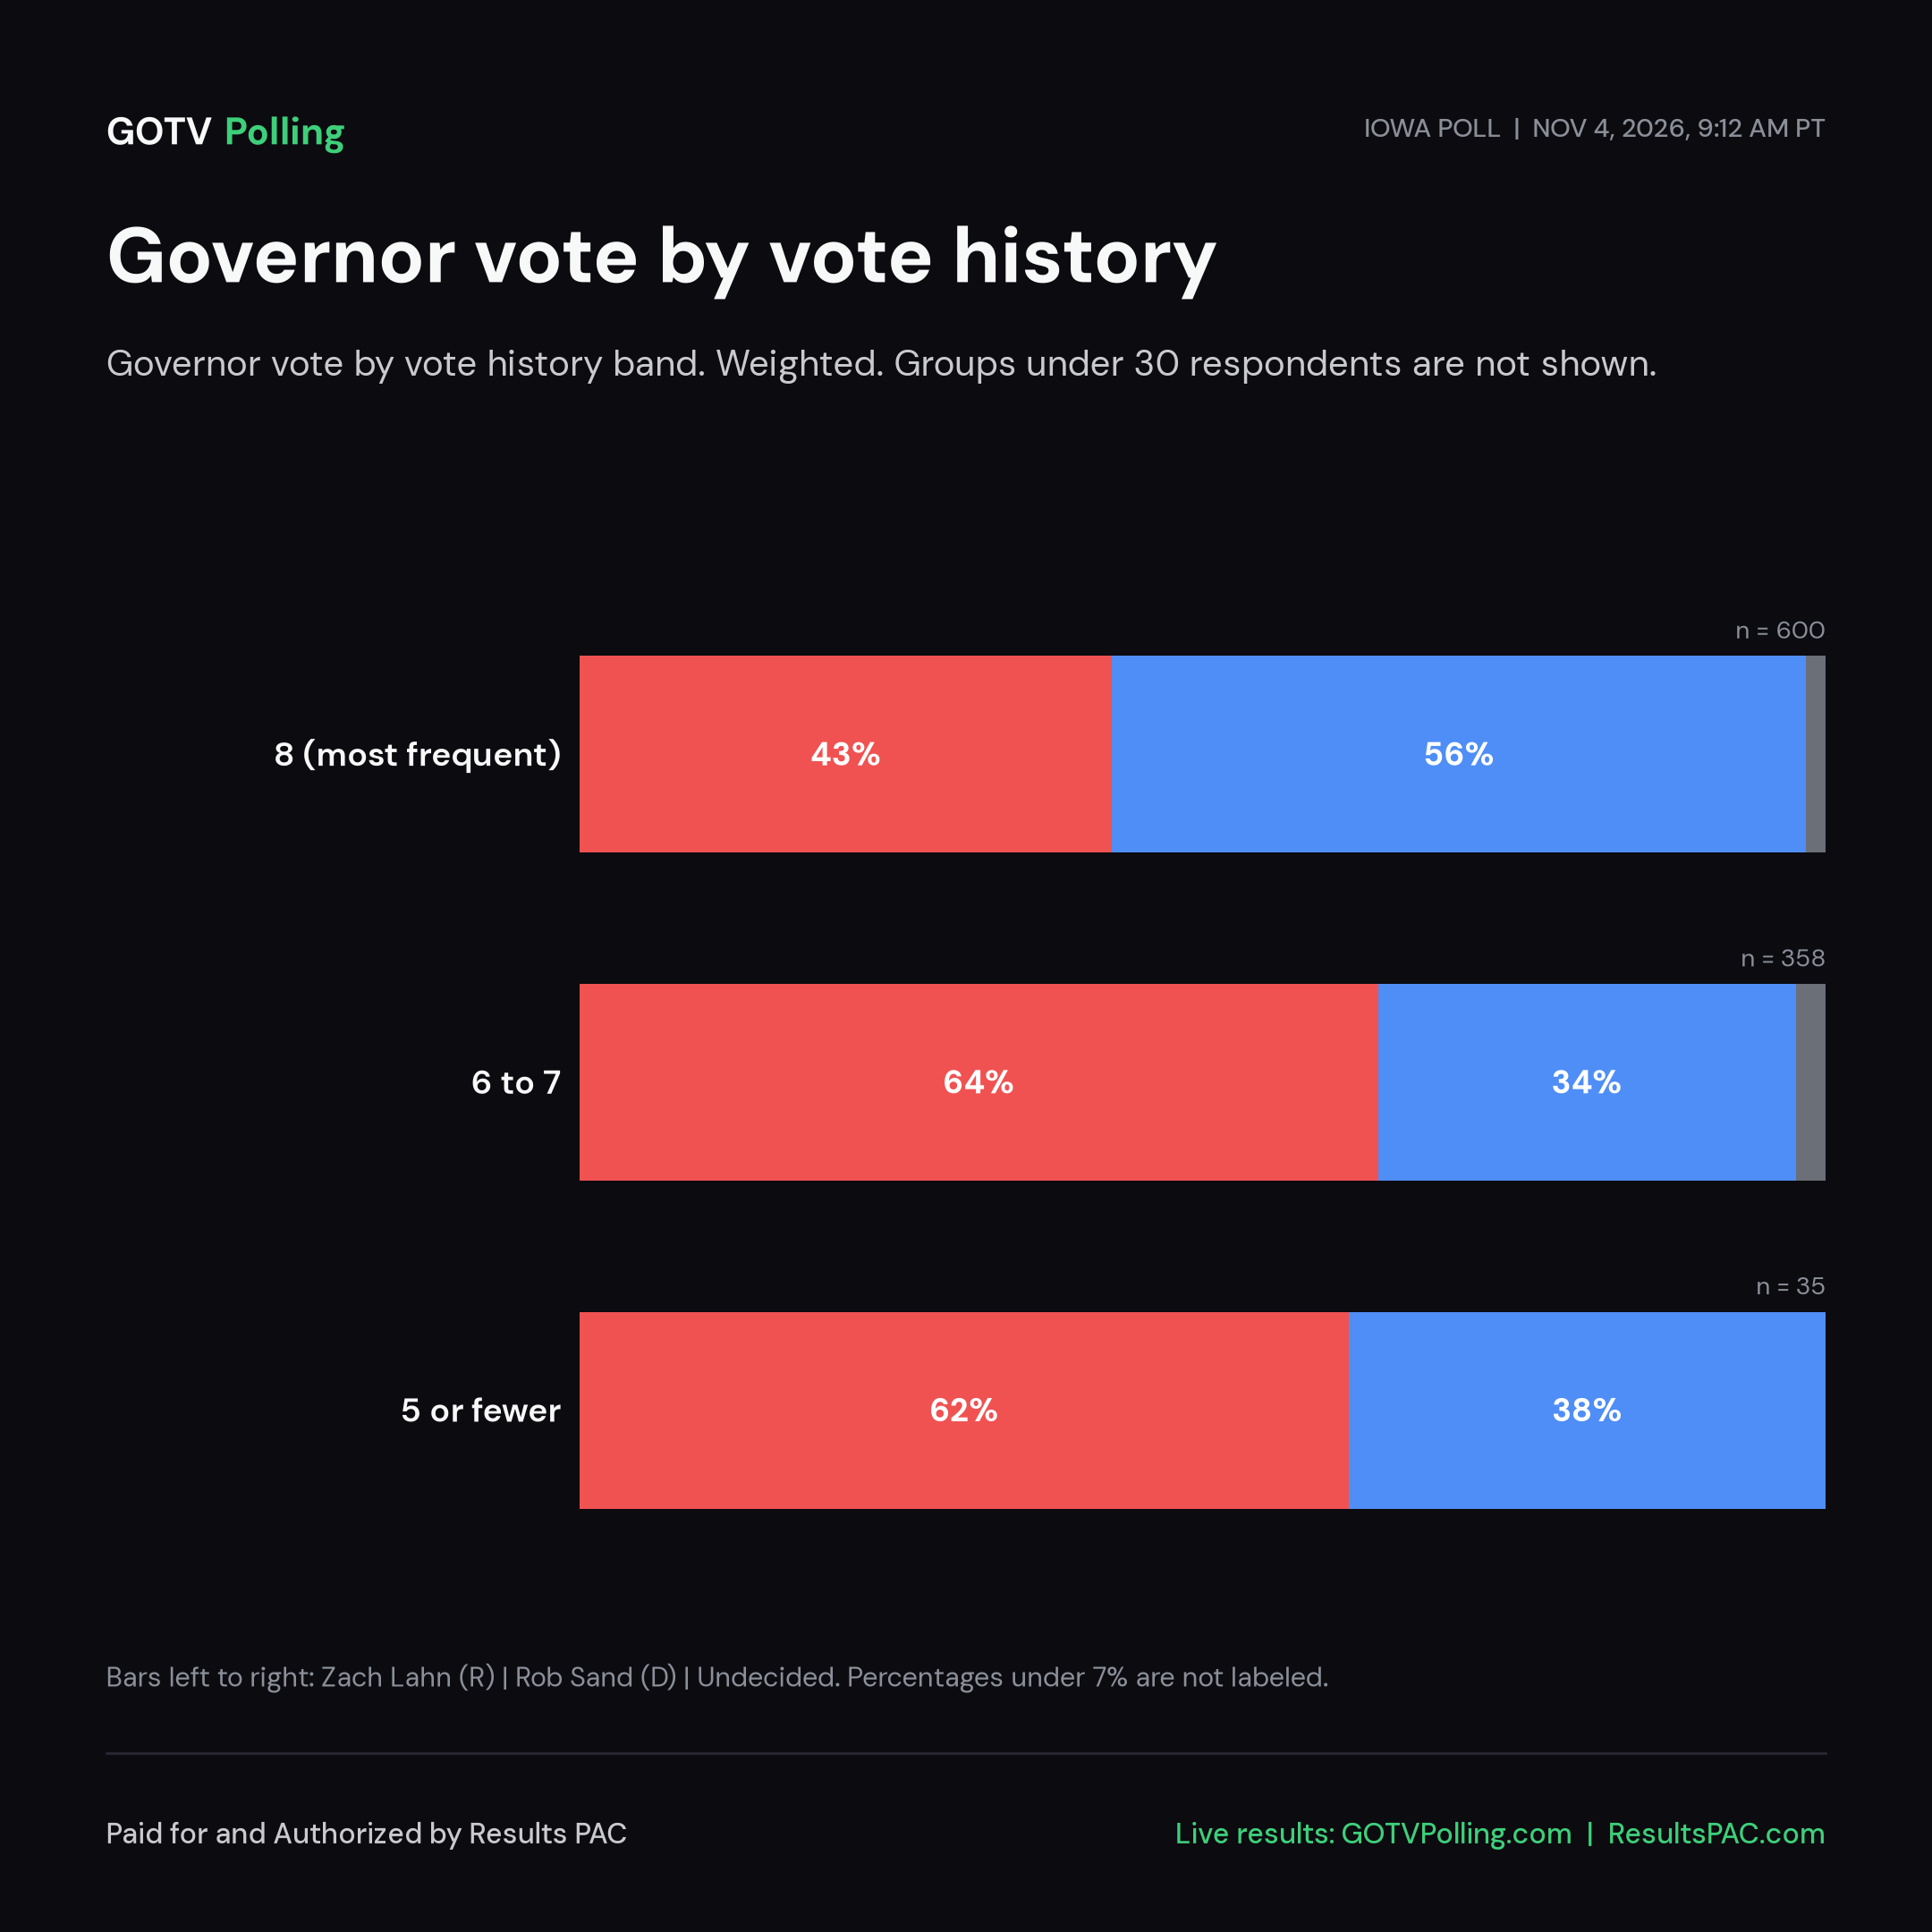
- Governor by vote frequency: PNG 1200x675 · PNG 1080x1080 · SVG
Voting history of respondents: Governor (#IAGOV)
Aggregate results only. Groups under 30 respondents are held back. All respondents are high-turnout voters who voted in each of the last four general elections.
Sample: 929 completed respondents answered the Governor question (published topline n). Margin of error plus or minus 3.4 points at 95% confidence (including the weighting design effect). Weighted to recalled 2024 presidential vote, the same method as the published toplines. Voting history comes from the voter file record matched to each respondent (930 of 930 matched). All numbers are polling aggregates. Any group with fewer than 30 respondents is held back. Subgroup margins of error are larger than the topline.
Published topline: Rob Sand 46.1%, Zach Lahn 52.0%, Undecided 1.9%.
Who answered: voting history profile
- Every respondent voted in the 2018, 2020, 2022 and 2024 general elections (all of the last four). These are high-turnout voters, not all registered voters, so these results describe the most reliable part of the electorate.
- New vs habitual: 35 respondents did not vote in the 2016 general; everyone else is a long-run habitual voter. A new-voter comparison is not possible from this sample.
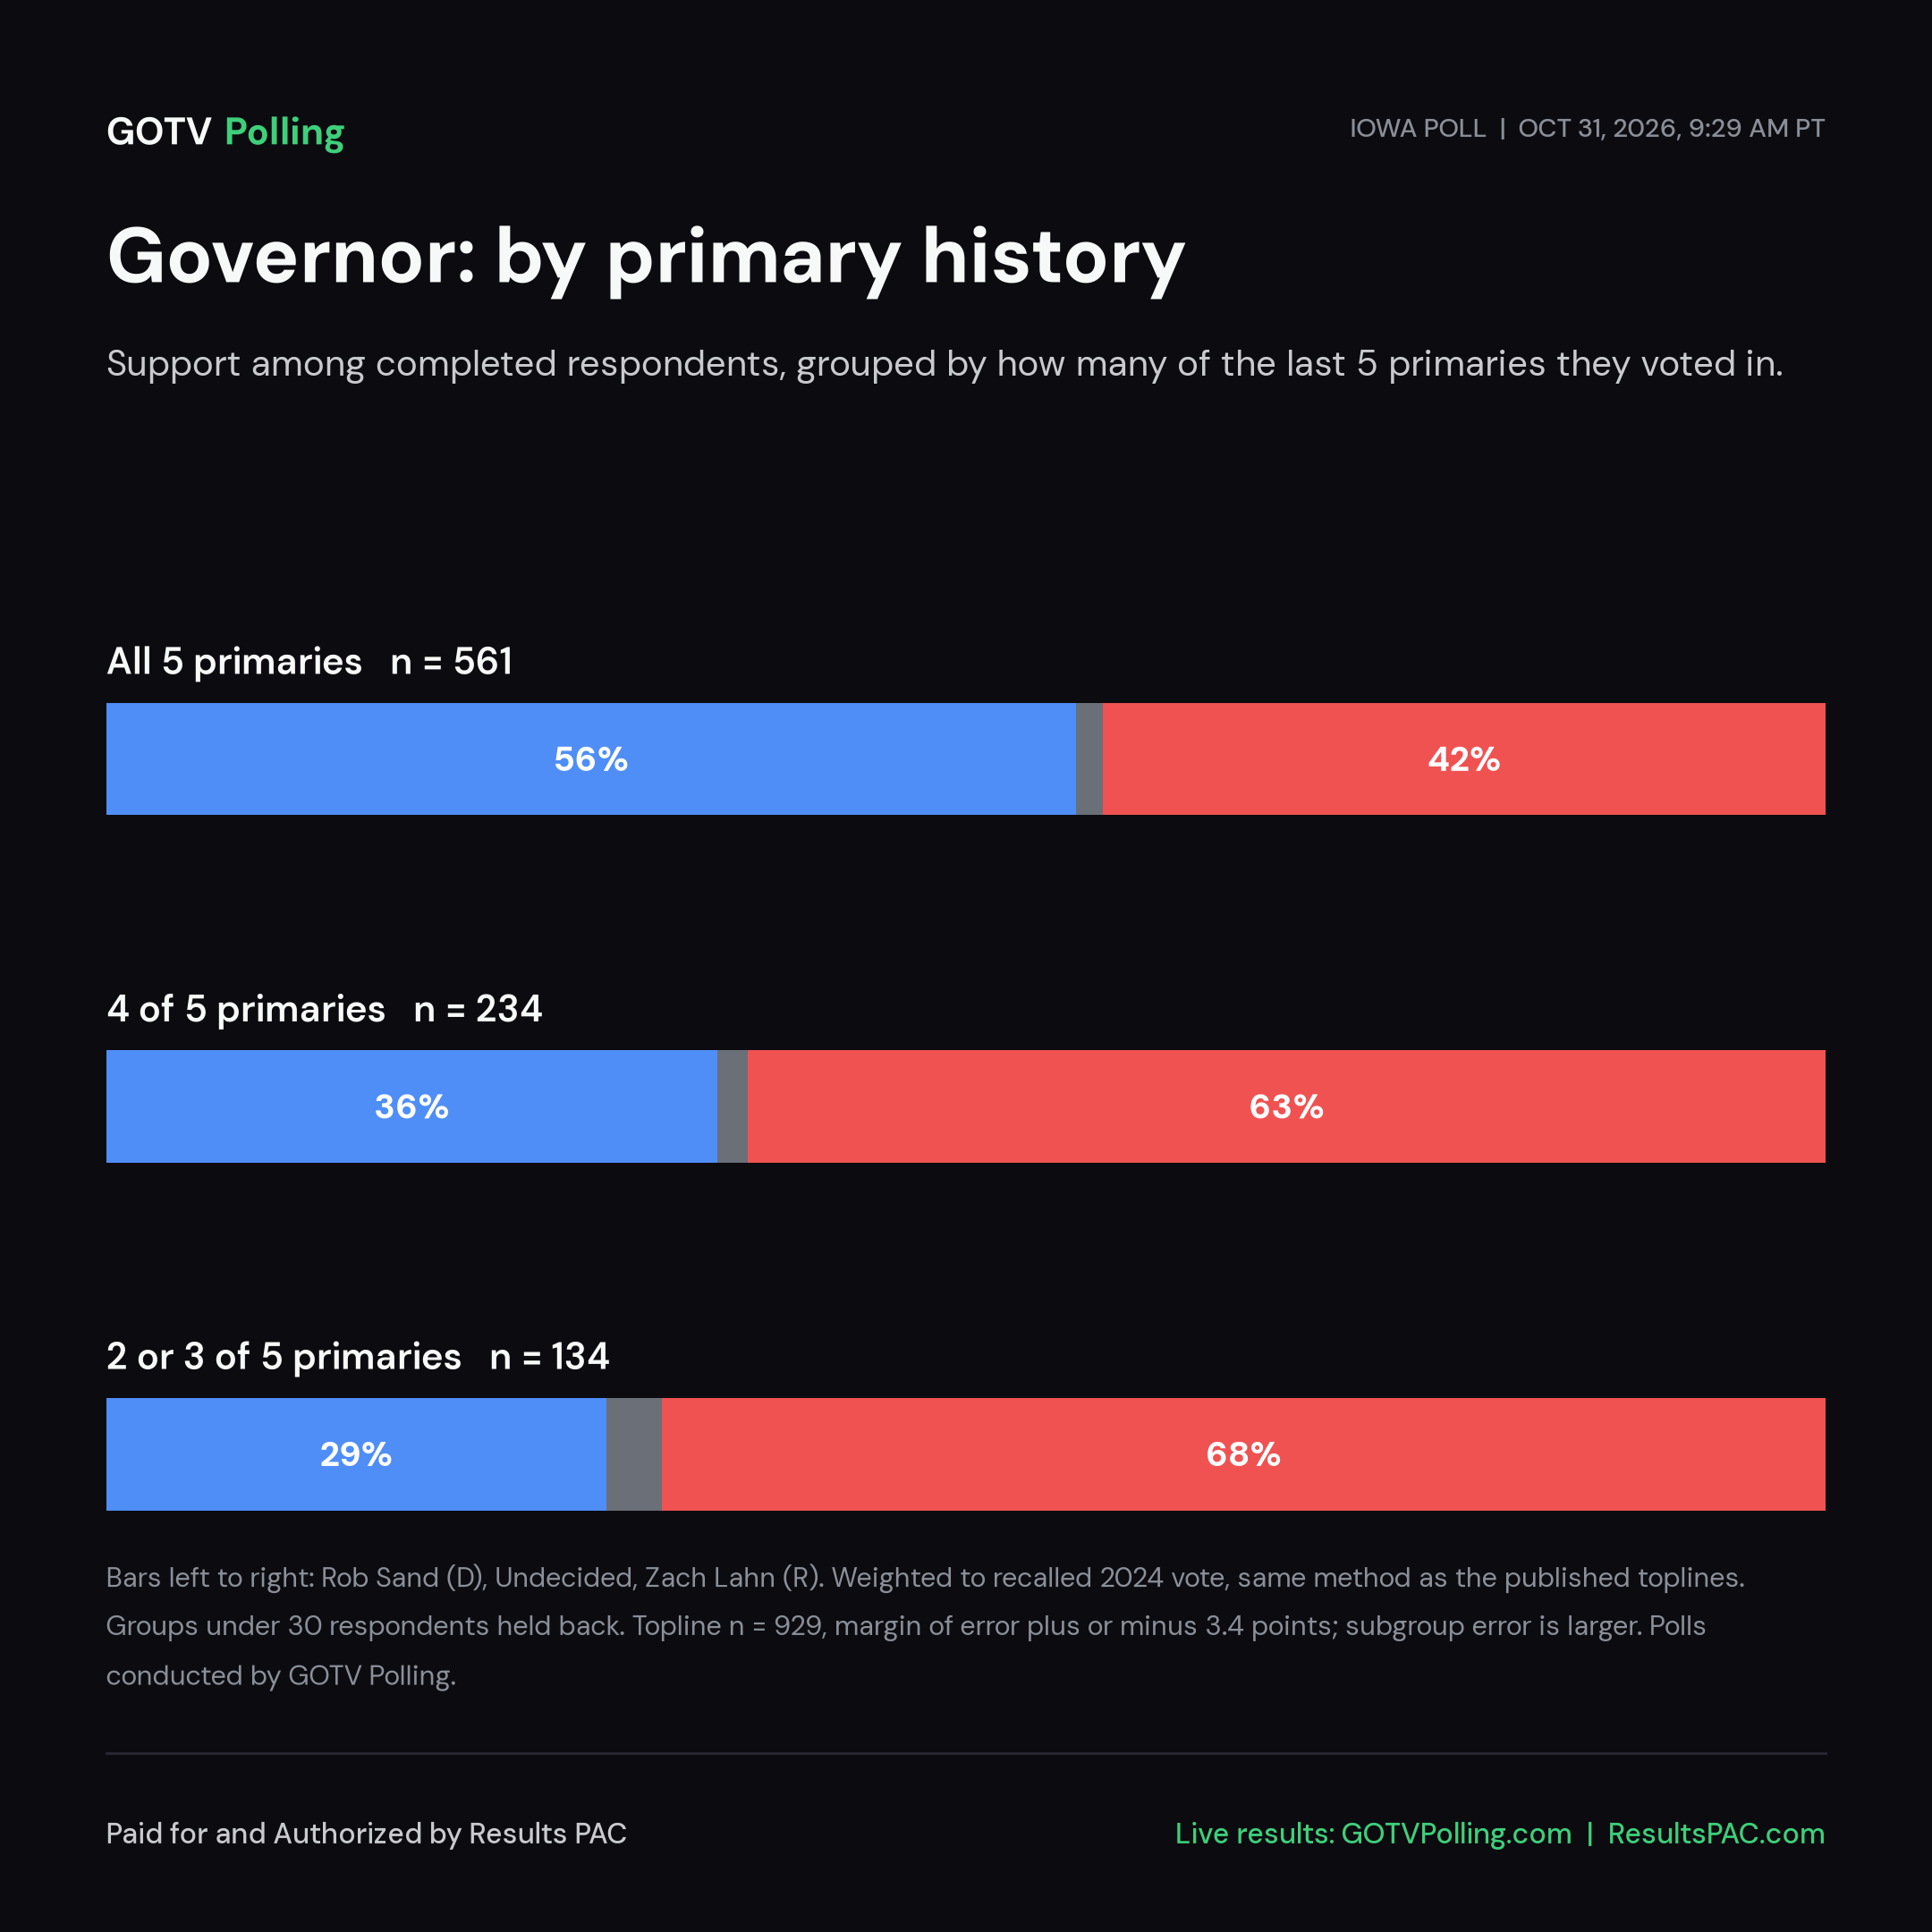
Primary participation, 2018 to 2026 (of 5):
| Group | Respondents | Share |
|---|---|---|
| All 5 primaries | 561 | 60% |
| 4 of 5 primaries | 234 | 25% |
| 2 or 3 of 5 primaries | 135 | 15% |
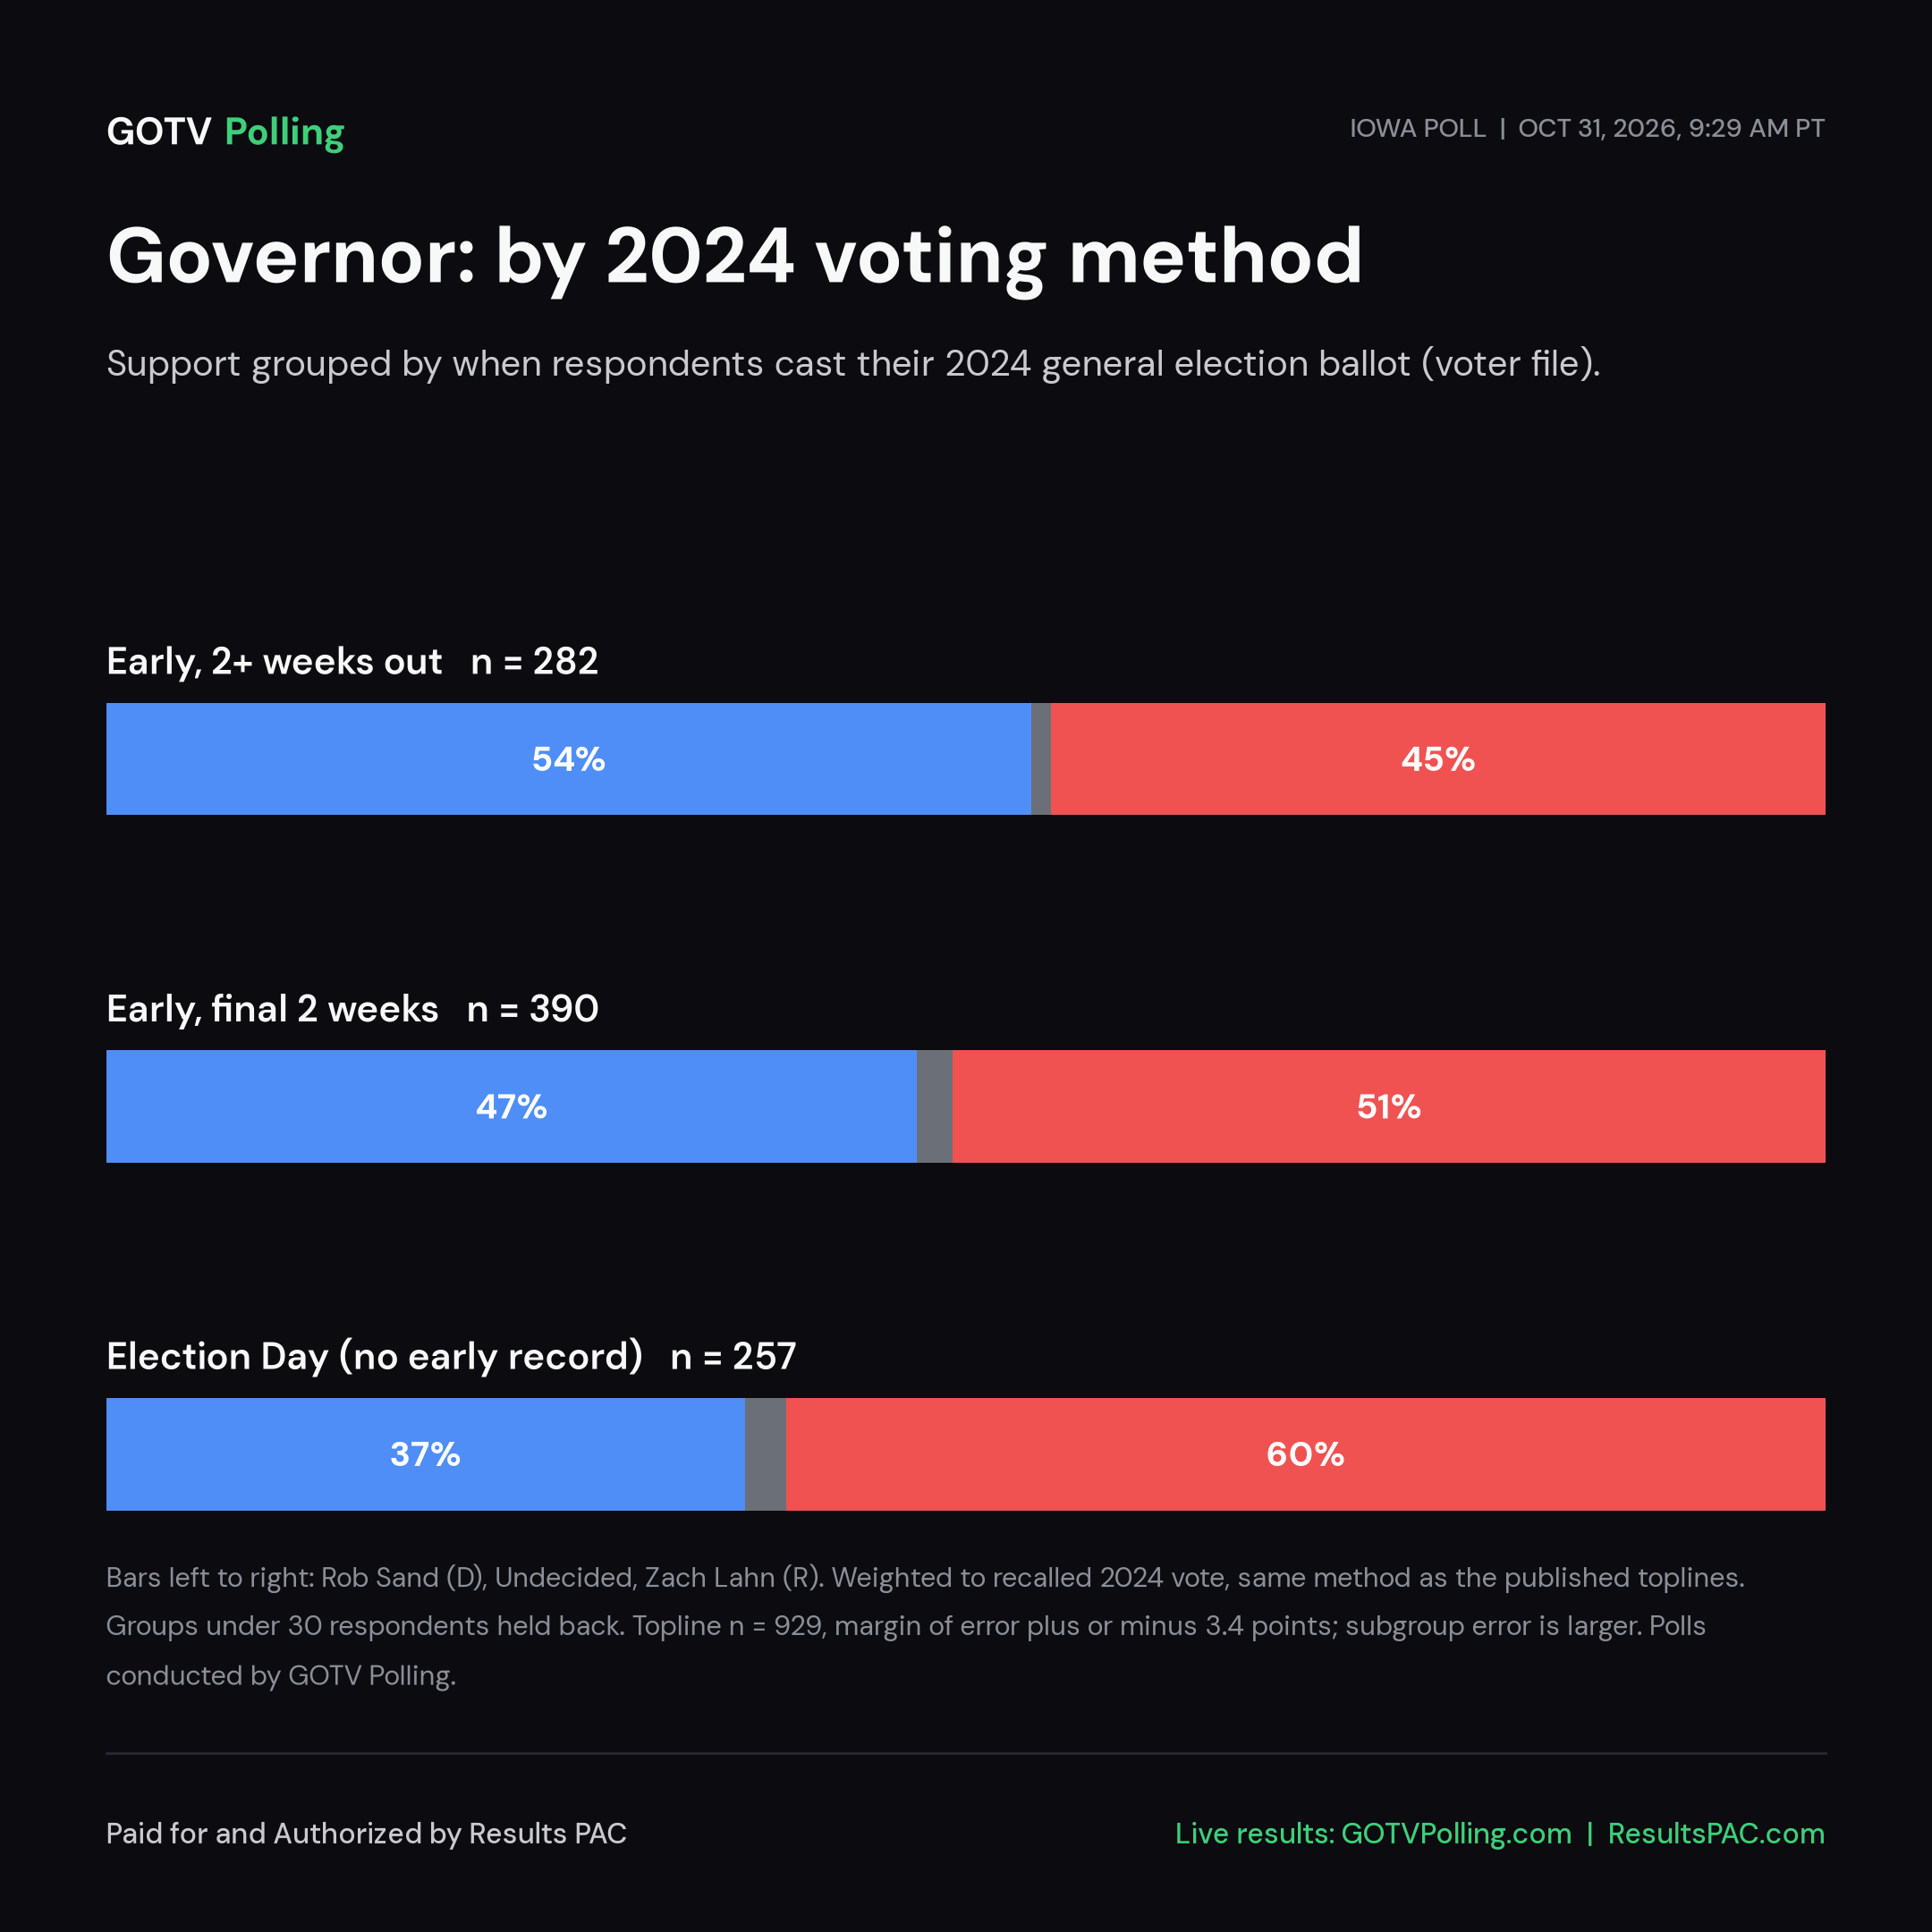
2024 general, how they voted:
| Group | Respondents | Share |
|---|---|---|
| Early, 2+ weeks out | 282 | 30% |
| Early, final 2 weeks | 391 | 42% |
| Election Day (no early record) | 257 | 28% |
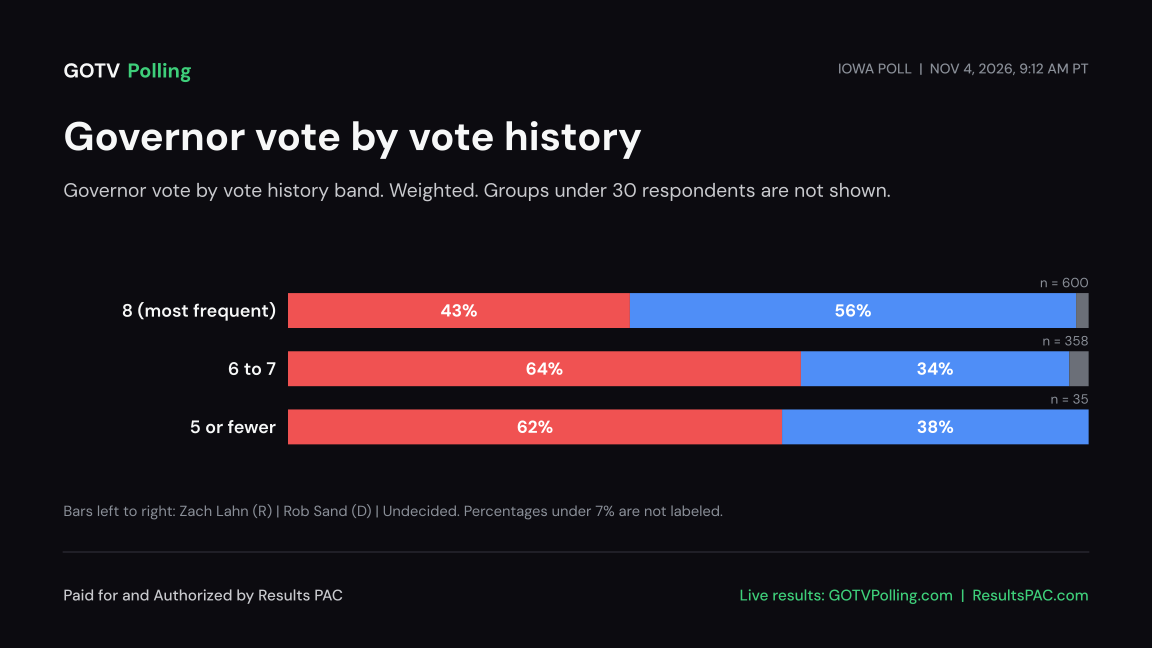
Voter-file vote frequency score:
| Group | Respondents | Share |
|---|---|---|
| Vote frequency 8 (highest) | 561 | 60% |
| Vote frequency 7 | 234 | 25% |
| Vote frequency 5 to 6 | 135 | 15% |
Support by voting history
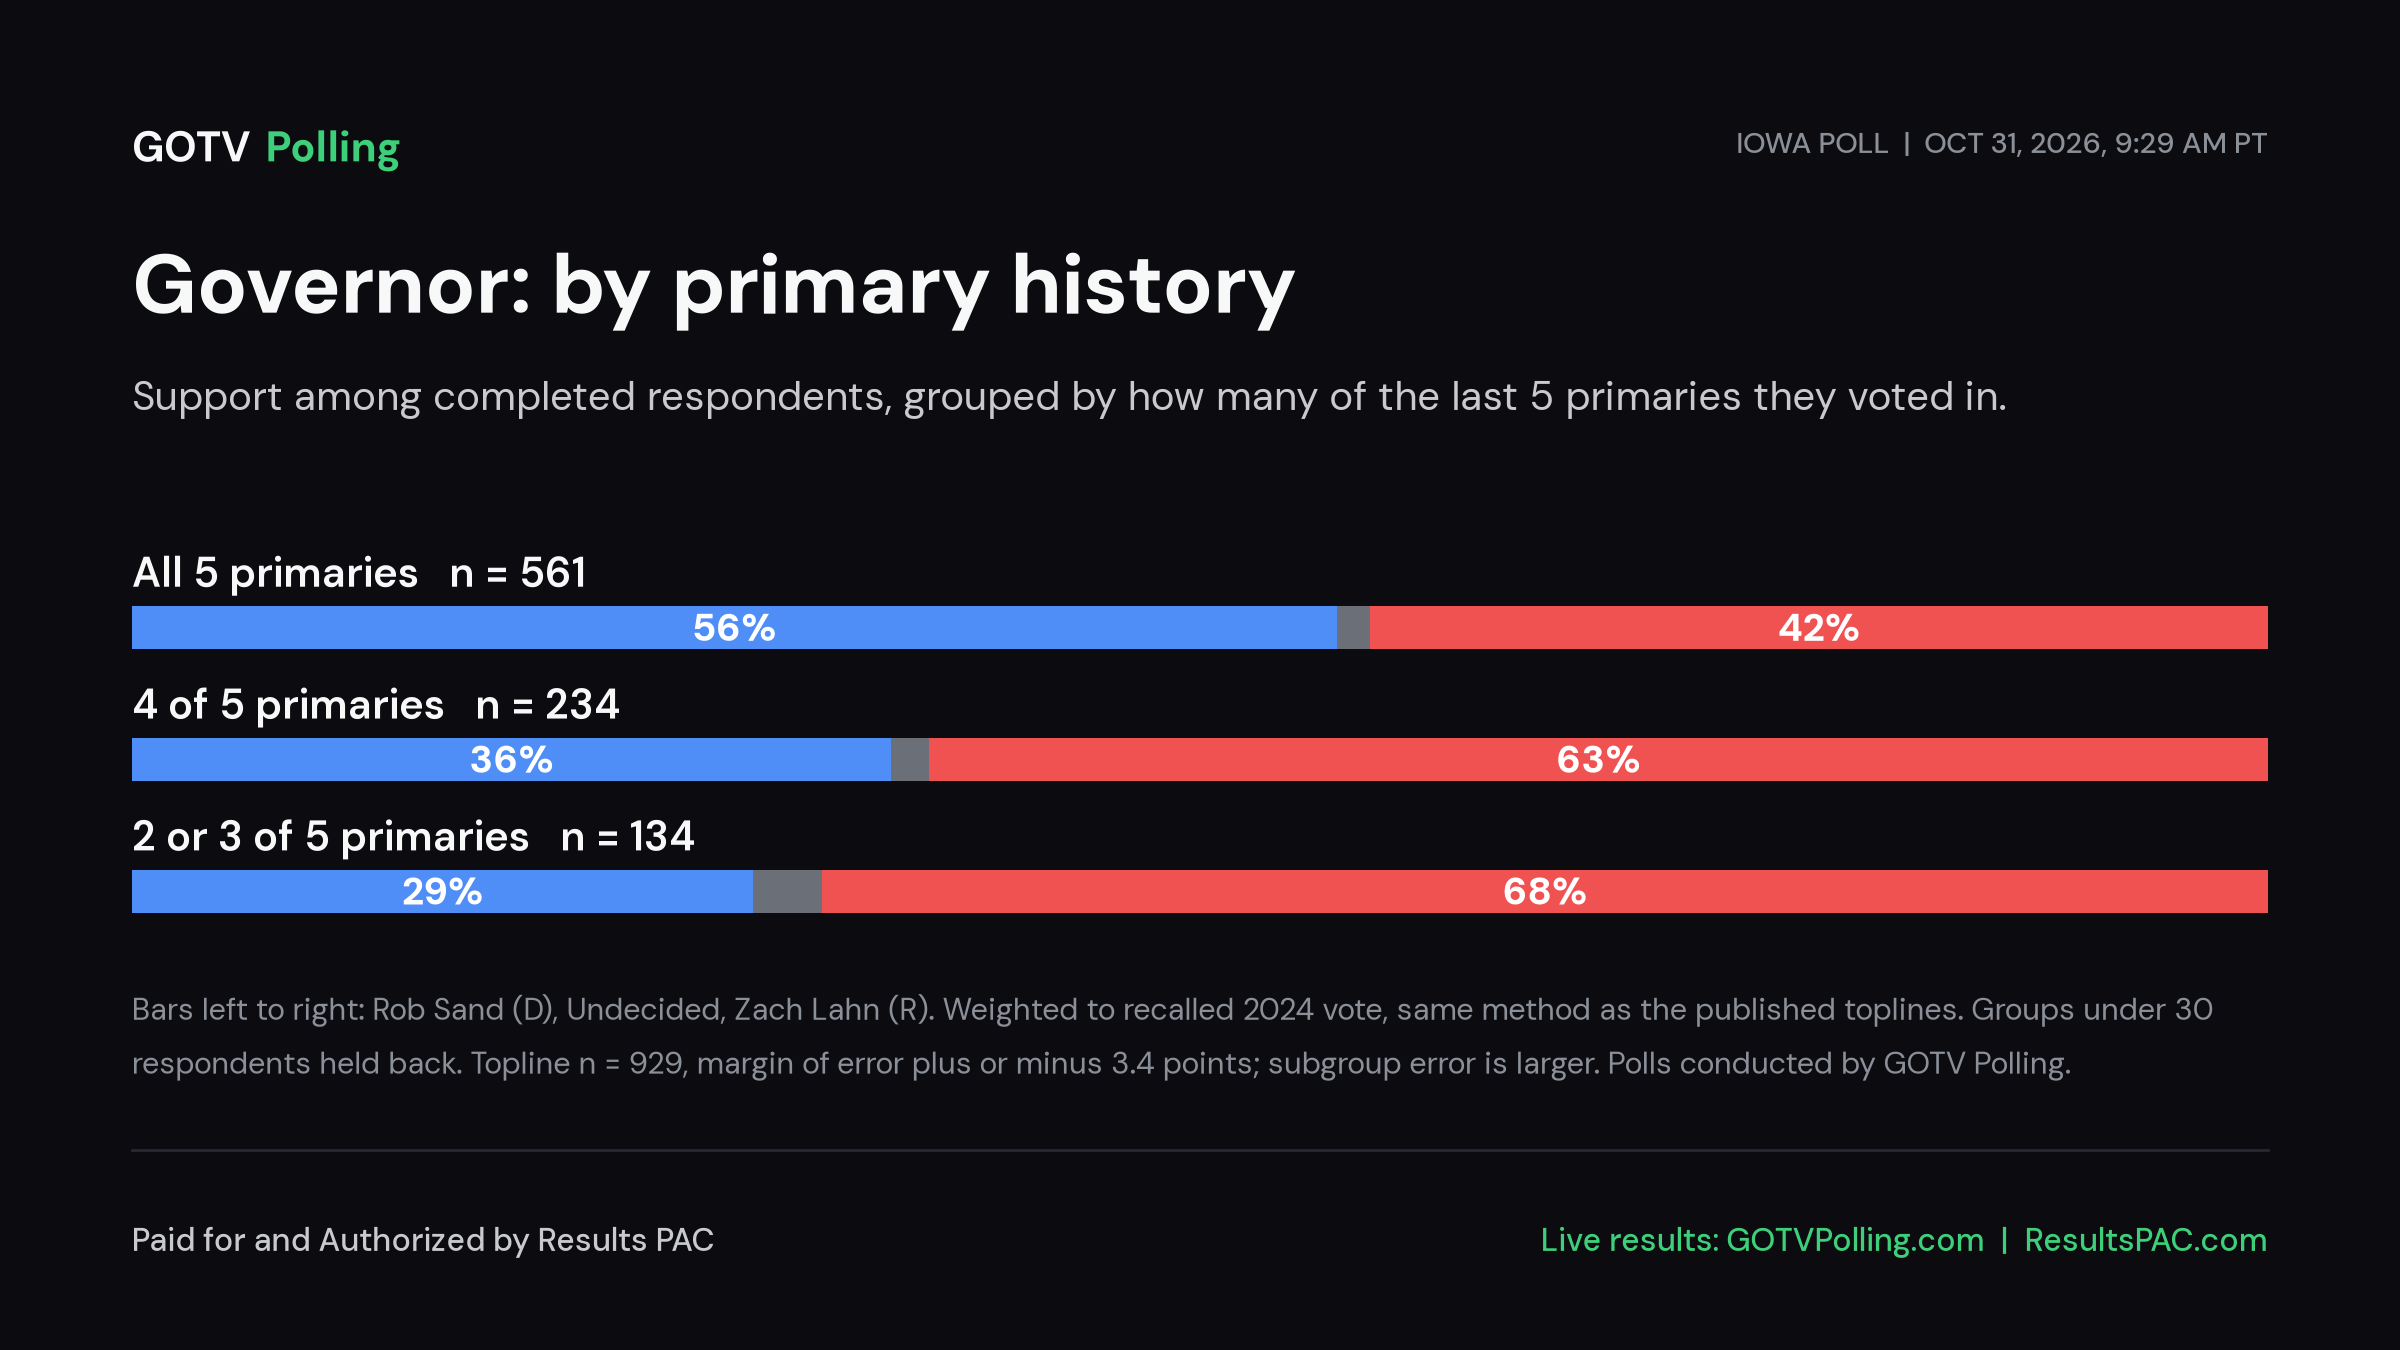
Primary history:
| Group | n | Rob Sand | Zach Lahn | Undecided |
|---|---|---|---|---|
| All 5 primaries | 561 | 56.4% | 42.0% | 1.5% |
| 4 of 5 primaries | 234 | 35.6% | 62.7% | 1.8% |
| 2 or 3 of 5 primaries | 134 | 29.1% | 67.7% | 3.2% |
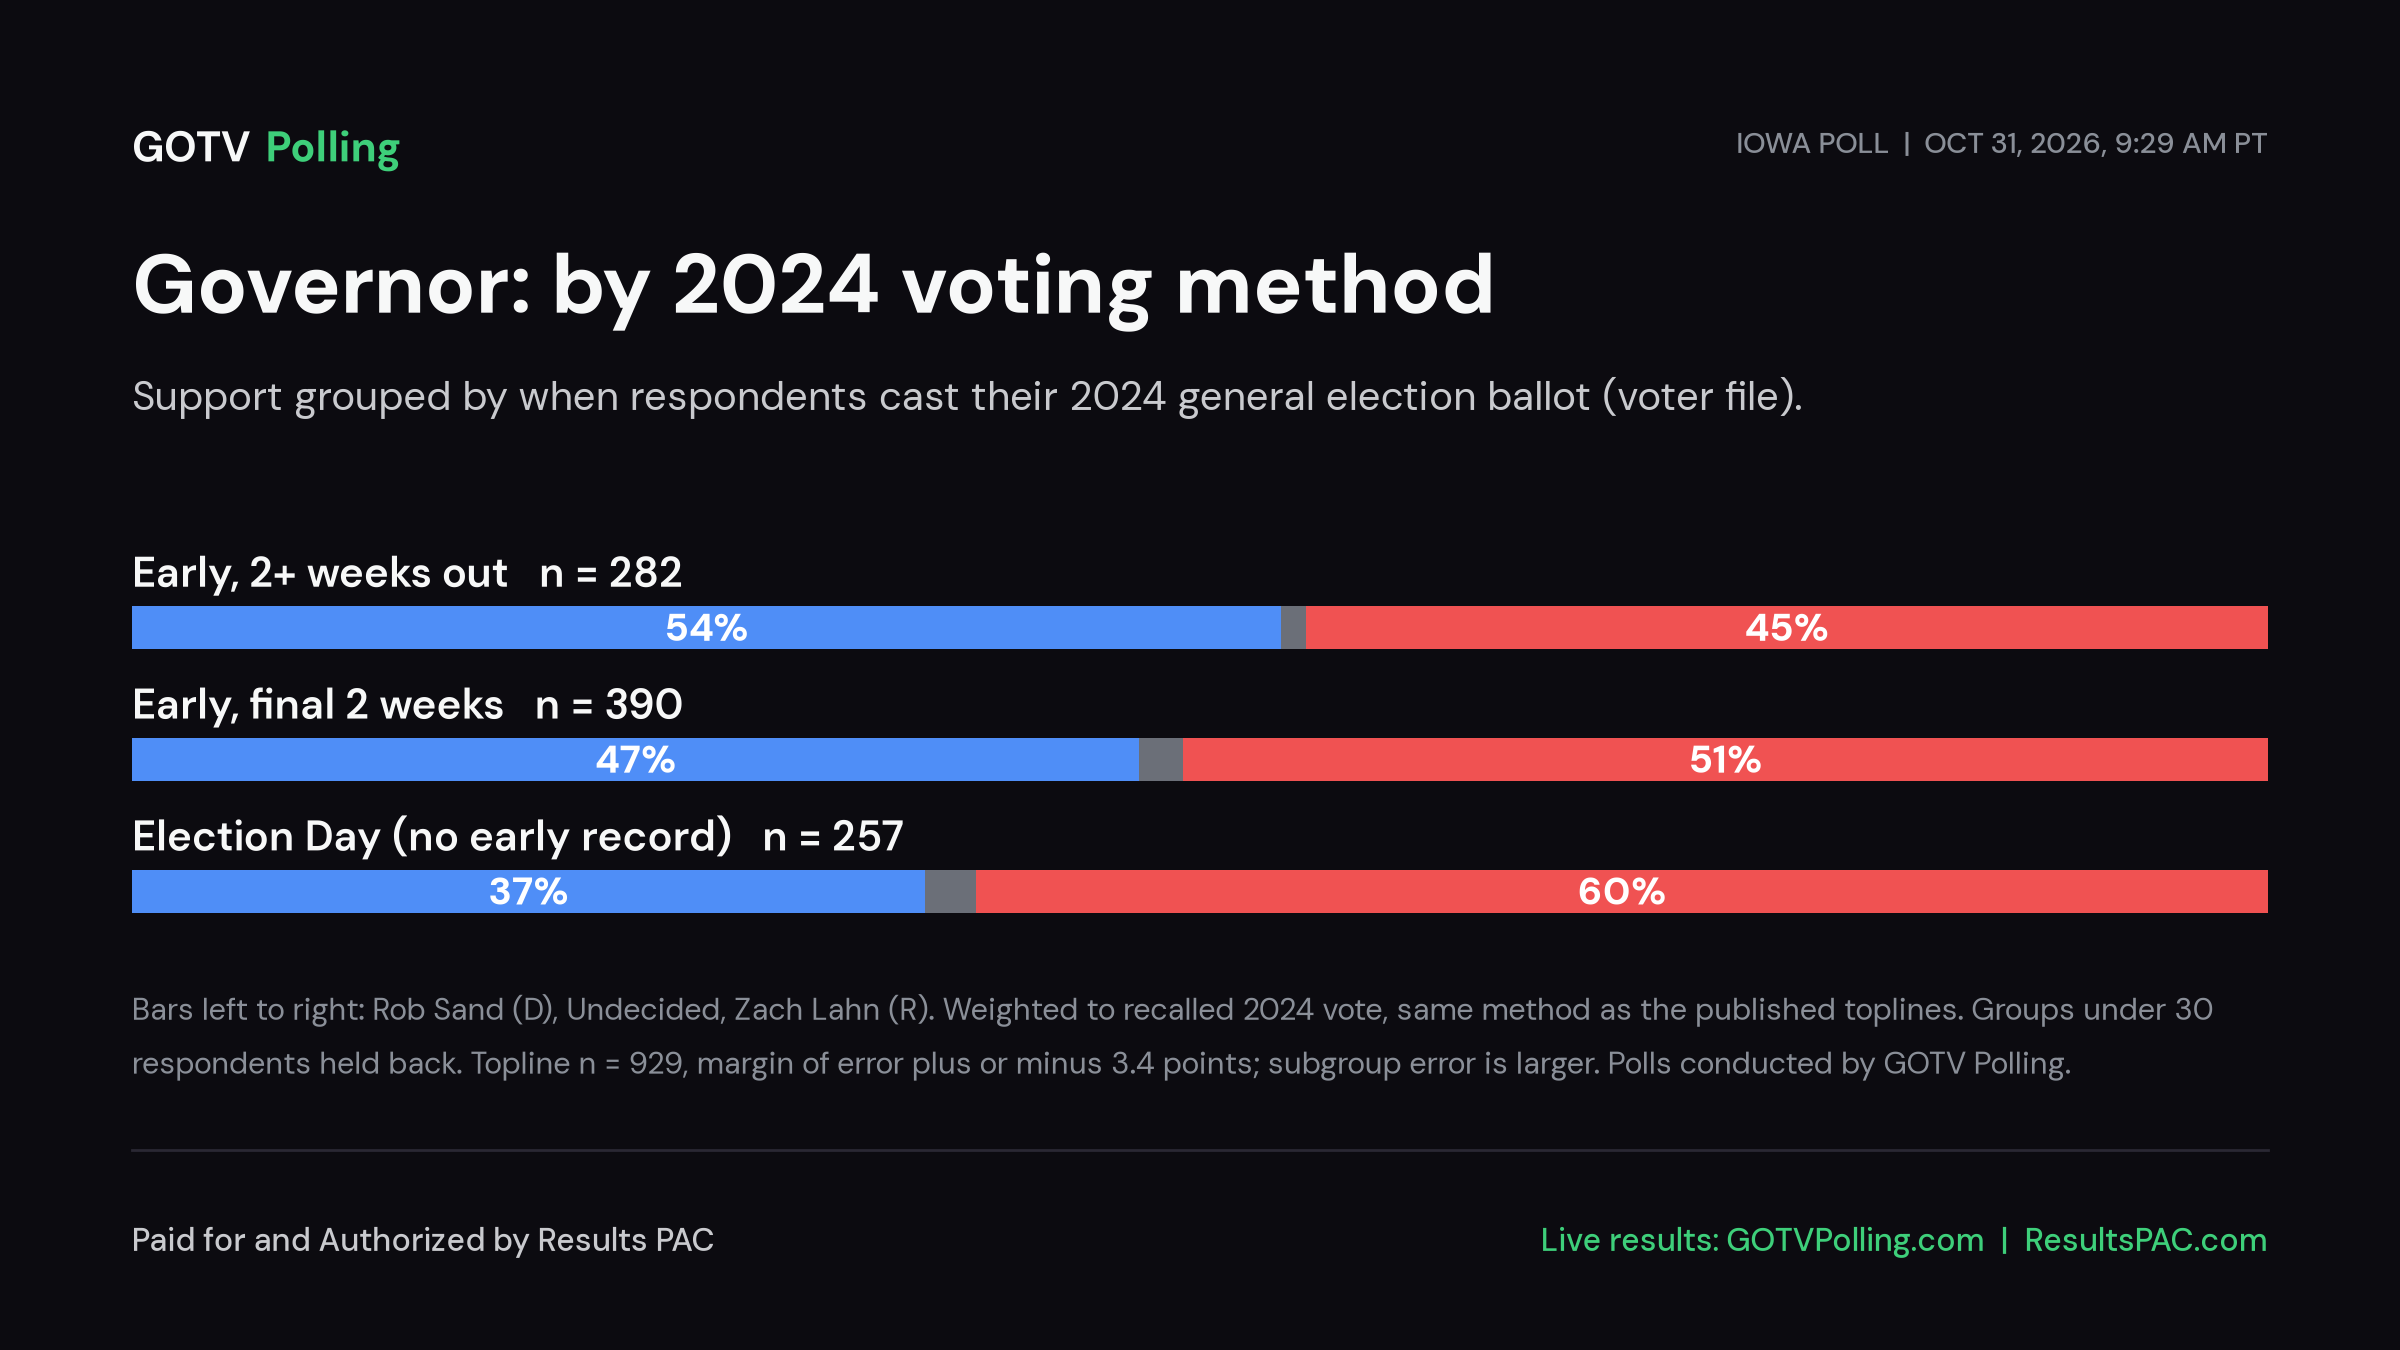
2024 voting method:
| Group | n | Rob Sand | Zach Lahn | Undecided |
|---|---|---|---|---|
| Early, 2+ weeks out | 282 | 53.8% | 45.1% | 1.1% |
| Early, final 2 weeks | 390 | 47.2% | 50.8% | 2.1% |
| Election Day (no early record) | 257 | 37.1% | 60.5% | 2.4% |
Vote frequency score:
| Group | n | Rob Sand | Zach Lahn | Undecided |
|---|---|---|---|---|
| Vote frequency 8 (highest) | 561 | 56.4% | 42.0% | 1.5% |
| Vote frequency 7 | 234 | 35.6% | 62.7% | 1.8% |
| Vote frequency 5 to 6 | 134 | 29.1% | 67.7% | 3.2% |
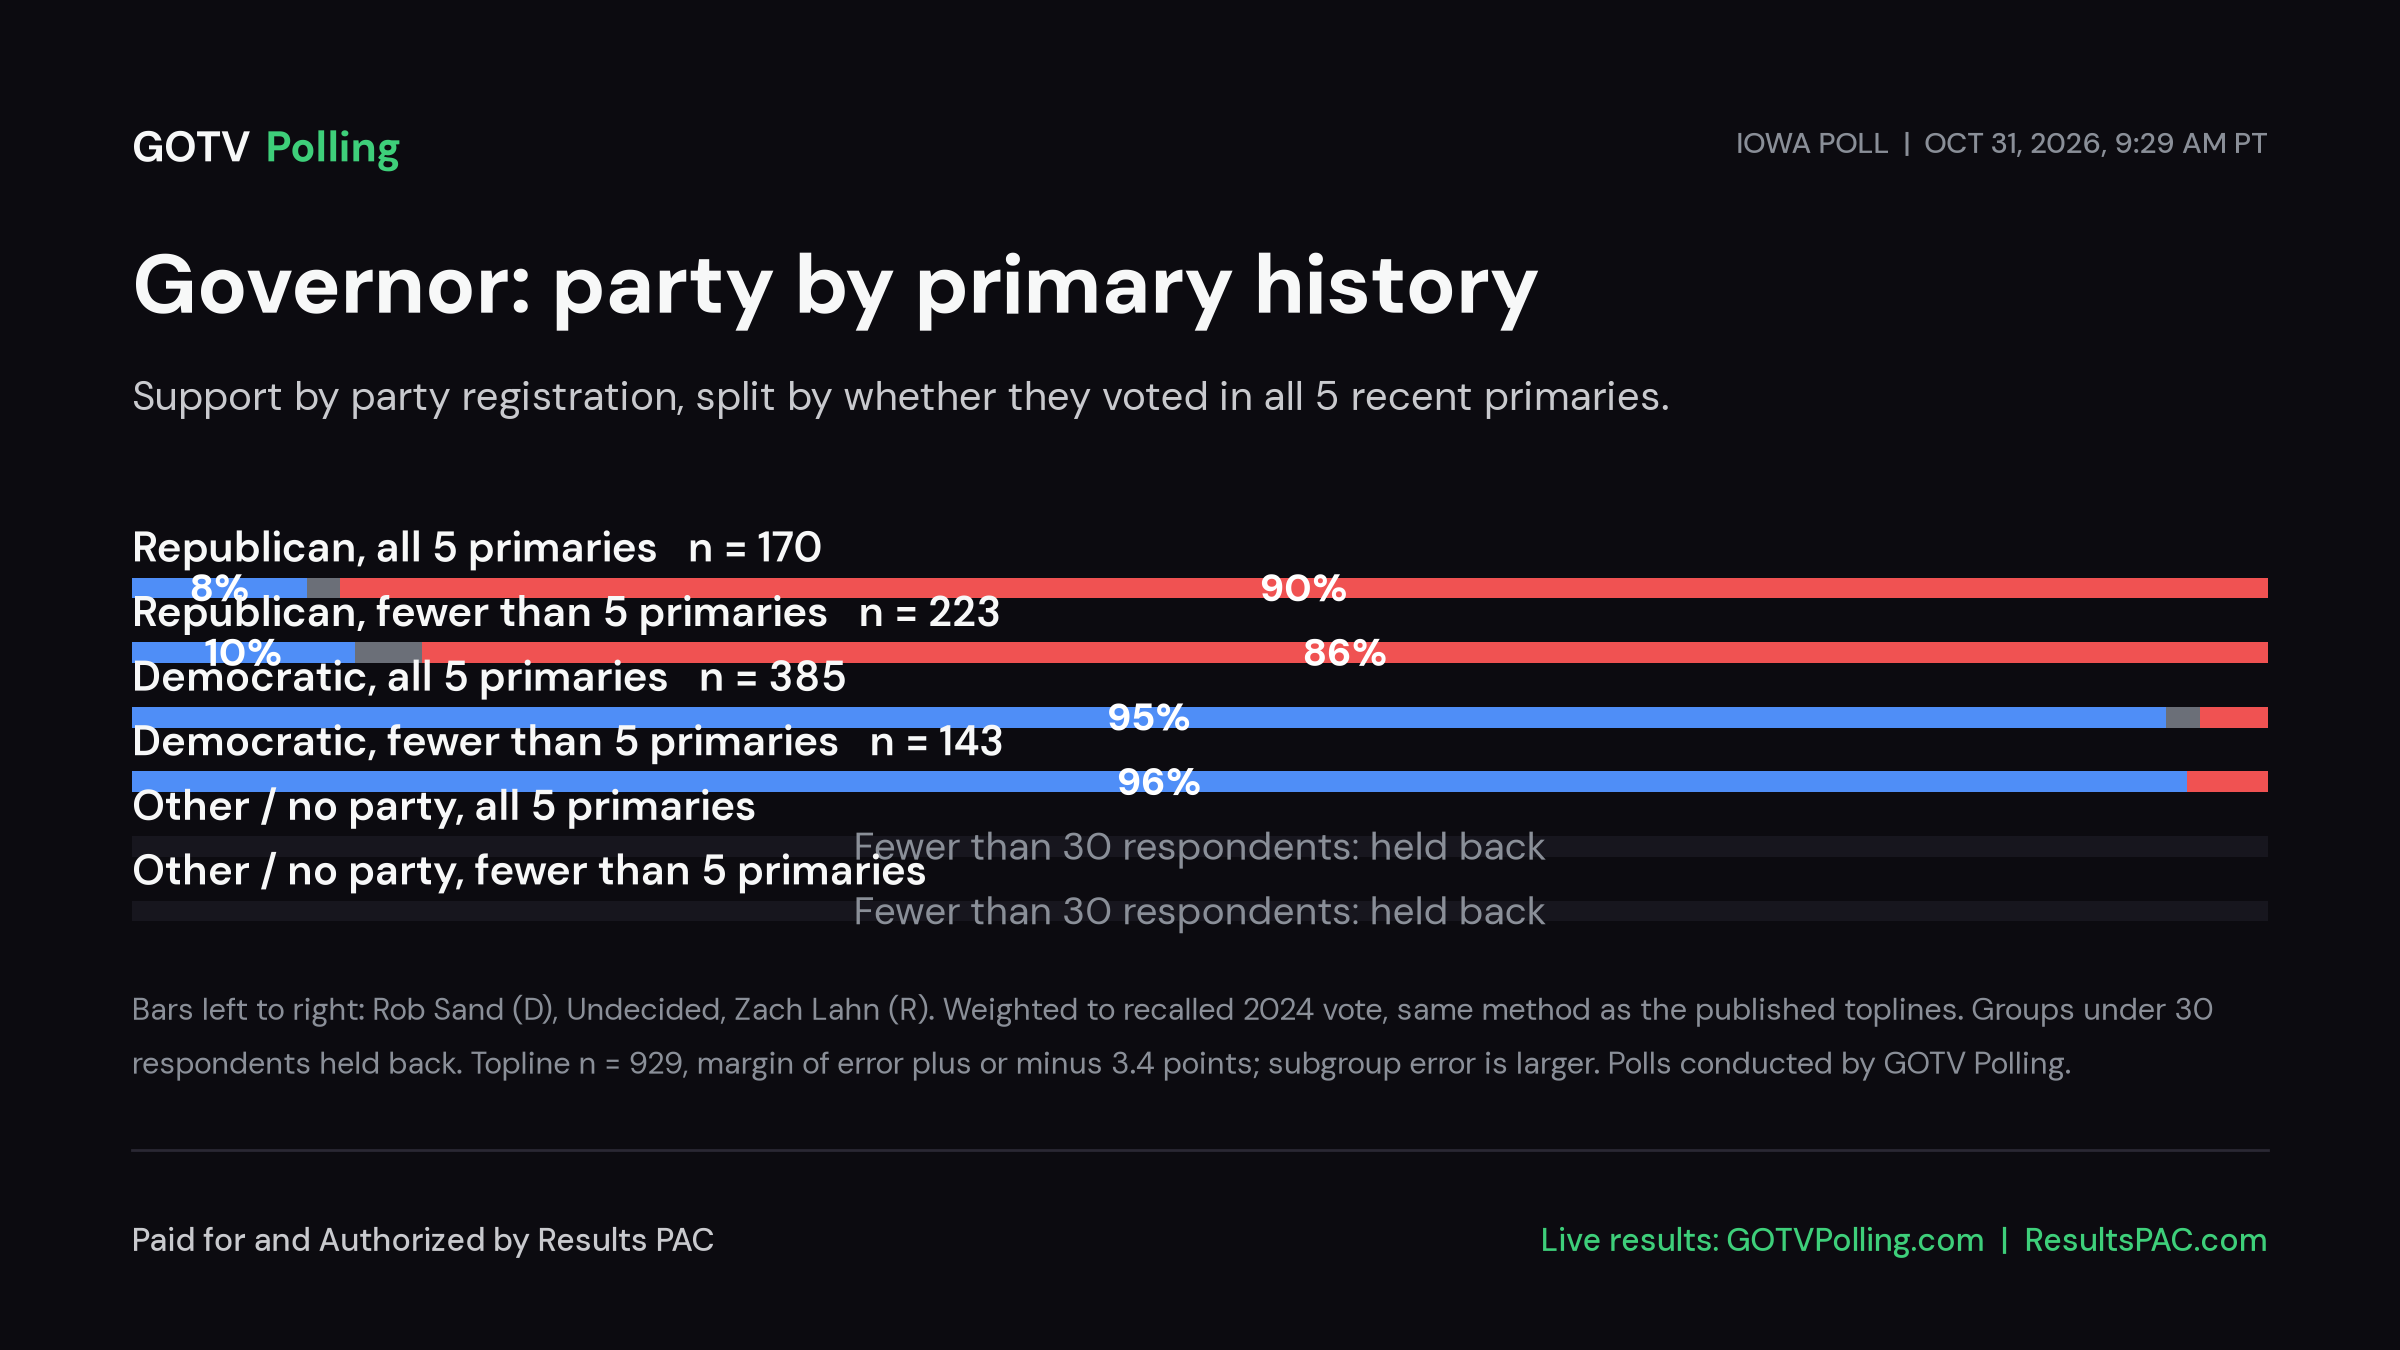
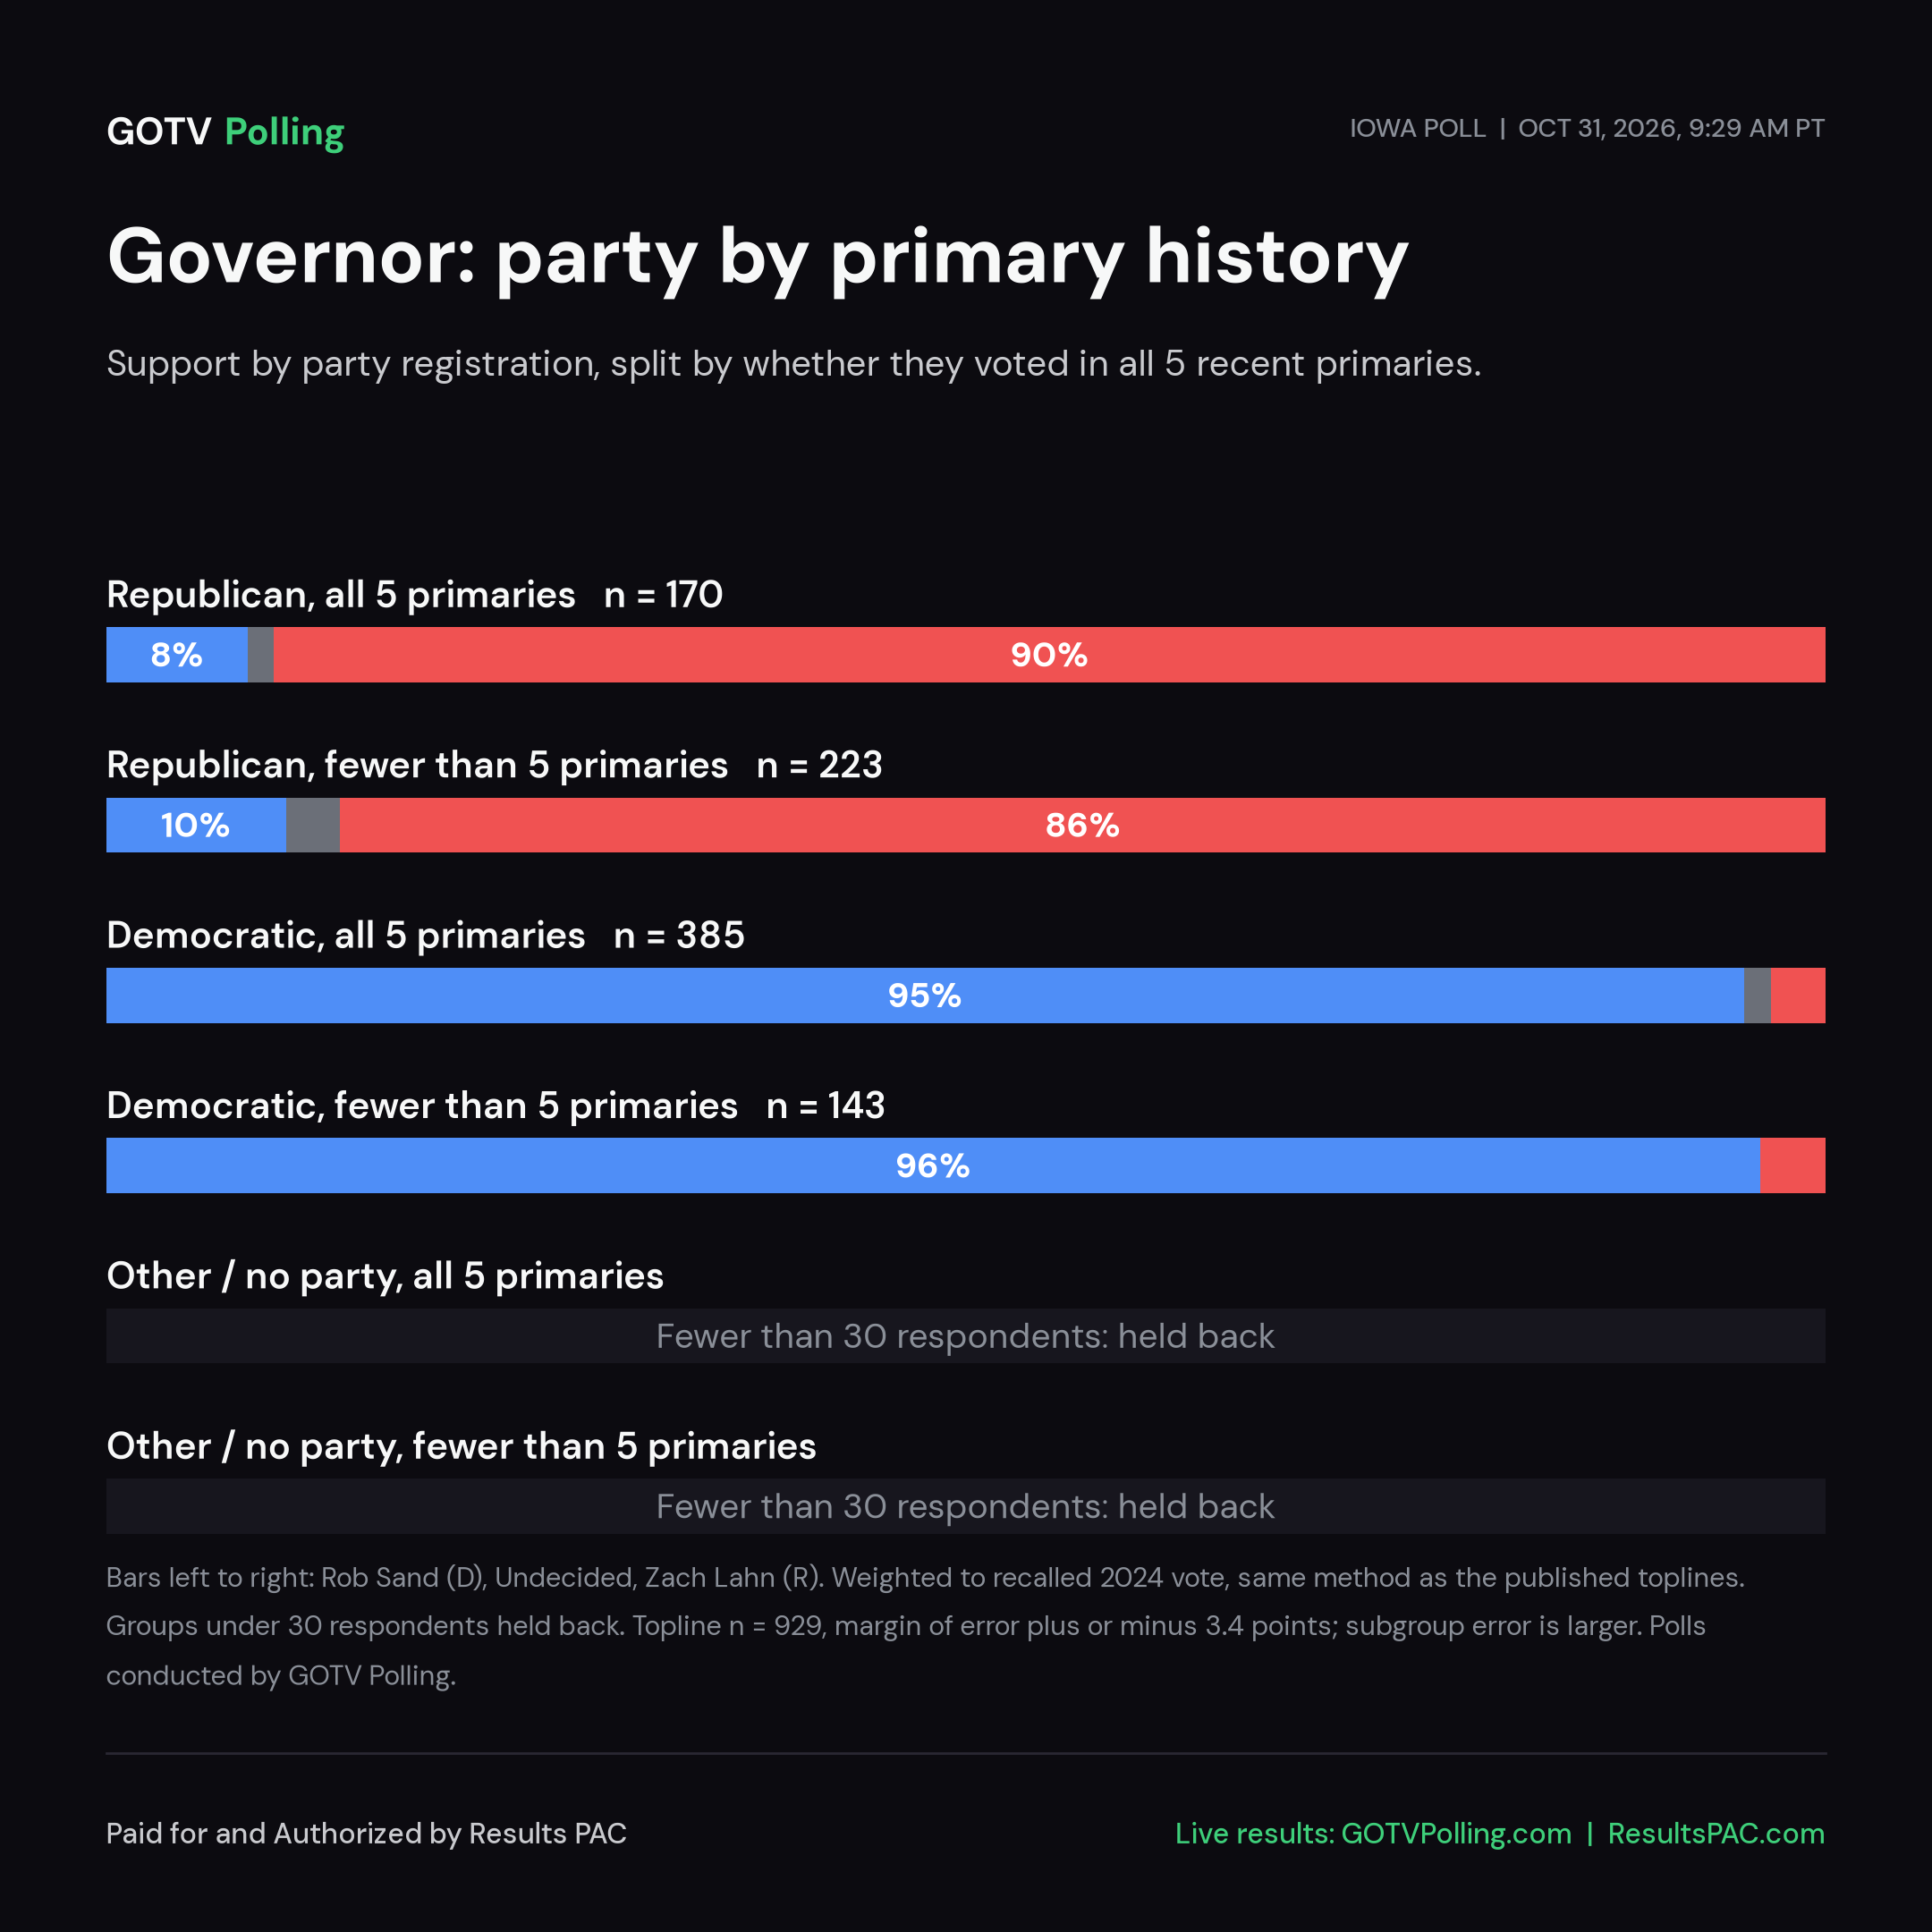
Party registration by primary history:
| Group | n | Rob Sand | Zach Lahn | Undecided |
|---|---|---|---|---|
| Republican, all 5 primaries | 170 | 8.2% | 90.3% | 1.5% |
| Republican, fewer than 5 primaries | 223 | 10.4% | 86.4% | 3.2% |
| Democratic, all 5 primaries | 385 | 95.2% | 3.2% | 1.6% |
| Democratic, fewer than 5 primaries | 143 | 96.2% | 3.8% | 0.0% |
| Other / no party, all 5 primaries | under 30 | held back | held back | held back |
| Other / no party, fewer than 5 primaries | under 30 | held back | held back | held back |
What it means
- Margin among voters in all 5 primaries: Sand +14.4; among those in 2 or 3 of 5: Lahn +38.6.
- Margin among voters who voted early 2+ weeks out in 2024: Sand +8.8; among Election Day voters: Lahn +23.3.
- Within each party support barely moves (Republicans 90% and 86% Lahn, Democrats 95% and 96% Sand), so the gap is mostly party mix.
- Because every respondent is a high-turnout voter, read differences between voting-history groups as differences within the most reliable part of the electorate, not as a turnout model.
- Party and primary history overlap strongly; differences by history group are largely party composition.
Caveats
- Held back (under 30): Other / no party, all 5 primaries, Other / no party, fewer than 5 primaries.
- Early-vote timing is from the voter file's 2024 record, not a 2026 early-vote measure.
Race profile: Iowa Governor
Governor · Iowa · Statewide · General election: Tuesday, November 3, 2026
Candidates on the November 3 ballot
Certified candidates
- Rob Sand Democratic
- Zach Lahn Republican
Certified candidate list from Candidate Alerts, as of 2026-09-24, based on Iowa Secretary of State. Includes candidates the database marks as on the November 3 ballot. Incumbent tags here follow the database.
Past election results
Demographics
2020 Census demographics by district are not yet published in this data set.
3 of 1,674 precincts are above 50%, and 35 are above 25%. Source: Census American Community Survey 2020-2024 5-year block groups, allocated to current precinct shapes by area.
Poll results for this race (Paid for and Authorized by Results PAC)
Early vote layer: 2026 general (statewide)
Unofficial. Source: civicAPI and Call the Map (callthemap.com/early-vote), republishing Iowa Secretary of State counts. Official data: sos.iowa.gov.
Data as of October 30, 2026. 407,374 early ballots cast in Iowa: D 47.1%, R 33.8%, No Party / Other 19.1% by registration (D+13.2). Party is registration, not vote. Early vote is published by county only. Full Iowa early vote page.
Shading: registered Democrats minus registered Republicans among early ballots cast (mail returned plus in person), by county. County shapes: U.S. Census Bureau cartographic boundary file cb_2023_us_county_20m.
Early vote by county (99)
| County | Mail requested | Mail returned | Return rate | In person | Total cast | D / Other / R share of cast |
|---|---|---|---|---|---|---|
| Polk | 26,477 | 22,976 | 86.8% | 39,922 | 62,898 | 58.0% / 19.0% / 23.0% |
| Linn | 11,634 | 10,328 | 88.8% | 19,211 | 29,539 | 55.9% / 20.8% / 23.3% |
| Johnson | 7,020 | 5,784 | 82.4% | 23,328 | 29,112 | 67.3% / 20.2% / 12.5% |
| Scott | 8,758 | 7,584 | 86.6% | 19,021 | 26,605 | 47.0% / 22.8% / 30.2% |
| Black Hawk | 7,014 | 6,297 | 89.8% | 9,308 | 15,605 | 54.3% / 18.7% / 27.0% |
| Dubuque | 7,521 | 6,815 | 90.6% | 8,611 | 15,426 | 54.8% / 14.8% / 30.4% |
| Dallas | 7,411 | 6,311 | 85.2% | 8,503 | 14,814 | 44.1% / 21.6% / 34.3% |
| Story | 4,720 | 4,092 | 86.7% | 7,414 | 11,506 | 52.6% / 22.8% / 24.6% |
| Woodbury | 3,872 | 3,147 | 81.3% | 6,853 | 10,000 | 43.9% / 16.6% / 39.5% |
| Warren | 3,111 | 2,682 | 86.2% | 5,844 | 8,526 | 42.5% / 19.6% / 37.9% |
| Pottawattamie | 4,346 | 3,799 | 87.4% | 4,714 | 8,513 | 43.0% / 16.8% / 40.3% |
| Clinton | 2,922 | 2,596 | 88.8% | 4,307 | 6,903 | 44.8% / 22.3% / 32.9% |
| Cerro Gordo | 1,863 | 1,662 | 89.2% | 4,227 | 5,889 | 46.4% / 22.0% / 31.7% |
| Marshall | 1,739 | 1,576 | 90.6% | 3,774 | 5,350 | 43.4% / 18.6% / 38.1% |
| Des Moines | 2,079 | 1,845 | 88.7% | 3,248 | 5,093 | 51.9% / 17.0% / 31.1% |
| Cedar | 1,031 | 913 | 88.6% | 4,072 | 4,985 | 34.2% / 19.5% / 46.3% |
| Muscatine | 1,974 | 1,737 | 88.0% | 3,233 | 4,970 | 46.6% / 17.9% / 35.6% |
| Jasper | 1,786 | 1,576 | 88.2% | 3,233 | 4,809 | 43.7% / 17.7% / 38.6% |
| Winneshiek | 1,101 | 961 | 87.3% | 3,748 | 4,709 | 43.7% / 23.2% / 33.1% |
| Boone | 1,617 | 1,461 | 90.4% | 2,798 | 4,259 | 41.6% / 20.9% / 37.5% |
| Dickinson | 1,238 | 1,078 | 87.1% | 3,161 | 4,239 | 25.7% / 19.0% / 55.3% |
| Marion | 2,257 | 1,977 | 87.6% | 2,262 | 4,239 | 33.2% / 18.5% / 48.3% |
| Lee | 1,753 | 1,583 | 90.3% | 2,536 | 4,119 | 50.2% / 16.9% / 32.9% |
| Bremer | 1,400 | 1,244 | 88.9% | 2,341 | 3,585 | 39.5% / 25.7% / 34.8% |
| Plymouth | 1,351 | 1,181 | 87.4% | 2,084 | 3,265 | 23.0% / 17.3% / 59.7% |
| Wapello | 1,213 | 1,092 | 90.0% | 2,160 | 3,252 | 47.3% / 16.3% / 36.4% |
| Webster | 1,429 | 1,259 | 88.1% | 1,934 | 3,193 | 45.0% / 15.1% / 39.8% |
| Washington | 1,185 | 1,072 | 90.5% | 2,110 | 3,182 | 37.5% / 18.6% / 43.9% |
| Jefferson | 856 | 715 | 83.5% | 2,298 | 3,013 | 57.9% / 15.1% / 27.0% |
| Sioux | 1,529 | 1,385 | 90.6% | 1,360 | 2,745 | 10.6% / 8.9% / 80.5% |
| Carroll | 1,079 | 865 | 80.2% | 1,856 | 2,721 | 33.5% / 22.6% / 43.8% |
| Jones | 1,271 | 1,131 | 89.0% | 1,569 | 2,700 | 37.1% / 25.1% / 37.7% |
| Poweshiek | 1,045 | 916 | 87.7% | 1,695 | 2,611 | 49.5% / 21.3% / 29.3% |
| Mahaska | 1,053 | 892 | 84.7% | 1,588 | 2,480 | 25.7% / 16.6% / 57.7% |
| Jackson | 1,318 | 1,168 | 88.6% | 1,235 | 2,403 | 44.3% / 15.6% / 40.1% |
| Buchanan | 912 | 796 | 87.3% | 1,584 | 2,380 | 42.1% / 23.3% / 34.6% |
| Clay | 683 | 587 | 85.9% | 1,739 | 2,326 | 28.4% / 16.6% / 55.0% |
| Madison | 718 | 586 | 81.6% | 1,717 | 2,303 | 32.8% / 19.1% / 48.1% |
| Benton | 1,059 | 923 | 87.2% | 1,237 | 2,160 | 35.3% / 19.4% / 45.3% |
| Iowa | 860 | 782 | 90.9% | 1,360 | 2,142 | 35.0% / 23.9% / 41.0% |
| Delaware | 976 | 883 | 90.5% | 1,165 | 2,048 | 34.5% / 21.6% / 43.9% |
| Fayette | 1,043 | 940 | 90.1% | 1,090 | 2,030 | 42.4% / 19.8% / 37.9% |
| Hamilton | 688 | 612 | 89.0% | 1,365 | 1,977 | 36.0% / 16.9% / 47.0% |
| Buena Vista | 551 | 453 | 82.2% | 1,474 | 1,927 | 34.5% / 19.0% / 46.5% |
| Chickasaw | 795 | 697 | 87.7% | 1,228 | 1,925 | 39.0% / 19.2% / 41.8% |
| Hardin | 903 | 758 | 83.9% | 1,105 | 1,863 | 31.9% / 17.2% / 50.9% |
| Kossuth | 863 | 747 | 86.6% | 1,115 | 1,862 | 33.4% / 17.2% / 49.4% |
| Mills | 633 | 536 | 84.7% | 1,325 | 1,861 | 28.8% / 13.8% / 57.4% |
| Allamakee | 636 | 560 | 88.1% | 1,229 | 1,789 | 35.6% / 15.7% / 48.7% |
| Floyd | 719 | 620 | 86.2% | 1,135 | 1,755 | 42.4% / 24.4% / 33.2% |
| Clayton | 797 | 698 | 87.6% | 1,008 | 1,706 | 39.7% / 20.2% / 40.2% |
| Shelby | 623 | 561 | 90.0% | 1,098 | 1,659 | 28.9% / 13.3% / 57.8% |
| Cherokee | 536 | 483 | 90.1% | 1,160 | 1,643 | 25.2% / 14.4% / 60.4% |
| Union | 701 | 629 | 89.7% | 909 | 1,538 | 36.5% / 17.9% / 45.6% |
| Butler | 791 | 706 | 89.3% | 793 | 1,499 | 27.4% / 17.2% / 55.4% |
| Cass | 486 | 397 | 81.7% | 1,074 | 1,471 | 30.1% / 16.7% / 53.2% |
| Page | 707 | 612 | 86.6% | 850 | 1,462 | 26.3% / 13.1% / 60.5% |
| Guthrie | 627 | 523 | 83.4% | 922 | 1,445 | 31.2% / 18.7% / 50.1% |
| Appanoose | 700 | 609 | 87.0% | 830 | 1,439 | 36.9% / 14.8% / 48.3% |
| Grundy | 782 | 693 | 88.6% | 703 | 1,396 | 29.1% / 15.4% / 55.5% |
| Mitchell | 498 | 459 | 92.2% | 868 | 1,327 | 37.9% / 19.6% / 42.5% |
| Crawford | 605 | 506 | 83.6% | 802 | 1,308 | 34.1% / 14.3% / 51.6% |
| Greene | 326 | 287 | 88.0% | 1,004 | 1,291 | 36.3% / 19.7% / 44.1% |
| Tama | 650 | 538 | 82.8% | 727 | 1,265 | 35.8% / 22.1% / 42.1% |
| Harrison | 524 | 466 | 88.9% | 725 | 1,191 | 32.7% / 14.4% / 52.9% |
| Wright | 552 | 474 | 85.9% | 681 | 1,155 | 30.8% / 17.0% / 52.2% |
| Humboldt | 452 | 391 | 86.5% | 726 | 1,117 | 31.6% / 17.4% / 51.0% |
| Palo Alto | 446 | 360 | 80.7% | 724 | 1,084 | 38.6% / 16.3% / 45.1% |
| Louisa | 388 | 341 | 87.9% | 737 | 1,078 | 37.0% / 18.6% / 44.3% |
| Lucas | 339 | 306 | 90.3% | 738 | 1,044 | 30.8% / 20.0% / 49.1% |
| Monroe | 304 | 257 | 84.5% | 729 | 986 | 35.0% / 17.0% / 48.0% |
| Winnebago | 454 | 380 | 83.7% | 602 | 982 | 37.8% / 19.0% / 43.2% |
| Howard | 350 | 309 | 88.3% | 662 | 971 | 41.8% / 28.2% / 30.0% |
| Franklin | 394 | 351 | 89.1% | 616 | 967 | 31.0% / 16.1% / 52.8% |
| Montgomery | 480 | 406 | 84.6% | 560 | 966 | 32.3% / 11.8% / 55.9% |
| Hancock | 442 | 396 | 89.6% | 569 | 965 | 34.6% / 11.3% / 54.1% |
| Clarke | 317 | 279 | 88.0% | 685 | 964 | 38.3% / 17.7% / 44.0% |
| O'Brien | 597 | 508 | 85.1% | 446 | 954 | 20.2% / 10.3% / 69.5% |
| Adair | 302 | 266 | 88.1% | 658 | 924 | 27.8% / 18.7% / 53.5% |
| Calhoun | 435 | 365 | 83.9% | 550 | 915 | 29.9% / 19.1% / 50.9% |
| Lyon | 518 | 429 | 82.8% | 432 | 861 | 14.4% / 8.4% / 77.2% |
| Emmet | 279 | 242 | 86.7% | 600 | 842 | 39.9% / 18.4% / 41.7% |
| Monona | 333 | 267 | 80.2% | 574 | 841 | 35.4% / 14.6% / 49.9% |
| Sac | 373 | 320 | 85.8% | 497 | 817 | 26.4% / 15.8% / 57.8% |
| Keokuk | 415 | 350 | 84.3% | 465 | 815 | 33.4% / 17.1% / 49.6% |
| Davis | 309 | 261 | 84.5% | 548 | 809 | 36.7% / 10.9% / 52.4% |
| Decatur | 259 | 220 | 84.9% | 502 | 722 | 33.9% / 16.1% / 50.0% |
| Pocahontas | 350 | 289 | 82.6% | 426 | 715 | 28.8% / 16.1% / 55.1% |
| Audubon | 340 | 285 | 83.8% | 428 | 713 | 33.0% / 17.1% / 49.9% |
| Henry | 787 | 688 | 87.4% | 5 | 693 | 40.0% / 14.9% / 45.2% |
| Fremont | 271 | 249 | 91.9% | 405 | 654 | 33.3% / 13.3% / 53.4% |
| Van Buren | 238 | 192 | 80.7% | 462 | 654 | 26.3% / 14.2% / 59.5% |
| Ringgold | 244 | 209 | 85.7% | 435 | 644 | 29.3% / 11.3% / 59.3% |
| Wayne | 235 | 206 | 87.7% | 417 | 623 | 29.7% / 14.4% / 55.9% |
| Worth | 291 | 260 | 89.3% | 353 | 613 | 44.7% / 15.2% / 40.1% |
| Ida | 271 | 238 | 87.8% | 339 | 577 | 28.9% / 13.7% / 57.4% |
| Taylor | 276 | 236 | 85.5% | 299 | 535 | 21.1% / 14.6% / 64.3% |
| Adams | 168 | 149 | 88.7% | 368 | 517 | 28.4% / 19.3% / 52.2% |
| Osceola | 240 | 208 | 86.7% | 203 | 411 | 17.0% / 13.4% / 69.6% |
Nonpartisan voter information. GOTV Polling does not endorse any candidate.